Coder Social home page Coder Social logo

data-visualization's Introduction

Data Visualization and prediction with Python and SQL

This project is focused on show and learn ML concepts to predic a virtual precipitation of rain. The database is available on Kaggle. The dataset used in this project have some informations about rain in some USA cities. When i decided to start this project i was focused and just show a plot of the data, but in the progress i learned a lot about ML algorithm's. So i decided to use some of them in this project.

Used technologies:

  • Python: Used to clean, organize and upload the data to a database.
  • Docker: Used to containerize the files and allow the easy share and deploy of the project.
  • MySQL: DBMS used to manage the database and the process of the DMBS.
  • Pandas: Used to manipulate the data inside the script.
  • Matplotlib: Used to plot the data.
  • SciKit-Learn: Used to train the ML algorithm with the data.

Plot image:

plot image

Machine Learning algorithm:

I used the Linear Regression algorithm to analyze the data. This algorithm get two variables one as a target value and two variables for the training data. The algorithm tests the data and discover a relation between the input values and the target value. Then, he create a function

y=f(x)

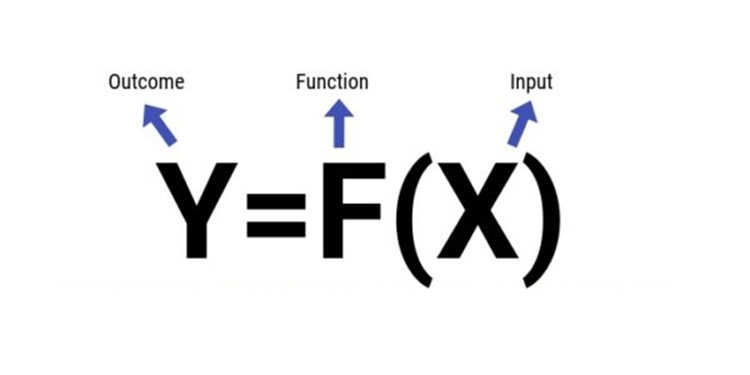
Then, he calculate and predict a result.

The target of this project is to predic a precipitation mm with a input data, the humidity of the air in the moment of the analyses and the temperature of the moment.

Why this project is inside a docker file?

With a docker file, everyone can run this on any platform. So, by this, my project is a cross-platform project. And you can run without concern about the installation requirements of the project.

But, why you shoud use MySQL as DMBS?

This DBMS (Database Management System) can store and easily manipulate the data. So, if you want to access the data after run the Linear Regression algorithm with another algorithm, the data are stored inside a database. And this DMBS is easy to use and have a very compatible DBAPI with Python.

data-visualization's People

Contributors

filipystudy avatar

Stargazers

 avatar

Watchers

 avatar

data-visualization's Issues

Recommend Projects

  • React photo React

    A declarative, efficient, and flexible JavaScript library for building user interfaces.

  • Vue.js photo Vue.js

    ๐Ÿ–– Vue.js is a progressive, incrementally-adoptable JavaScript framework for building UI on the web.

  • Typescript photo Typescript

    TypeScript is a superset of JavaScript that compiles to clean JavaScript output.

  • TensorFlow photo TensorFlow

    An Open Source Machine Learning Framework for Everyone

  • Django photo Django

    The Web framework for perfectionists with deadlines.

  • D3 photo D3

    Bring data to life with SVG, Canvas and HTML. ๐Ÿ“Š๐Ÿ“ˆ๐ŸŽ‰

Recommend Topics

  • javascript

    JavaScript (JS) is a lightweight interpreted programming language with first-class functions.

  • web

    Some thing interesting about web. New door for the world.

  • server

    A server is a program made to process requests and deliver data to clients.

  • Machine learning

    Machine learning is a way of modeling and interpreting data that allows a piece of software to respond intelligently.

  • Game

    Some thing interesting about game, make everyone happy.

Recommend Org

  • Facebook photo Facebook

    We are working to build community through open source technology. NB: members must have two-factor auth.

  • Microsoft photo Microsoft

    Open source projects and samples from Microsoft.

  • Google photo Google

    Google โค๏ธ Open Source for everyone.

  • D3 photo D3

    Data-Driven Documents codes.