A simple, client-side, JSON-based Graphite logical-dashboard UI built with bootstrap and underscore.js
Graphitus is pure client side, all you have to do to run it is put it under a web-server that can serve HTTP requests.
Graphitus dashboards are defined using JSON notation. These configuration snippets can be stored in a document database like couchdb or mongo and can also be files on the server.
Below is an example of global configuration (a file named config.json) using static local JSON files (the dashboards ids are the file names with a .json extension):
{
    "graphiteUrl": "http://graphite.mysite.com",
    "dashboardListUrl": "dashboard-index.json",
    "dashboardUrlTemplate": "${dashboardId}.json",
    "eventsUrl": "events.json?start=<%=start%>&end=<%=end%>",
    "eventsDateFormat": "HH:mm:ss DD/MM/YYYY",
    "eventsTimezone": "US/Eastern",
    "minimumRefresh": 60,
    "metricsQueryUrl": "http://my.graphite.com/metrics/find?format=completer&query=",
    "grafanaElasticSearch": "http://my.elasticsearch.com:9200/grafana-dash/dashboard/",
    "grafanaUrl" : "http://my.grafana.com/index.html#/dashboard/elasticsearch/",
    "timezones": ["US/Eastern", "US/Central", "US/Pacific", "Europe/London", "Israel"]
}
Below is an example of global configuration (a file named config.json) using couch db:
{
    "graphiteUrl": "http://graphite.mysite.com",
    "dashboardListUrl": "http://couch.mysite.com:5984/graphitus-dashboards/_all_docs", // must return a JSON with a "rows" element containing an array of rows with dashboard id ("id" attribute)
    "dashboardUrlTemplate": "http://couch.mysite.com:5984/graphitus-dashboards/${dashboardId}",
    "eventsUrl": "events.json?start=<%=start%>&end=<%=end%>", // events for rickshaw graph, start/end timeframe will be passed
    "eventsDateFormat": "HH:mm:ss DD/MM/YYYY", // the event date-time format
    "eventsTimezone": "US/Eastern",
    "minimumRefresh": 60, // minimum refresh overrides anything defined in the dashboards
    "metricsQueryUrl": "http://my.graphite.com/metrics/find?format=completer&query=", // metrics finder url, overriding this allows proxying/caching the graphite metrics finder
    "grafanaElasticSearch": "http://my.elasticsearch.com:9200/grafana-dash/dashboard/", // optional grafana elasticsearch url for grafana export integration
    "grafanaUrl" : "http://my.grafana.com/index.html#/dashboard/elasticsearch/", // optional grafana home url for grafana export integration
    "timezones": ["US/Eastern", "US/Central", "US/Pacific", "Europe/London", "Israel"] // a list of timezone for graphite
}Below is an example dashboard configuration:
{
    "title": "MySQL Production Cluster", // give a title to page
    "columns": 2, // the number of charts in a row side by side, mostly 2 or 4
    "user": "erezmazor", // owner
    "timeBack": 12h, // time range back from current time (can be expressed in minutes/hours/days/weeks e.g., 30m/12h/1d/2w)
    "from": "", // start date for the date range, prefer timeBack as any date you choose will become stale
    "until": "", // end date for the date range, prefer timeBack as any date you choose will become stale
    "width": 700, // width of each chart image, should correlate with # columns defined
    "height": 450, // height of each chart image
    "legend": true, // show the legend in chart
    "refresh": true, // auto refresh
    "refreshIntervalSeconds": 90, // auto refresh interval in seconds
    "averageSeries": false, // for targets that aggregate a lot of metrics prefer setting this to true as it will average many lines into one
    "defaultLineWidth": 2, // line width for chart lines
    "defaultParameters": "areaMode=stacked&areaAlpha=.5", // default url parameters to be applied to all targets
    "tz": "US/Eastern", // timezone for the rendered graph
    "data": [ // charts list
        {
            "title": "Slow Queries", // a title for the chart image
            "target": "groupByNode(machines.${dc}dc1.mysql*.Slow_queries,2,\"nonNegativeDerivative\")", // the graphite target/function which defines the chart content
            "params": "areaMode=stacked&lineMode=staircase&colorList=blue,red,green" // specify additional parameters for this target
        }, {
            "title": "Seconds Behind Master",
            "target": "groupByNode(machines.${dc}dc1.mysql*.Seconds_Behind_Master,2,\"averageSeries\")"
        }, {
            "title": "Queries Per Second",
            "target": [ // you can specify mutliple targets for a chart as a JSON array
                "derivative(machines.${dc}dc1.mysql*.Qps1)",
                "derivative(machines.${dc}dc1.mysql*.Qps2)"
            ],
            "description": "The number of queries per second executed by the server" // show a description tooltip next to the title
        }
    ],
    "parameters": { // parameters to tokens expressed in targets with ${paramName} format
        "datacenter": { // label for a select box in the UI
            "All": { // display name for a select box in the UI
                "dc": "*" // the token name (dc) as specified in the target name and the actual token value (*)
            },
            "New York": {
                "dc": "ny"
            },
            "LA": {
                "dc": "la"
            },
            "Chicago": {
                "dc": "chi"
            }
        }
    }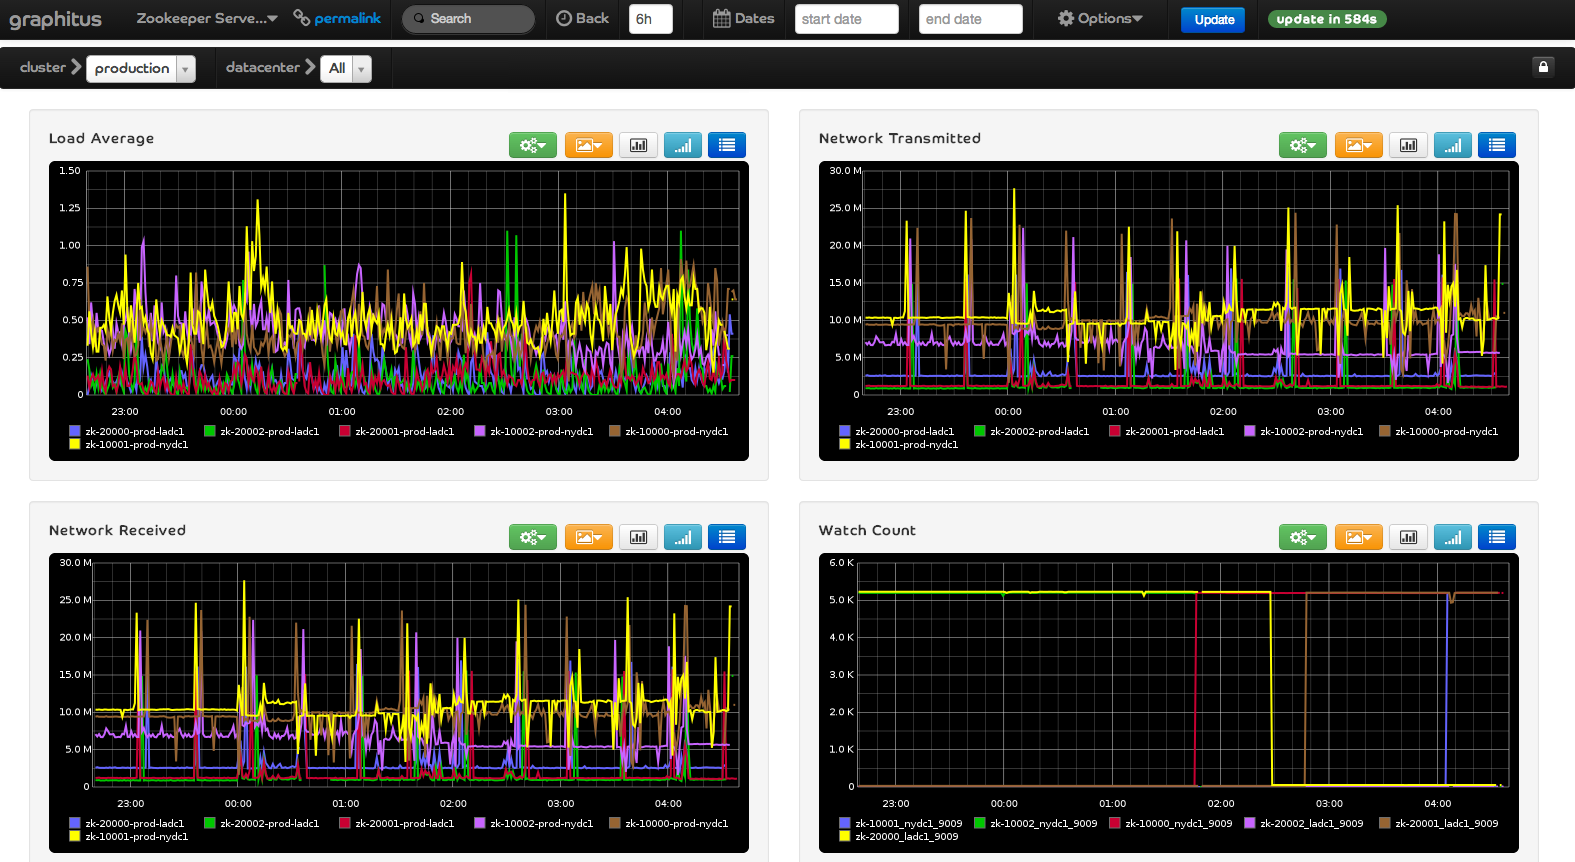
}- Below is a screenshot of a sample dashboard:
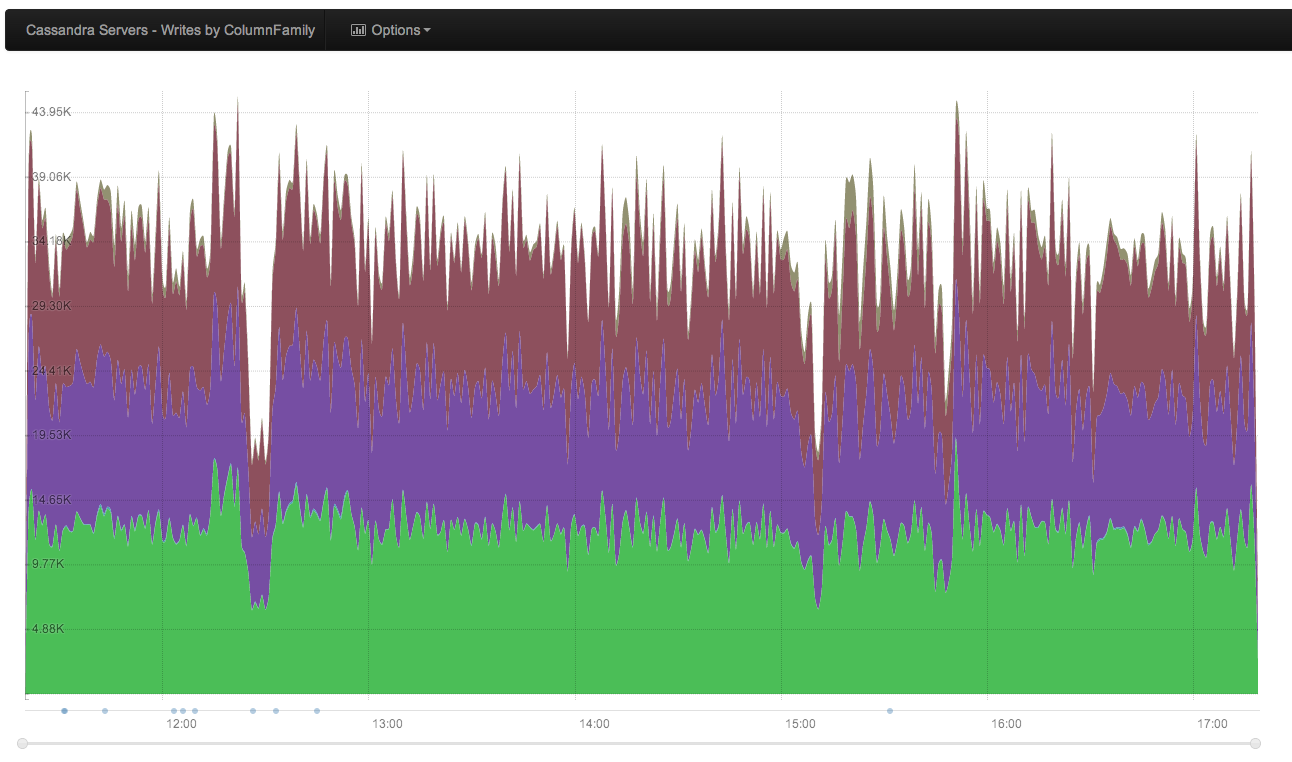
- Clicking on a graph image will generate a nice Rickshaw-based graph with hover-values and a toggle-legend
** Events on rickshaw graph
supplying an eventsUrl attribute in config.json will allow you to draw an events overlay on the rickshaw graph. The selected timeframe will be passed in to the eventsUrl in the format eventsUrl?start=YYYY-MM-DD HH:mm:ss&end=YYYY-MM-DD HH:mm:ss. events must be in the following JSON format:
[
	{
    	"message": "this is an event message",
		"start": "15:31:35 28/03/2013",
		"end": "15:33:47 28/03/2013"
	},
{
    	"message": "this is an event message",
		"start": "15:31:35 28/03/2013",
		"end": "15:33:47 28/03/2013"
	}
]
The date/time format and timezone can be customized by providing a eventsDateFormat and eventsTimezone properties in the config.json configuration file.
- Clicking on a the
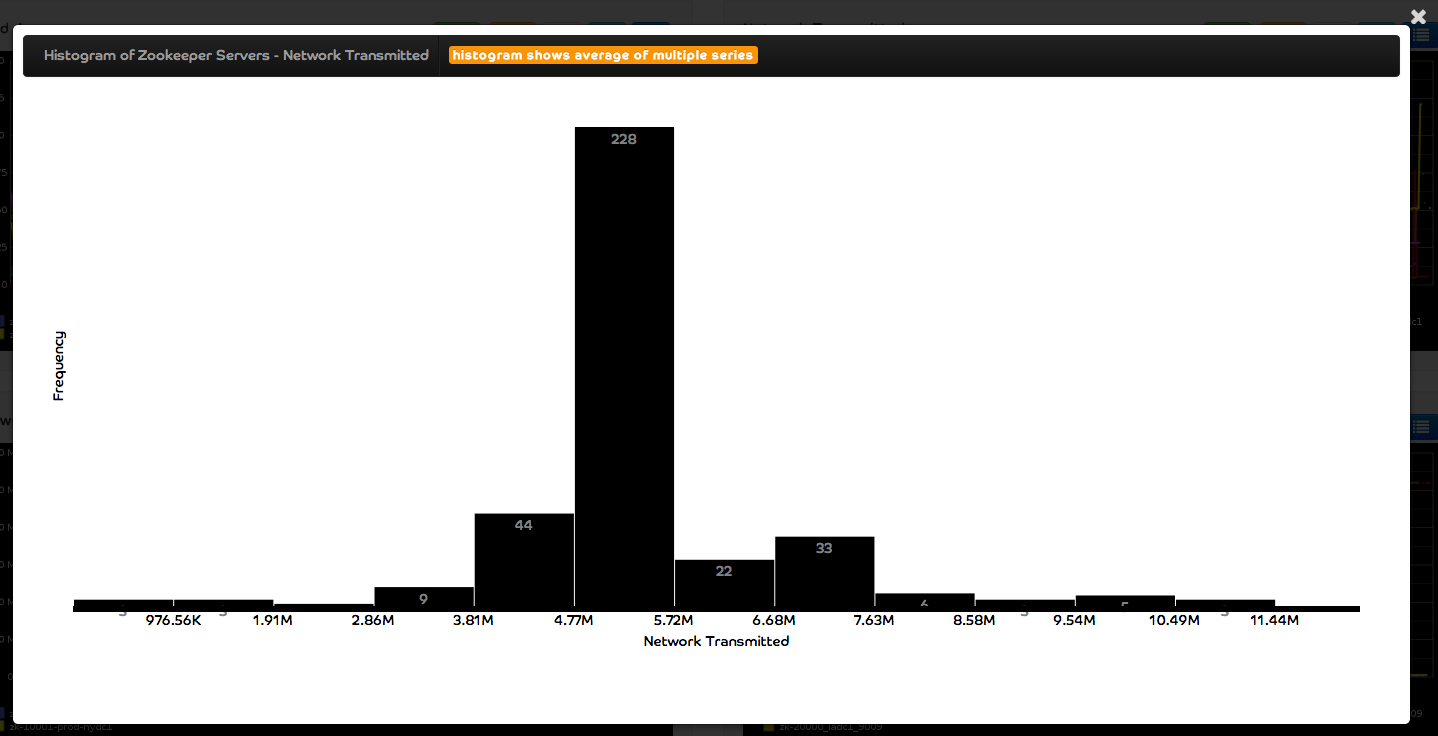
histogrambutton () will generate a D3 Histogram

- Clicking on a the
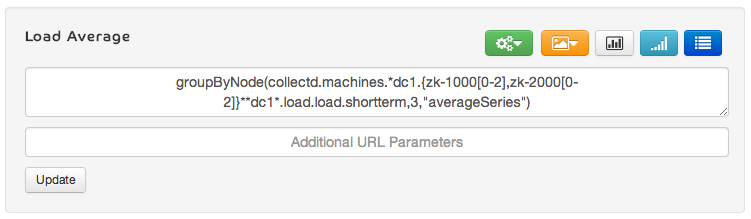
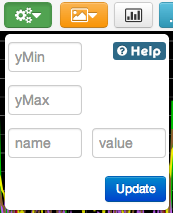
sourcebutton () will show the target source and allow you to edit it in place

- Clicking on a the
functionsbutton () will show some options for manipulating the graph using the Graphite URL API

- Clicking on a the
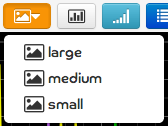
imagesbutton () will show a drop down with permalinks to the image in small, medium and large sizes (useful for sending links or copying images into email)

-
Clicking on a the
graphlotbutton () will redirect you to the graph's
Graphlotpage in your graphite server. -
Override configuration with URL parameters

You can specify configuration properties in the dashboard URL to override default settings:
dashboard.html?id=grp1.dash1&defaultLineWidth=25&timeBack=20m&width=350&height=400&columns=4&legend=false
You can also specify parameter values in the URL:
dashboard.html?id=grp1.dash1&datacenter=LA
| Parameter | Required? | Description |
|---|---|---|
| title | Yes | The title of the dashboard chart |
| columns | Yes | The number of images in a row |
| user | No | Owner |
| timeBack | No | Specify timeframe back from current time to display (specify this or from and until), shorthand format e.g., 15m, 24h, 7d, 1w |
| from | No | From date/time in yyyy-MM-dd HH:MM (specify this and until or timeBack) |
| until | No | To date/time in yyyy-MM-dd HH:MM (specify this and from or timeBack) |
| width | Yes | Width of the chart from graphite (see columns) |
| height | Yes | Height of the chart from graphite |
| legend | No | Show/Hide the legend in the chart (omitting leaves it up to graphite) |
| refresh | No | Auto-refresh the charts (see refreshIntervalSeconds) |
| refreshIntervalSeconds | No | When refresh is true this will determine the refresh interval |
| defaultLineWidth | No | The line width for the generated chart |
| defaultParameters | No | Default url parameters to be applied to all targets |
| tz | No | The timezone for the rendered graphite images (see Timezone list). Note: timezone resolution is in the following order url, json configuraiton file, cookie, default. |
Dynamic parameters allow you to define metric selection and filtering based on dynamic graphite metric API queries. Structuring your graphite metrics tree properly can be useful to create such dashboaards.
Consider the following configuration for the parameters section of the configuration
"service": {
    "type": "dynamic",
    "query": "services.prod.*",
    "index": 2,
    "showAll": false
},
 "host": {
    "type": "dynamic",
    "query": "services.prod.${service}.*",
    "index": 3,
    "regex": "(.*)_",
    "showAll": true
},
 "datacenter": {
    "type": "dynamic",
    "query": "services.prod.${service}.${host}_*",
    "index": 3,
    "regex": "_(.*)",
    "showAll": true,
    "showAllValue": "host-10000*"
}
You can then use a target like services.prod.${service}.${host}_${datacenter}.someAttribute. When graphitus loads it will generate select boxes based on the actual values returned from the graphite metric API based on the provided queries. Note that the queries themselves can be parameterized, creating a series of select boxes depending on each other in-order.
Graphitus will also consider generating the list of values from a partial path, the index and regex determine which portion and substring (regex) of the resulting path will be used to generate the values for selection. The showAll property is used to determine if graphitus will prepend a default All (translated to * in the graphite query) option to the selection. The showAllValue parameter can be added to override the default * selection for complex name filtering schemes (you can have token in this value to express dependencies on other parameters).
Graphitus path tokenization works well when you structure youd graphite metrics according to a well defined scheme. Consider the following path for graphite metrics: services.prod.myService.dc1.host1.myMetric.value which can be tokenized as services.${environment}.${service}.${datacenter}.${host}.${metric}.value
This well-structured hierarchy provides powerful grouping capabilities, for example using the above path structure you can create a generic grouping scheme where you can group values by different aspects. This is achieved using the groupByNode or aliasByNode graphite functions. Here is the graphitus target definition:
"data": [{
	"target": "groupByNode(services.${environment}.${service}.${datacenter}.${host}.${metric}.value,${group},\"averageSeries\")",
	"title": "Metric A Value"
}]
And the corresponding parameters section:
"parameters": {
    "environment": {
        "type": "dynamic",
        "query": "services.*",
        "index": 1,
        "showAll": true
    },
    "service": {
        "type": "dynamic",
        "query": "services.${environment}.*",
        "index": 2,
        "showAll": true
    },
    "datacenter": {
        "type": "dynamic",
        "query": "services.${environment}.${service}.*",
        "index": 3,
        "showAll": true
    },
    "host": {
        "type": "dynamic",
        "query": "services.${environment}.${service}.${datacenter}.*",
        "index": 4,
        "showAll": true
    },
    "metric": {
        "type": "dynamic",
        "query": "services.${environment}.${service}.${datacenter}.${host}.*",
        "index": 5,
        "showAll": true
    },
    "group": {
        "environment": {
            "group": 1
        },
        "service": {
            "group": 2
        },
        "datacenter": {
            "group": 3
        },
        "host": {
            "group": 4
        },
        "metric": {
            "group": 5
        }
    }
}Graphitus supports timezones via configuration config.json has a timezones attribute which accepts an array. These are timezones supported by the Graphite URL API Timezone parameter. Timezones are supported using the moment-timezone library. In order to correctly define timezones use the moment-timezone data builder to customize your own js/moment-timezone-data.js file. Note that moment zone names are different from graphite names, once you generate the js/moment-timezone-data.js file edit it and change timezone names to correspond to the supported graphite names.
A slideshow of all graphs in the dashboard can be triggered via the UI button or by appending &slideshow=true at the end of the dashboard URL.
Grafana is another dashboard based system. Some beta functionality for exporting Graphitus dashboards to Grafana exists via the Options menu. Not all features migrate transparently and this is currently experimental. See config.json for relevant configuration.