Coder Social home page Coder Social logo

esri / esri-leaflet Goto Github PK

View Code? Open in Web Editor NEW
1.6K 174.0 793.0 25.55 MB

A lightweight set of tools for working with ArcGIS services in Leaflet. :rocket:

Home Page: https://developers.arcgis.com/esri-leaflet/

License: Apache License 2.0

HTML 0.52% JavaScript 99.17% Shell 0.30%
esri-leaflet javascript leaflet-plugins arcgis esri web-development hacktoberfest

esri-leaflet's Introduction

Esri Leaflet

npm version apache licensed jsDelivr Hits

Leaflet plugins for working with a handful of the most popular ArcGIS Service types. This includes Esri basemaps and feature services, as well as tiled map, dynamic map and image services.

This project is maintained with ❤️ by folks on multiple teams at Esri, but we provide no guarantee of individual features, nor a traditional product lifecycle to support planning.

The goal of this project is not to replace the ArcGIS API for JavaScript but rather to provide small components for only some aspects of the ArcGIS platform for developers who prefer to build mapping applications with Leaflet.

We are proud to facilitate a project which requires participation from our diverse user community in order to thrive and we welcome contributions from those just getting their feet wet in open-source.

Support for Geocoding services and Geoprocessing services, as well as service defined rendering are available as well (via additional plugins).

If you'd like to display Esri services in any Leaflet application, we ask that you adhere to our Terms of Use and attribution requirements.

Table of Contents

Quick Start

The easiest way to get started is to load Esri Leaflet via CDN. Here is an example you can copy/paste into your own .html file: Esri Leaflet Quick Start

App

Samples, tutorials, and the API reference can be found at developers.arcgis.com/esri-leaflet.

If you notice any issues or would like to propose a change to the documentation, please let us know by creating an issue in this repository.

Additional Plugins

Many folks have written plugins to customize and extend Leaflet.

http://leafletjs.com/plugins.html

You can also pick and choose additional Esri Leaflet plugins.

https://developers.arcgis.com/esri-leaflet/plugins/

Frequently Asked Questions

Issues

If something isn't working the way you expected, please take a look at previously logged issues that resolve common problems first. Have you found a new bug? Want to request a new feature? We'd love to hear from you. Please let us know by submitting an issue.

If you're looking for help you can also find answers on Stack Overflow and GeoNet.

Going Deeper

Development Instructions

If you'd like to inspect and modify the source of Esri Leaflet, follow the instructions below to set up a local development environment.

  1. Fork and clone Esri Leaflet
  2. cd into the esri-leaflet folder
  3. Install the package.json dependencies by running npm install
  4. Run npm start from the command line. This will compile minified source in a brand new dist directory, launch a tiny webserver and begin watching the raw source for changes.
  5. Run npm test to make sure you haven't introduced a new 'feature' accidentally.
  6. Make your changes and create a pull request

Dependencies

  • Esri Leaflet 1.x (available on CDN) can be used in apps alongside:

  • Esri Leaflet 2.x (available on CDN) can be used in apps alongside:

The master branch of this repository is only compatible with Leaflet 1.x.

Versioning

For transparency into the release cycle and in striving to maintain backward compatibility, Esri Leaflet is maintained under Semantic Versioning guidelines and will adhere to these rules whenever possible.

For more information on SemVer, please visit http://semver.org/.

Contributing

Esri welcomes contributions from anyone and everyone. Please see our guidelines for contributing.

Terms

If you're using Esri content and services, you'll need to license your usage with an API key or an ArcGIS identity. Full details can be found here: Deployment guidelines.

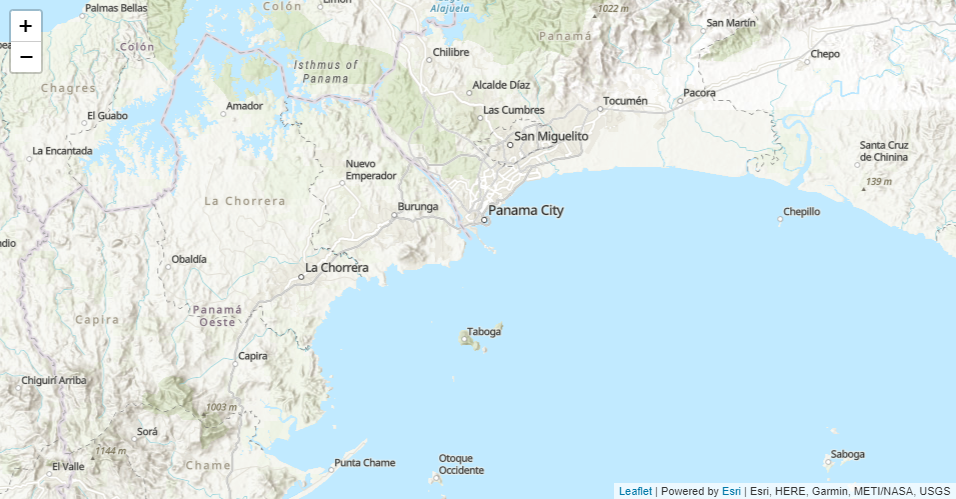
If you display an ArcGIS Online service in any Leaflet application, we require that you include Esri attribution and recognize data providers. Using this plugin, it couldn't be easier to follow the terms. Just select your basemap and the appropriate credits will be displayed dynamically in Leaflet's own Attribution control as users pan/zoom.

L.esri.basemapLayer('Topographic').addTo(map);

attribution

Credit

License

Copyright © 2014-2019 Esri

Licensed under the Apache License, Version 2.0 (the "License"); you may not use this file except in compliance with the License. You may obtain a copy of the License at

http://www.apache.org/licenses/LICENSE-2.0

Unless required by applicable law or agreed to in writing, software distributed under the License is distributed on an "AS IS" BASIS, WITHOUT WARRANTIES OR CONDITIONS OF ANY KIND, either express or implied. See the License for the specific language governing permissions and limitations under the License.

A copy of the license is available in the repository's LICENSE file.

esri-leaflet's People

Stargazers

 avatar  avatar  avatar  avatar  avatar  avatar  avatar  avatar  avatar  avatar  avatar  avatar  avatar  avatar  avatar  avatar  avatar  avatar  avatar  avatar  avatar  avatar  avatar  avatar  avatar  avatar  avatar  avatar  avatar  avatar  avatar  avatar  avatar  avatar  avatar  avatar  avatar  avatar  avatar  avatar  avatar  avatar  avatar  avatar  avatar  avatar  avatar  avatar  avatar  avatar  avatar  avatar  avatar  avatar  avatar  avatar  avatar  avatar  avatar  avatar  avatar  avatar  avatar  avatar  avatar  avatar  avatar  avatar  avatar  avatar  avatar  avatar  avatar  avatar  avatar  avatar  avatar  avatar  avatar  avatar  avatar  avatar  avatar  avatar  avatar  avatar  avatar  avatar  avatar  avatar  avatar  avatar  avatar  avatar  avatar  avatar  avatar  avatar  avatar  avatar

Watchers

 avatar  avatar  avatar  avatar  avatar  avatar  avatar  avatar  avatar  avatar  avatar  avatar  avatar  avatar  avatar  avatar  avatar  avatar  avatar  avatar  avatar  avatar  avatar  avatar  avatar  avatar  avatar  avatar  avatar  avatar  avatar  avatar  avatar  avatar  avatar  avatar  avatar  avatar  avatar  avatar  avatar  avatar  avatar  avatar  avatar  avatar  avatar  avatar  avatar  avatar  avatar  avatar  avatar  avatar  avatar  avatar  avatar  avatar  avatar  avatar  avatar  avatar  avatar  avatar  avatar  avatar  avatar  avatar  avatar  avatar  avatar  avatar  avatar  avatar  avatar  avatar  avatar  avatar  avatar  avatar  avatar  avatar  avatar  avatar  avatar  avatar  avatar  avatar  avatar  avatar  avatar  avatar  avatar  avatar  avatar  avatar  avatar  avatar  avatar  avatar

esri-leaflet's Issues

dynamic layer identify issue

I'm able to successfully execute your example, but when our internal services are queried I'm getting: 'error: "Could not parse response as JSON."'

jen.dyn = L.esri.dynamicMapLayer('my/internal/address/goes/here',{
    opacity: 0.5,
    layers: [0]
});
jen.map.addLayer(jen.dyn);

jen.map.on('click', function(e) {
    jen.dyn.identify(e.latlng, function(data) {
        if (data.results.length > 0) {
            var popupText = '<center><b>' + data.results[0].Layer + '</b><br>' + data.results[0].attributes.DOTNUM + '</center>';
            var popup = L.popup()
                .setLatLng(e.latlng)
                .setContent(popupText)
                .openOn(jen.map);
        }
    });
});

Add support for loading a WebMap JSON

The WebMap JSON specification provides a simple way to encapsulate a list of layers, map styling, basemap, and bookmarks.

It would be useful to provide support for loading any WebMap JSON into leaflet, and also encourage other tools to consume and publish WebMaps.

DynamicMapLayer not refreshing correctly

Load any of these layer into a map and pan around. The layer does not refresh correctly (leaves empty tiles) and is pretty slow. The issue is more obvious when retina is true due to 4x the tiles being generated on the server.

mapUrl = "http://services.arcgisonline.com/ArcGIS/rest/services/Demographics/USA_Average_Household_Size/MapServer"

//http://services.arcgisonline.com/ArcGIS/rest/services/Demographics/USA_Projected_Population_Change/MapServer

//http://services.arcgisonline.com/ArcGIS/rest/services/Demographics/USA_Tapestry/MapServer

L.esri.dynamicMapLayer(mapUrl, {opacity: 0.25, zIndex:2, detectRetina: true}).addTo(map);

Cluster Layer Visibility not toggling within Layers Control.

While using the layers control for an Esri ClusteredFeatureLayer there seems to be an issue with toggling visibility.

I add the layer to the layers control, when I click the check box to make layer visible, layer becomes visible. When I unchecked the box, layer stayed visible.

Add support for private service and authentication

In the interest of keeping this simple I want to impliment this as follows.

L.featureLayer(url, {
  token: "AN_ACCESS_TOKEN"
})

This will set this.options.token on the object. Then whenever a request is made to the service that token should be added to the request params.

This approach will keep the code lightweight, simple and clear and allow developers to pick an choose their authentication mechanism. The disadvantage is that it will be more work for developers as we will not handle token generation or error handling when a token expires.

Dynamic Map Layer renders over geoJson Layer after pan or zoom

To reproduce the issue add a basemap layer, dynamic layer and a geoJson layer on top. On load it all renders in correct order, after panning or zooming the dynamic layer renders over the geoJson layer. So the layer order is switched.

code to reproduce...

    var map = L.map('map').setView([41.00 ,- 109.05], 5);
    L.esri.basemapLayer("Gray").addTo(map);

    L.esri.dynamicMapLayer("http://sampleserver1.arcgisonline.com/ArcGIS/rest/services/Demographics/ESRI_Census_USA/MapServer", {
        layers: [5, 4, 3]
    }).addTo(map);

    var states = [{
        "type": "Feature",
        "properties": { "party": "Democrat" },
        "geometry": {
            "type": "Polygon",
            "coordinates": [[
                [-109.05, 41.00],
                [-80, 40.99],
                [-80, 36.99],
                [-109.04, 36.99],
                [-109.05, 41.00]
            ]]
        }
    }];

    L.geoJson(states, {
        style: function (feature) {
            switch (feature.properties.party) {
                case 'Republican': return { color: "red", opacity: 1, fillColor: "red" };
                case 'Democrat': return { color: "blue", opacity: 1, fillColor: "blue"};
            }
        }
    }).addTo(map);

the issue looks like it is here...(DynamicMapLayer.js)
_onNewImageLoad: function () {
........
this._map._panes.overlayPane.appendChild(this._newImage);
this._map._panes.overlayPane.removeChild(this._image);

this stops the issue... (not sure if it is the right approach - still new to leaflet.js)

if (this._image == null) {
this._map._panes.overlayPane.appendChild(this._newImage);
} else {
this._map._panes.overlayPane.insertBefore(this._newImage,this._image);
}
this._map._panes.overlayPane.removeChild(this._image);

Add Esri.L namespace to new BasemapLayer.js

  1. Currently it's not possible to create an L.esri.basemapLayer() instance by referencing esri-leaflet.min.js or BasemapLayer.js. Please add the namespace to BasemapLayer.js so it can be used in to create the object on it's own without other dependencies.

if(typeof L.esri === "undefined"){
L.esri = {};
}

  1. Rebuild .min files.

Tks

'GrayLabels' basemapLayer doesn't display correctly.

i just noticed that the 'GrayLabels' basemapLayer is a little "too" gray.

var map = L.map('map', {
            center : [31, -100],
            zoom : 3
        });

//'Gray' looks good, but something's wrong with 'GrayLabels'
L.esri.basemapLayer("GrayLabels").addTo(map);

toogray

Gridded queries for FeatureLayer

In the ArcGIS Javascript API when a FeatureLayer is in on demand mode queries are made against a grid that is independent of the map view so calls to the service get cached (403).

We should do something similar for L.esri.FeatureLayer if we get a 403 response we can simply ignore all the features in that call (since that means there was already a request made for that grid square) which will also cut down on processing time.

Misalignment on Dynamic layers using layers control with layers initially turned off

I added 10 Dynamic Layers to a layer control (as overlays) with each layer turned off initially. If I don't pan the map when I first open it, turn on a layer, it's displayed correctly. However, if I open the map page, pan the basemap, then turn on a dynamic layer, the points/polygons are shifted over to the left. Panning/zooming snaps the layer back into the correct place.

If I then turn off the layer, then pan, turn the layer back on, it displays correctly. So it appears to only occur the first time.

FeatureLayer Performance Enhancements

This issue collects ideas for improving the performance of L.esri.FeatureLayer.

  • #12 Gridded queries for FeatureLayer
  • #14 Investigate performance difference of hiding feature vs removing them.
  • #13 Simplify polygons and polylines based on zoom.
  • #15 Option to run the processing code in a web worker for extra performance

Many ideas were inspired by https://speakerdeck.com/mourner/high-performance-data-visualizations and conversations with @swingley on the ArcGIS Javascript API

Add "identify" method to TiledMapLayer

Some tile servers do support the identify method. We should just move the identify method to a mixin L.esri.Mixins.Identify and include it in L.esri.TiledMapLayer and L.esri.DynamicMapLayer.

@alaframboise can you give me an example of a tiled map server that supports identify?

Investigate performance difference of hiding feature vs removing them.

@swingley told me that the ArcGIS Javascript API simply sets something like display:none; or visibility:hidden; to hide features that are outside the map view on FeatureLayer.

Currently we are removing features when they move out fo the map viewport and adding the same object back in when it renters.

We should look at the performance differences of each.

All demos should be mobile friendly

Dasa Paddock noticed that most demos dont work on iPhone. All demos probally need a viewport set and maybe some stuff like test boxes to be hidden
image

IE 8-10 '__defineGetter__' error

Error occurs for Demos:

  • Add Feature Layer
  • Feature Service Info
  • Symbolize Point Features
  • Symbolize Line Features

Occurring for IE 8-10.

SCRIPT438: Object doesn't support property or method 'defineGetter'
esri-leaflet.min.js, line 4 character 5504

Dynamic Map Service Popups

Provide Popup support for Dynamic Layers. Currently, we need to create a global variable for the map on click event result, then use that result within the identify result callback. It would be nice if the popup would work similarly to the feature service.

Here is how I currently handle the popup.

 map.on("click", function(e) {
    mapEvent = e;

    dynLayer.identify(e.latlng, function(data) {
        if(data.results.length > 0)
        {
            var popup = L.popup()
            .setLatLng(mapEvent.latlng)
            .setContent(data.results[0].value)
            .openOn(map);
        }
    });

 });

Prepare for Terraformer 1.0

Soon Terraformer will be a stable 1.0 Esri/terraformer#138 and all its components will be broken out into separate repositories.

This means we will have to change the project structure to accommodate Terraformer, Terraformer ArcGIS and Terraformer RTree as separate submodules and/or bower components.

Add Testing with Karma and Jasmine

Leaflet uses Karma and Jasmine to do their testing. This is a solid testing framework I have a lot of experience with and is very compatible with Grunt.

Dynamic Map Services must be published in Web Mercator?

the README currently states that DynamicMapLayers must come from a service published in Web Mercator but they actually draw quite well no matter what the projection of the original service (because we ask for a reprojected tile).

http://gravois/leaflet/dynamicReprojected.html

Am i missing the reason for discouraging this (besides the performance hit?)

If we want to publicize support, I am happy to write up a simple sample demonstrating that its possible.

Include installation instructions

It'd be good to mention how to obtain the submodules in the build instructions, as they aren't entirely common, and if Terraformer and Leaflet are missing the demos fail in a non-obvious way. Fixing was as simple as:

git clone https://github.com/Esri/esri-leaflet
cd esri-leaflet
git submodule init
git submodule update

Request for FeatureLayer and ClusteredFeatureLayer xxx.on("loaded"...)

There's no "easy" way to know when a FeatureLayer or ClusteredFeatureLayer is loaded so you can get at its properties. This is handy when you want to zoom to add a layer and zoom to it immediately afterward. Also handy for showing load progress.

A simple callback would be nice. e.g.

fl = createLayer();

fl.on("loaded", function(e) {
stopProgress();
map.setView(e.layer.getBounds());
});

Fill out test suite

Most of the classes have very little testing. This issue is a reminder that we need solid coverage and testing going forward before a final release.

Feature Service demos are broken

Recommend Projects

  • React photo React

    A declarative, efficient, and flexible JavaScript library for building user interfaces.

  • Vue.js photo Vue.js

    🖖 Vue.js is a progressive, incrementally-adoptable JavaScript framework for building UI on the web.

  • Typescript photo Typescript

    TypeScript is a superset of JavaScript that compiles to clean JavaScript output.

  • TensorFlow photo TensorFlow

    An Open Source Machine Learning Framework for Everyone

  • Django photo Django

    The Web framework for perfectionists with deadlines.

  • D3 photo D3

    Bring data to life with SVG, Canvas and HTML. 📊📈🎉

Recommend Topics

  • javascript

    JavaScript (JS) is a lightweight interpreted programming language with first-class functions.

  • web

    Some thing interesting about web. New door for the world.

  • server

    A server is a program made to process requests and deliver data to clients.

  • Machine learning

    Machine learning is a way of modeling and interpreting data that allows a piece of software to respond intelligently.

  • Game

    Some thing interesting about game, make everyone happy.

Recommend Org

  • Facebook photo Facebook

    We are working to build community through open source technology. NB: members must have two-factor auth.

  • Microsoft photo Microsoft

    Open source projects and samples from Microsoft.

  • Google photo Google

    Google ❤️ Open Source for everyone.

  • D3 photo D3

    Data-Driven Documents codes.