Coder Social home page Coder Social logo

esri / arcade-expressions Goto Github PK

View Code? Open in Web Editor NEW
266.0 55.0 93.0 21.79 MB

ArcGIS Arcade expression templates for all supported profiles in the ArcGIS platform.

License: Apache License 2.0

Python 4.83% JavaScript 95.17%
javascript arcade arcgis hacktoberfest

arcade-expressions's Introduction

ArcGIS Arcade expressions

This repository is intended for sharing and maintaining reuseable Arcade expressions across all supported profiles.

General workflow

These expressions are organized based on their intended execution profile. The following folders correspond with each profile:

Click on the desired profile name to view relevant expressions.

Note that expressions living in one folder don't have to be exclusively used in the associated profile. They can likely be used in different profiles, though they were designed for the profile indicated by the folder name.

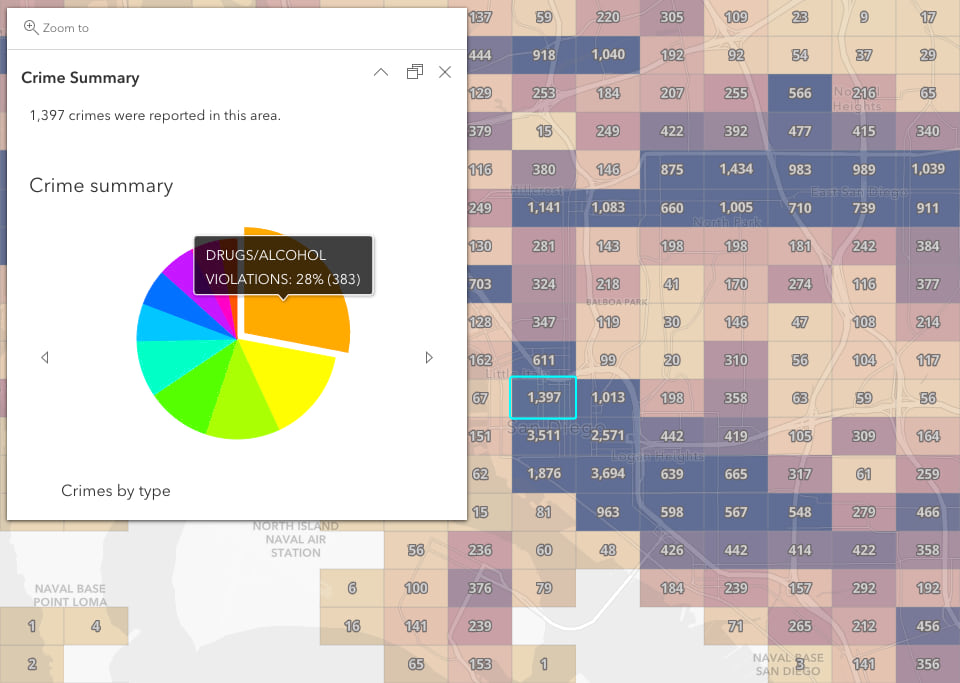
Each expression lives in a Markdown file, which contains a general description of the expression, its use case, a depiction of the result, the code to copy, and an example of an executable form of the expression along with its output. It may also include a link to a web map demonstrating the expression in action.

Resources

Contributing

Esri welcomes contributions from anyone and everyone. Please see our guidelines for contributing.

License

Copyright 2018 Esri

Licensed under the Apache License, Version 2.0 (the "License"); you may not use this file except in compliance with the License. You may obtain a copy of the License at

http://www.apache.org/licenses/LICENSE-2.0

Unless required by applicable law or agreed to in writing, software distributed under the License is distributed on an "AS IS" BASIS, WITHOUT WARRANTIES OR CONDITIONS OF ANY KIND, either express or implied. See the License for the specific language governing permissions and limitations under the License.

A copy of the license is available in the repository's LICENSE file.

arcade-expressions's People

Contributors

apulverizer avatar barkerpc avatar bsvensson avatar chris-fox avatar codebarker avatar doug-m avatar ekenes avatar gregbunce avatar hhkaos avatar jdcarls2 avatar jenbell27 avatar johnalsup avatar lcoleman-99 avatar maptastik avatar mikemillergis avatar mkellyesri avatar rebeccaleh avatar rlesperance avatar sagewall avatar shawnmgoulet avatar shoe913 avatar steveoh avatar ted-howard avatar tedrick avatar vwakem avatar

Stargazers

 avatar  avatar  avatar  avatar  avatar  avatar  avatar  avatar  avatar  avatar  avatar  avatar  avatar  avatar  avatar  avatar  avatar  avatar  avatar  avatar  avatar  avatar  avatar  avatar  avatar  avatar  avatar  avatar  avatar  avatar  avatar  avatar  avatar  avatar  avatar  avatar  avatar  avatar  avatar  avatar  avatar  avatar  avatar  avatar  avatar  avatar  avatar  avatar  avatar  avatar  avatar  avatar  avatar  avatar  avatar  avatar  avatar  avatar  avatar  avatar  avatar  avatar  avatar  avatar  avatar  avatar  avatar  avatar  avatar  avatar  avatar  avatar  avatar  avatar  avatar  avatar  avatar  avatar  avatar  avatar  avatar  avatar  avatar  avatar  avatar  avatar  avatar  avatar  avatar  avatar  avatar  avatar  avatar  avatar  avatar  avatar  avatar  avatar  avatar  avatar

Watchers

 avatar  avatar  avatar  avatar  avatar  avatar  avatar  avatar  avatar  avatar  avatar  avatar  avatar  avatar  avatar  avatar  avatar  avatar  avatar  avatar  avatar  avatar  avatar  avatar  avatar  avatar  avatar  avatar  avatar  avatar  avatar  avatar  avatar  avatar  avatar  avatar  avatar  avatar  avatar  avatar  avatar  avatar  avatar  avatar  avatar  avatar  avatar  avatar  avatar  avatar  avatar  avatar  avatar  avatar  avatar

arcade-expressions's Issues

SplitCategories(PieChart).md

SplitCategories(PieChart).md broke on the recent commit.

for(var i = 0; i < count_arr; i++ ){ 
        feat = {
            'attributes': {
                'split_choices': Trim(split_array[i])
            }
        Push(features, feat);
}}}

should be

for(var i = 0; i < count_arr; i++ ){ 
        feat = {
            'attributes': {
                'split_choices': Trim(split_array[i])
            }
        }
        Push(features, feat);
}}

Aggregate and calculate data statistics using spatial intersect

Check existing issues

Execution profile

Popup

Is your feature request related to a problem? Please describe.

I would like to display a dynamically calculated value (e.g. an average temperature) based on the aggregate values of several points features within a polygon feature (e.g. weather stations within a county).

Describe the solution you'd like

I expect something simple like this, where the temperature value of all weather stations within a county have been calculated on-the-fly:
Screenshot 2023-10-17 at 12 30 32

Describe alternatives you've considered

The only option that comes to my mind is to write custom code

Additional context

This was a demo shown during the last developer summit (2023), so the county layer that was used can be repurposed.

Note: I noticed there is a similar expression made for the Dashboard profile, but in this case it is used to generate a chart.

Help with making a simple pie chart?

I am trying to make a pie chart with the Dashboard app on ArcGIS online, and this is my code:

var disasters = Dictionary("thunderstorm winds", 7715, "blizzards",169, "floods", 1122, "cold", 138, "hail", 9487, "ice storm", 42, "wildfire", 7, "dense fog", 10, "heat", 18, "winter storm", 487, "drought", 53, "heavy snow", 293, "strong wind", 211, "winter weather", 73);

var disaster = FeatureSet(Text(disasters));

return disaster;

I'm not familiar with Arcade, so I do not know what I'm doing wrong. Can someone help?

Arcade Popup on AGOL Layer - Comma Expected

Hi there, when I test this code on the ArcGIS Online Attribute Expression editor it says brings up this error on the last line: ',' expected. This is what the error looks like in the code editor:

arcade_code_error_1

When I add a comma, it says "Unexpected end of script."

The exact same code works as intended when I use it to calculate a field in ArcGIS Pro. Not sure what I'm missing here. Thoughts?

var AL = $feature.AlligatorLight;
var AM = $feature.AlligatorMod;
var AS = $feature.AlligatorSev;
var transverse = $feature.Transverse;
var block = $feature.Block;
var oxidation = $feature.Oxidation;
var patching = $feature.Patching;

MAX(1,(100
- (AL*0.1*25)
- (AM*0.1*60)
- (AS*0.1*99)
- Decode(transverse, 'No', 0, 'Yes', 5, 0)
- Decode(block, 'None', 0, 'Light', 5, 'Moderate', 20, 'Severe', 35, 0)
- Decode(oxidation, 'None', 0, 'Severe', 10, 0)
- Decode(patching, 'None', 0, 'Light', 5, 'Moderate', 10, 'Severe', 15, 0))

Documentation Request for Global $datastore

I'm in the process of making attribute rules on my enterprise geodatabase and wanted to know more about utilizing $datastore for filling in data derived from other feature classes. Based on previous experience using Arcade for field calculations, I understand that the $datastore global only accesses feature classes within the container of the current feature. Is this a correct understanding?

I have not seen this information explicitly spelled out; and am unsure what the behavior would be between feature datasets as well. These are the only links that I've seen with definitions for the $datastore.

https://developers.arcgis.com/arcade/guide/types/#featuresetcollection
https://developers.arcgis.com/arcade/guide/release-notes/#featureset-support-in-popups-and-attribute-rules

Are there other resources for understanding the behavior of $datastore better, if it does not exist currently, can the Dev Team enhance its documentation?

Re-write sample expressions to use Push?

Hello!

I noticed that as of v 1.12, the addition of the Push function can make certain example expressions considerably simpler when an array is being populated with values. Rather than something like:

var someArray = [];
var arrayIndex = 0;

for ( var f in fs ) {
    someArray[arrayIndex] = 'some value';
    arrayIndex += 1
};

return someArray

We could instead write such expressions as:

var someArray = [];

for ( var f in fs ) {
    Push(someArray, 'some value');
}

I'd be happy to make such changes myself and submit a PR, but wondered if such a thing would be wanted.

Constrain to Domain Code attribute rule not working

Hello,

I'm having trouble using the Constrain to Domain Code arcade expression as an attribute rule in ArcGIS Pro v2.8. I have copied the template expression and replaced var field with the field name in my table. Here are my attribute rule properties:

image

I have found that with the constraint attribute rule enabled, I am still able to field calculate values that are outside of the domain associated with the field that I am trying to protect. I have also tested with the 'Insert' trigger enabled. When copying/pasting a feature that already contains an invalid value, however, the new feature is created successfully. Any advice is greatly appreciated!

Thanks,
Derrick

new to arcade-need guidance

I don't even know if this is the place to reach out for help. But I am desperate

Am I able to use attribute rules and arcade expressions to populate one field when another field is populated, in the same feature.

and they have domains on them, and the feature will be shared as a service definition, and then published to online eventually.

any help is appreciated. Having a hard time navigating all this arcade lingo

Review "See the list below for shared expressions" (Markdown files)

We just noticed that several README.md files do not have all expressions listed under "See the list below for shared expressions." (some do not even have that statement). Examples:

It would be great is someone could review and make sure all of them have a list of the provided expressions for easier navigation and discovery.

Contribute to this folder

Hello,
I write an Arcade script for dashboard that could interest other, how can I share my script here ?
Frank

Localize popups based on the user profile

Check existing issues

Execution profile

Popup

Is your feature request related to a problem? Please describe.

When I try to localize a web map/scene, I end up having multiple instances of the exact same web map/scene with the only difference of localized popups (text and unit measures: Fahrenheit vs Celsius, meters vs miles, ...). And this is challenging to maintain. We could use Arcade expressions to localize these popups.

Describe the solution you'd like

I would my app to be able to :

Untitled drawing (16)

Describe alternatives you've considered

  • Use Arcade expressions to query the default language of the logged-in user using GetUser().units and set everything accordingly
  • Replicate the same instance of a web map and customize each per language
  • Build a custom app writing custom code and use something like intl.setLocale() or use an external tool like i18next

Additional context

This was presented in a demo during DevSummit 2023. The web map can be found here

Symbology in ArcGISPRO with Arcade

Hello,
Is it possible to add condition regarding color and thickness for line feature:

else if (y == "Secondary" && x < 2 && x > 0.8) {
return "Medium Fault";
return rgb(0, 7, 186);

regards,

Anzhelika

Fade symbols using TimeStamp, in relation to Map Time

Not having much luck over on GeoNet, so figured this repo contributors could point me in the right direction.

  • I have a point dataset with a single datetime field;
  • I have enabled Time using this field;
  • I have a time window of 1 day;
  • The temporal extent of the dataset is one month

I want to come up with a renderer, that shows points that are at the front of the time window to be entirely solid. But at the back of the time window, I want them to be pretty much transparent. So a linear stretch of opacity for the time window. Easier to take look at this example:

image

However, the above sample is web, and I believe was achieved using some JS over Arcade

My question is how to best achieve this within ArcGIS Pro with Arcade?

I am struggling to see how I can leverage the current time of the slider to drive my symbology. Can anyone point me to some similar snippets that might help me achieve this? Is it possible?

Semi related for others that might discover this issue:
Unwinding the Clock
Create a Time Variable for Time Enabled Data - this suggests that I might not be alone.

Add contributing guidelines

After checking more carefully the repo, I have noticed given the lack of conventions, there is considerable heterogeneity in the repo. To help keeping the repo in a good shape, I think we should add a specific CONTRIBUTING.md file for this repo (I volunteer to do it).

I would like to include things like:

  • I want to contribute, what should I work on?
  • Before filling and issue
  • Getting a development environment set up
  • Adding a new expression
  • Commit message format
  • Pull requests

So, I'm happy to prepare one, but I would like to get your thoughts @ekenes, @MikeMillerGIS, @VwakeM,ย @ted-howard, @jdcarls2, about some conventions I think we should define, specially about Adding a new expression.

My questions for you are:

  1. Should we specify a convention for file & folder names capitalization? (camelCase vs snake_case vs PascalCase vs or kebab-case) <- Any preference?
    1.1. Should README.md always capitalized? (example)
    1.2. Is it OK to use special characters like "(", ")", ... (example)
  2. If an expression is too long, is it recommended keeping it in a *.js file instead of the markdown file? (example)
  3. Should we add images and sample data within folders? (e.g. images/ & sample-data/). I have seen some folders like attribute_rule_calculation with ton of files.
  4. I sometimes see we have folders grouping expressions (example). Should they have their own README.md and list the expressions there instead of in the parent README file? (Barcode example)
  5. Should we request a local copy of the data as a static file? https://gdb.zip/
    5.1. If so, should we use specific extensions? (e.g. gdb.zip vs zip vs ...; stylx)
  6. Do we need to add. Contributing and License to all README.md files?

My proposal:

  1. I would vote for kebab-case
    1.1. Yes, I would recommend README.md (capitals)
    1.2. I would say avoid \/:*?"<>|
  2. I'm not against that, but if so, I would place it in a expressions folder with the same name as the markdown file
  3. I would say yes, use folders.
  4. I would say yes. Add a single link in the parent README.md to the child README.md and list the expressions there
  5. I would say it is recommended whenever possible, and set [extension].zip meaning ____.gdb.zip, ____.stylx.zip, ...
  6. I would say no.

Thanks in advance! ๐Ÿ˜Š

P.S. sorry if I added or missed someone here, please let me know if that's the case.

Build charts based on statistics grouped by distinct values from a single field

Check existing issues

Execution profile

Popup

Is your feature request related to a problem? Please describe.

I need a dynamic way to render charts based on summary statistics for categories from a single field (because the underlying data in changing constantly).

An image chart is worth a thousand words.

Describe the solution you'd like

I want to be able to generate charts like this based on a point layer:

Pie chart - Based on category (e.g. crime type):
Binning Pie chart โ€“ the total number of crimes for each type.


Line chart - Based on time field (e.g. crime date):
Line chart โ€“ the total number of crimes that occurred in each month of the year

Describe alternatives you've considered

Precalculate fields using Aggregate fields tool, ArcGIS Pro, etc. (but it doesn't work when my data is static), or building custom code on each app

Additional context

This article and this webmap provide examples on how to do that.

๐ŸŽƒ ๐—›๐—ฎ๐—ฐ๐—ธ๐˜๐—ผ๐—ฏ๐—ฒ๐—ฟ๐—ณ๐—ฒ๐˜€๐˜ ๐——๐—ฒ๐˜๐—ฎ๐—ถ๐—น๐˜€ ๐—ณ๐—ผ๐—ฟ ๐—ฃ๐—ฎ๐—ฟ๐˜๐—ถ๐—ฐ๐—ถ๐—ฝ๐—ฎ๐—ป๐˜๐˜€ ๐Ÿ‘จโ€๐Ÿ’ป

Greetings and happy Hacktoberfest 2023!

We're thrilled that you've chosen to participate in Hacktoberfest with us! Please bear in mind that during the month of October ๐ŸŽƒ, the volume of pull requests (PRs), comments, and other interactions may be higher than usual. Therefore, we kindly ask for your patience while awaiting responses. To increase the likelihood of a successful PR, please adhere to the following guidelines:

  • Familiarize yourself with the repository by reading the README.md.
  • Review and follow all the guidelines outlined in CONTRIBUTING.md.
  • When you receive feedback on your PR, incorporate the changes into the same PR rather than creating a new one.
  • Ensure your PR has a descriptive title, as this will facilitate a smoother review process.

If you haven't already, please check out our blog article ๐Ÿ“ƒ, which contains valuable information, including a list of participating Hacktoberfest repositories and details about our contest ๐Ÿ† and rules. Additionally, consider joining our Slack channel to join in the fun, receive announcements, interact with maintainers, Esri employees, and fellow participants, and have a place to ask any questions you may have.

Mappy Hacking! ๐Ÿ—บ ๐Ÿ‘ฉโ€๐Ÿ’ป

QR codes generated on-the-fly in popups

Check existing issues

Execution profile

Popup

Is your feature request related to a problem? Please describe.

I would like to generate a QR code on-the-fly to allow users of my app to easily switch context from a desktop environment to a mobile one, for example to:

  • Collect data from the device sensors (camera, GPS coordinates, etc.)
  • Share information with contacts in their phone (through WhatsApp or any other social app)
  • Or to start a navigation app

Describe the solution you'd like

I would like to be able to add a QR code in the popup link any of this things:

Example of QR code to be embedded in the popup to get directions to the Esri Campus in Redlands: https://chart.googleapis.com/chart?cht=qr&chs=250x250&chl=https%3A%2F%2Fwww.google.com%2Fmaps%2Fdir%2F%3Fapi%3D1%26destination%3D34.05725151285307%2C-117.19491463090748
Get directions to Esri Campus

Describe alternatives you've considered

I have considered to display URLs, with URL shorteners, but it's more complicated. For Survey123 to find a programmatic way to extract the generated QR code.

Additional context

I have found a script that uses Google Charts API to do that.

P.S: There are other free services to generate bar codes (might be worth to include as a related resource)

GroupBy Expression doesn't return statistics against non-hosted feature layer

Hi arcade team,

Not sure if you are open to issues being reported here but trying out the group by example (ultimately I want to use this for a join), I can't view the results when querying a non-hosted feature layer, that is one in a Postgres enterprise geodatabase. The same expression against a hosted layer works fine.

I looked into the responses from the feature services and they are almost identical, but the hosted service returns a few more properties in the json response;

  • exceededTransferLimit,
  • globalIdFieldName,
  • objectIdFieldName.

Is there a limitation on using these arcade data expressions against non-hosted layers? Or is there a workaround/function I can enable on my services to support them?

The expression based on the example;

var portal = Portal('portalurl.org');
var fs = FeatureSetByPortalItem(
    portal,
    'b10d264xxxxxxxxxxxxx',
    1,
    [
        'parentrowid',
        'eo_quantity',
    ],
    false
);

return GroupBy(fs, ['parentrowid'], 
[{name: 'total_devices', expression: 'eo_quantity', statistic: 'SUM' }]); 

The response from the non-hosted feature layer;

{"displayFieldName":"","fieldAliases":{"parentrowid":"parentrowid","t3":"t3","t4":"t4"},"fields":[{"name":"parentrowid","type":"esriFieldTypeString","alias":"parentrowid","length":38},{"name":"t3","type":"esriFieldTypeDouble","alias":"t3"},{"name":"t4","type":"esriFieldTypeInteger","alias":"t4"}],
"features":[
{"attributes":{"parentrowid":"{13F35FA8-0735-4A12-A44D-FA9C7F7337F2}","t3":1,"t4":12046}},
{"attributes":{"parentrowid":"{18DED65D-A9E2-4628-8DCE-F75C565E4337}","t3":5,"t4":11646}
}] }

But this is rendered/returned to the dashboard without the statistics;

image

Date Issue

Feel free to throw me back over to GeoNet.

I have an epoch beind updated on my Hosted Feature Service.

APIdate (type: esriFieldTypeInteger, alias: API date (epoch), SQL Type: sqlTypeOther...

If I apply a simple expression:

Date($feature.APIdate)

It returns the wrong year entirely.

image

However, if I check this epoch in an online tool, it converts correctly:

image

Im sure this is an easy one - what am I missing in my expression?

What I really want to achieve, is how many minutes since last update.

Something like this?
DateDiff((Date($feature.APIdate)), Now(), minutes)

Create a rich table with data extracted from other layers

Check existing issues

Execution profile

Popup

Is your feature request related to a problem? Please describe.

To add additional context to my map, I would like to have an expression to easily extract data from a layer (e.g. Living Atlas layers) an create a nice UI to provide additional context when the popup of a feature is displayed.

Describe the solution you'd like

I would like to build something like this (more info in the additional context):
MicrosoftTeams-image (65)

Describe alternatives you've considered

  • Use Arcade with geometry functions
  • Enrich my layer could be an option, specially when the talking about layers that consume credits.
  • Write app with custom code

Additional context

I would recommend using Living Atlas layers as sample data.

The screenshot is from a demo and the web map is also available.

Aggregate data table statistics using feature reduction

Check existing issues

Execution profile

Popup

Is your feature request related to a problem? Please describe.

Been able to use binning and clustering in a web map is great, but just showing predominant values might be misleading sometimes, as explained in this demo.

Describe the solution you'd like

Been able to visualize a table with aggregated statistics is a great way to include additional information:
Crime summary table statistics

Describe alternatives you've considered

Build a custom code in each application/language that uses the web map.

Additional context

This article and this web map contains an example that can be repurposed.

Issue with AddressManagement / Split Intersecting Road.js in ArcGIS Pro v2.9

Hello,

My department recently upgraded to Pro v2.9 to take advantage of some new functionality. We discovered, however, that upgrading seemed to cause the Split Intersecting Road.js attribute rule to break. The rule was working in v2.8 but is now throwing the following error: "The evaluation of attribute rules is cyclic or exceeds maximum cascading level." Any idea what may be causing this and if there are any possible workarounds? Any help is greatly appreciated!

Thanks,
Derrick

Calculate the distance (and coordinates) to a point

Check existing issues

Execution profile

Popup

Is your feature request related to a problem? Please describe.

I would like to be able to calculate the closest distance, and coordinates from the selected point to other features (point, line or polygon) in another layer.

Describe the solution you'd like

I would like to display the distance & coordinates.

Describe alternatives you've considered

Using Arcade geometry functions like buffer, distance, the nearest coordinate and nearest vertex this is achievable.

Other options would require custom code for each application.

Additional context

This community question&answer with a solution for calculating distances between two points.

To build this I would recommend using feature layers from the Living Atlas.

If needed, documentation & a playground about geometric calculations can be found in the developer guide.

Note: I have also noticed there are related expressions within the attribute_rule_calculations

Colored box mapping a severity/risk index

Check existing issues

Execution profile

Popup

Is your feature request related to a problem? Please describe.

I would like to provide visual context using a colored box that maps a severity/risk index of my data.

Describe the solution you'd like

Based on given ranges of values, I want to be able to map these to different colors to build a popup like this:
MicrosoftTeams-image (63)

Describe alternatives you've considered

Add an extra column in my layer with static calculated fields, and write custom code in each of my apps.

Additional context

This demo and this web map provides an example

Action on Arcade expression

Hello,

I created a data expression in ArcGIS Dashboard that return a featureset with an ID and a value.

I set an action on a selector that match property with the featureset.

The problem is that my calculated value is done with data directly from ArcGIS Online and therefore not filtered by the selector.

Is someone has already managed to set an action on a data expression ?

Thank you,

Frank

Where does JS console output go?

Hello, I just started using arcade within the JS SDK, and I'm have a hard time finding the errors from my arcade code. My question is similar to this one about using arcade within ArcGIS Pro, but for JS. The code is simple, so I'm sure I'll solve it soon, but it seems strange that I haven't seen any logs of any kind in the console.

Thanks for the help.
Alex

Top5 Sample - Return on New Line not flowing through?

Looking at the top 5 sample for the purpose of a popup.

When I configure this with my own data and test the expression within the style editor, everything is looking good:

image

And I can see that the expression is honouring placing each result into a new line with TextFormatting.NewLine

However, over in the pop-up, this does not seem to be flowing through:

image

As a Web Map author, I would like the NewLine to flow through to the popup so that my end users can more easily see the results.

I can also see the same issue on the referenced Web Map example

Recommend Projects

  • React photo React

    A declarative, efficient, and flexible JavaScript library for building user interfaces.

  • Vue.js photo Vue.js

    ๐Ÿ–– Vue.js is a progressive, incrementally-adoptable JavaScript framework for building UI on the web.

  • Typescript photo Typescript

    TypeScript is a superset of JavaScript that compiles to clean JavaScript output.

  • TensorFlow photo TensorFlow

    An Open Source Machine Learning Framework for Everyone

  • Django photo Django

    The Web framework for perfectionists with deadlines.

  • D3 photo D3

    Bring data to life with SVG, Canvas and HTML. ๐Ÿ“Š๐Ÿ“ˆ๐ŸŽ‰

Recommend Topics

  • javascript

    JavaScript (JS) is a lightweight interpreted programming language with first-class functions.

  • web

    Some thing interesting about web. New door for the world.

  • server

    A server is a program made to process requests and deliver data to clients.

  • Machine learning

    Machine learning is a way of modeling and interpreting data that allows a piece of software to respond intelligently.

  • Game

    Some thing interesting about game, make everyone happy.

Recommend Org

  • Facebook photo Facebook

    We are working to build community through open source technology. NB: members must have two-factor auth.

  • Microsoft photo Microsoft

    Open source projects and samples from Microsoft.

  • Google photo Google

    Google โค๏ธ Open Source for everyone.

  • D3 photo D3

    Data-Driven Documents codes.