epacke / indeni-codequal Goto Github PK
View Code? Open in Web Editor NEWMaking the life easier for indeni developers
Making the life easier for indeni developers
![dependabot[bot] avatar](https://avatars.githubusercontent.com/in/29110?v=4 "dependabot[bot]")


array_length = split(vs_and_core, vs_id_to_core, ",")
also:
vsid_plus_core_id = vsid "," cpu_id
Not sure why it misses these lines but not others:
        split(VS, splitVSArray, ":")
        tags["vs.name"] = splitVSArray[1]
        tags["vs.ip"] = splitVSArray[2]
Here's the full script:
#! META
name: chkp-cpmiquery-gateways-cluster-members
description: Report all gateways within the MDS
type: monitoring
monitoring_interval: 5 minutes
requires:
    vendor: checkpoint
    role-management: true
    vsx: true
    mds: true
    or:
        -
            os.version: "R80.10"
        -
            os.version: "R80.20"

#! COMMENTS
known-devices:
    why: |
        To find other gateways within the MDS environment, gateways that a user might want to monitor with indeni.
    how: |
        Uses the CLI commands and a database query to enumerate all of the gateways in an MDS environment.
    without-indeni: |
        An admin would need to log into the MDS and manually run the commands to discover the gateways.
    can-with-snmp: false
    can-with-syslog: false


#STEP 1 -- Collect CMA info

#! REMOTE::SSH
COLUMNS=150 && export COLUMNS && mdsstat |grep CMA | awk '{gsub(/\|/,"",$3); print "CMA: "$3" "$5}'

#! PARSER::AWK

######### OUTPUT #################
#
# CMA: Domain_03_MGMT01 10.0.2.12
# CMA: Domain_05_MGMT01 10.0.2.10
#
##################################

/^CMA/{
    step1 = $2":"$3
    writeDynamicVariable("vsInfo", step1)
}


#STEP 2 -- Collect GW info

#! REMOTE::SSH
vsName=$(awk -v var="${vsInfo}" 'BEGIN { split(var,splitArr,":"); print splitArr[1]}') && vsIP=$(awk -v var="${vsInfo}" 'BEGIN { split(var,splitArr,":"); print splitArr[2]}'); mdsenv $vsName; cpmiquerybin attr "" network_objects " (type='cluster_member' & vsx_cluster_member='true' & vs_cluster_member='true') | (type='cluster_member' & (! vs_cluster_member='true')) | (vsx_netobj='true') | (type='gateway'&cp_products_installed='true' & (! vs_netobj='true') & location='internal')" -a __name__,ipaddr | xargs -r -n 2 echo "Object: "$vsName" "$vsIP

#! PARSER::AWK

#############################################################################
#                            SSH OUTPUT                                     #
#############################################################################
# Object: Domain_02_MGMT01 10.0.2.13 GW11 10.0.2.34                         #
# Object: Domain_02_MGMT01 10.0.2.13 GW12 10.0.2.33                         #
# Object: Domain_01_MGMT01 10.0.2.14 GW10 10.0.2.35                         #
#############################################################################
#
# Step1: Array [vsName:vsIP] = GWxName:GWxIP;GWyName:GWyIP ....
# Step2: tags = [vsName , vsIP]  and known_devices: array of GWs
#
##############################################################################

BEGIN {
    id = 0
}

/Object:/ {
    domain = $2 ":" $3
    if (infoArray [domain] == "")
        infoArray [domain] = $5 ":" $4
    else
        infoArray [domain] = infoArray [domain] ";" $5 ":" $4
}

END {
    for ( VS in infoArray) {
        if (match(infoArray[VS], ";")==-1) {
            splitDataArray[1] = infoArray[VS]
        }
        else {
            split(infoArray[VS], splitDataArray, ";")
        }
        split(VS, splitVSArray, ":")
        tags["vs.name"] = splitVSArray[1]
        tags["vs.ip"] = splitVSArray[2]
        id = 0
        for (device in splitDataArray) {
            id++
            split(splitDataArray[device], splitDevice, ":")
            known_devices[id, "name"] = splitDevice[2]
            known_devices[id, "ip"] = splitDevice[1]
        }
        writeComplexMetricObjectArray("known-devices", tags, known_devices)
        delete known_devices
    }
}
    for ( VS in infoArray) {
        if (match(infoArray[VS], ";")==-1) {
            splitDataArray[1] = infoArray[VS]
        }
Index = hostname ";" vsName
Right now, the columnVariableManipulation test only works for assignment via gsub; e.g.,
gsub(/foo/, "bar", $1)
But, this is only one of the ways to set positional variables. Directly setting is another obvious on we should catch. If we can think up some others while fixing this one, even better.
Autoscroll to display issue when clicking on an "issue button"
This one's gonna be a pain in the but to fix:
gsub(/,O/, "", CN)
i.e., how to exclude the "/,O/" from the search, but still get commas between params?
CodeQual currently doesn't check for comments in the #! REMOTE::SSH section, which are (currently) illegal and cause all kinds of problems. Add a new validation check for these. Should probably be "error". Sample script attached.
comments_in_remote.ind.txt
I haven't really thought about the feasibility of this, only that it would be a nice check to have: flag any variable that gets defined but never used. In the attached, the "status" variable is never used.
NO:
#! META
name: unix-df_i
YES:
#! META
name: unix-df-i
Be sure to add unit tests
See code below.
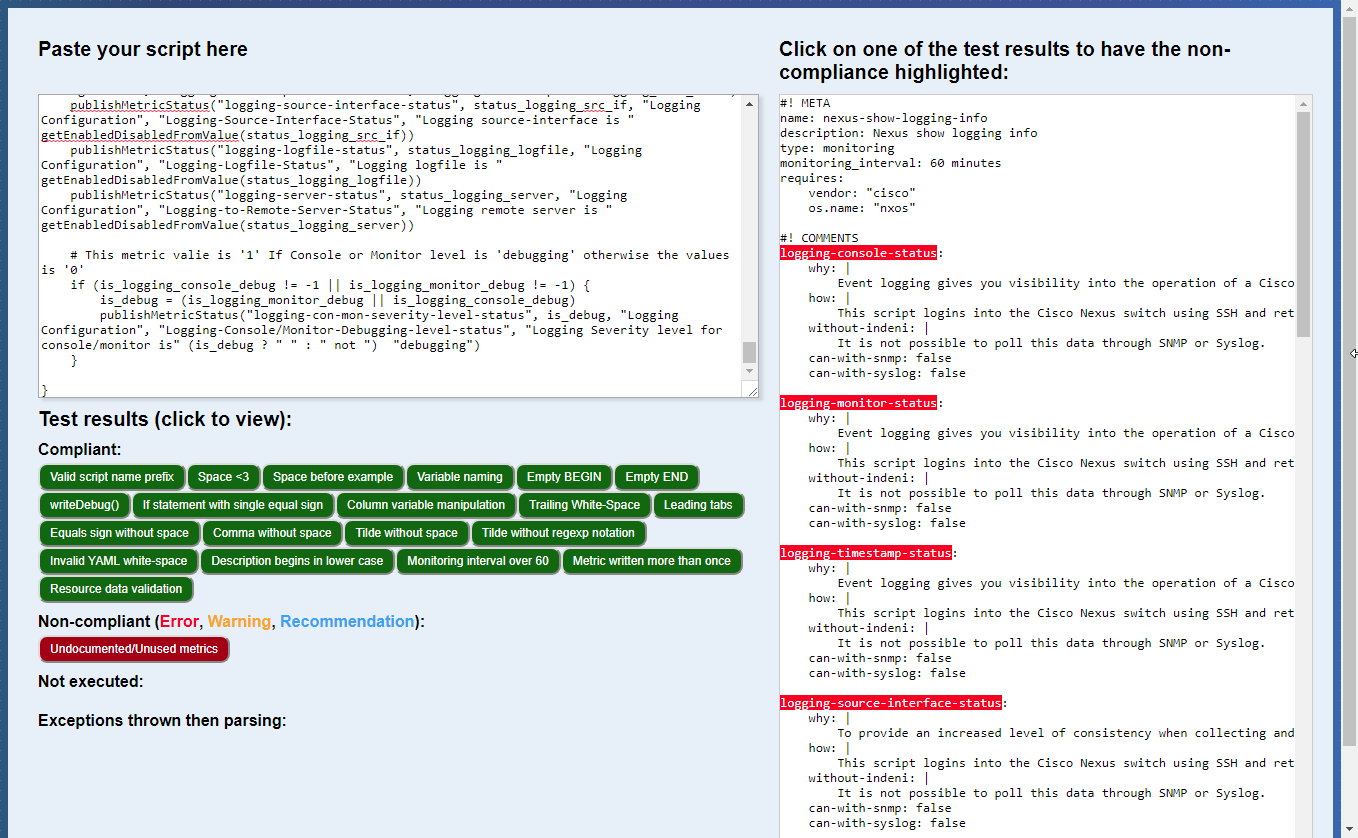
#! META
name: nexus-show-logging-info
description: Nexus show logging info
type: monitoring
monitoring_interval: 60 minutes
requires:
    vendor: "cisco"
    os.name: "nxos"

#! COMMENTS
logging-console-status:
    why: |
        Event logging gives you visibility into the operation of a Cisco NX-OS device and the network in which it is deployed. Cisco NX-OS provides several flexible logging options that can help achieve the network management and visibility goals of an organization. With Cisco NX-OS, it is possible to send log messages to monitor sessions, or to the console. However, doing so can elevate the CPU load of a Cisco NX-OS device, and therefore is not recommended. Furthermore, you are advised to send logging information to the local log buffer or the local log file, which can be viewed using the show logging command.
    how: |
        This script logins into the Cisco Nexus switch using SSH and retrieves the output of the "show logging info | i ogging" command. The output of this command shows the logging configuration/features status.
    without-indeni: |
        It is not possible to poll this data through SNMP or Syslog.
    can-with-snmp: false
    can-with-syslog: false

logging-monitor-status:
    why: |
        Event logging gives you visibility into the operation of a Cisco NX-OS device and the network in which it is deployed. Cisco NX-OS provides several flexible logging options that can help achieve the network management and visibility goals of an organization. With Cisco NX-OS, it is possible to send log messages to monitor sessions, or to the console. However, doing so can elevate the CPU load of a Cisco NX-OS device, and therefore is not recommended. Furthermore, you are advised to send logging information to the local log buffer or the local log file, which can be viewed using the show logging command.
    how: |
        This script logins into the Cisco Nexus switch using SSH and retrieves the output of the "show logging info | i ogging" command. The output of this command shows the logging configuration/features status.
    without-indeni: |
        It is not possible to poll this data through SNMP or Syslog.
    can-with-snmp: false
    can-with-syslog: false

logging-timestamp-status:
    why: |
        Event logging gives you visibility into the operation of a Cisco NX-OS device and the network in which it is deployed. The configuration of logging time stamps helps to correlate events across network devices. It is important to implement a correct and consistent logging time-stamp configuration to help ensure that you can correlate logging data. Logging time stamps should be configured to include millisecond precision
    how: |
        This script logins into the Cisco Nexus switch using SSH and retrieves the output of the "show logging info | i ogging" command. The output of this command shows the logging configuration/features status.
    without-indeni: |
        It is not possible to poll this data through SNMP or Syslog.
    can-with-snmp: false
    can-with-syslog: false

logging-source-interface-status:
    why: |
        To provide an increased level of consistency when collecting and reviewing log messages, you should statically configure a logging source interface. Accomplished through the logging source-interface interface command, statically configuring a logging source interface helps ensure that the same IP address appears in all logging messages that are sent from an individual Cisco NX-OS device
    how: |
        This script logins into the Cisco Nexus switch using SSH and retrieves the output of the "show logging info | i ogging" command. The output of this command shows the logging configuration/features status.
    without-indeni: |
        It is not possible to poll this data through SNMP or Syslog.
    can-with-snmp: false
    can-with-syslog: false

logging-logfile-status:
    why: |
        Cisco NX-OS software supports the use of a local log buffer in the form of a log file so that an administrator can view locally generated log messages. The use of buffered logging to the log file is highly recommended instead of logging to either the console or monitor sessions.
    how: |
        This script logins into the Cisco Nexus switch using SSH and retrieves the output of the "show logging info | i ogging" command. The output of this command shows the logging configuration/features status.
    without-indeni: |
        It is not possible to poll this data through SNMP or Syslog.
    can-with-snmp: false
    can-with-syslog: false

logging-server-status:
    why: |
        You should send logging information to a remote syslog server. By doing so, you can correlate and audit network and security events across network devices more effectively. Note that syslog messages are transmitted unreliably by UDP and in cleartext. For this reason, any protections that a network offers to management traffic (for example, encryption and out-of-band access) should be extended to include syslog traffic.
    how: |
        This script logins into the Cisco Nexus switch using SSH and retrieves the output of the "show logging info | i ogging" command. The output of this command shows the logging configuration/features status.
    without-indeni: |
        It is not possible to poll this data through SNMP or Syslog.
    can-with-snmp: false
    can-with-syslog: false

logging-con-mon-severity-level-status:
    why: |
        Each internal system software component of Cisco NX-OS that is capable of logging using the syslog facility can be assigned one of eight severity levels that range from level 0, Emergencies, through level 7, Debug. The severity level chosen will determine the level, granularity, and frequency of messages generated for that component. Unless specifically required, you are advised to avoid logging at level 7. Logging at level 7 produces an elevated CPU load on the device that can lead to device and network instability.
    how: |
        This script logins into the Cisco Nexus switch using SSH and retrieves the output of the "show logging info | i ogging" command. The output of this command shows the logging configuration/features status.
    without-indeni: |
        It is not possible to poll this data through SNMP or Syslog.
    can-with-snmp: false
    can-with-syslog: false

#! REMOTE::SSH
show logging info | i ogging

#! PARSER::AWK

# A helper function that publish a metric-double status type in live config
# Please note that the tag:
# 'name-ui' will be displayed in live-config ui
# 'name' will be displayed in the alert ui (if any)
function publishMetricStatus(name, value, ui_category, ui_title, tag_name) {
    if (value == 0 || value == 1) {
        tags["name-ui"] = ui_title
        tags["name"] = tag_name
        writeDoubleMetricWithLiveConfig(name, tags, "gauge", 300, value, ui_category, "state", "name-ui");
    }
}
# If 'value' is 1 then return 'enabled' otherwise 'disabled'
function getEnabledDisabledFromValue(value) {
    return value == 1 ? "enabled" : "disabled";
}

# Return 1 if the 'text' has the 'textToFind'
function hasText(text, textToFind) {
   index_match = match(tolower(text), textToFind);
   return index_match > 0
}


BEGIN {
    status_logging_console = -1;
    status_logging_monitor = -1;
    status_logging_timestamp_in_secs = -1;
    status_logging_src_if = -1;
    status_logging_logfile = -1;
    status_logging_server = -1;

    status_logging_co_mon = -1;
    is_logging_monitor_console = -1
    is_logging_monitor_debug = -1

    logging_time_units = "";
}

#Logging console:                enabled (Severity: critical)
/Logging console:/{
    status_logging_console = hasText($0, "enabled");
    is_logging_console_debug = hasText($0, "debugging");
}

#Logging monitor:                enabled (Severity: debugging)
/Logging monitor:/{
    status_logging_monitor = hasText($0, "enabled");
    is_logging_monitor_debug = hasText($0, "debugging");
}

#Logging timestamp:              MicroSeconds
/Logging timestamp:/{
    status_logging_timestamp_in_secs = hasText($0, " seconds");
    logging_time_units = $NF;
}

#Logging source-interface :      disabled
/Logging source-interface/{
    status_logging_src_if = hasText($0, "enabled");
}

#Logging server:                 disabled
/Logging server:/{
    status_logging_server = hasText($0, "enabled");
}

#Logging logfile:                enabled
/Logging logfile:/{
    status_logging_logfile = hasText($0, "enabled");
}


END {

    # Publish metrics only if we have a valid value ( value != -1 )
    publishMetricStatus("logging-console-status", status_logging_console, "Logging Configuration", "Logging-Console-Status", "Logging console is " getEnabledDisabledFromValue(status_logging_console))
    publishMetricStatus("logging-monitor-status", status_logging_monitor, "Logging Configuration", "Logging-Monitor-Status", "Logging monitor is " getEnabledDisabledFromValue(status_logging_monitor))
    publishMetricStatus("logging-timestamp-status", status_logging_timestamp_in_secs, "Logging Configuration", "Logging-Timestamp-seconds-Status", "Logging timestamp is " logging_time_units)
    publishMetricStatus("logging-source-interface-status", status_logging_src_if, "Logging Configuration", "Logging-Source-Interface-Status", "Logging source-interface is " getEnabledDisabledFromValue(status_logging_src_if))
    publishMetricStatus("logging-logfile-status", status_logging_logfile, "Logging Configuration", "Logging-Logfile-Status", "Logging logfile is " getEnabledDisabledFromValue(status_logging_logfile))
    publishMetricStatus("logging-server-status", status_logging_server, "Logging Configuration", "Logging-to-Remote-Server-Status", "Logging remote server is " getEnabledDisabledFromValue(status_logging_server))

    # This metric valie is '1' If Console or Monitor level is 'debugging' otherwise the values is '0'
    if (is_logging_console_debug != -1 || is_logging_monitor_debug != -1) {
        is_debug = (is_logging_monitor_debug || is_logging_console_debug)
        publishMetricStatus("logging-con-mon-severity-level-status", is_debug, "Logging Configuration", "Logging-Console/Monitor-Debugging-level-status", "Logging Severity level for console/monitor is" (is_debug ? " " : " not ")  "debugging")
    }

}
How are we missing this?? See example and attached complete file.
BEGIN{
    ip_index=0
    object_ip_index=0
    object_name_index=0
    local_ip_list[1] = ""
    cluster_memebers_ips[1] = ""
    cluster_memebers_name[1] = ""
    is_local[1] = 0
}
Allowed items: 71, 81, 91 etc
copy paste into the code quality app:
This message is weird because the documentation section has only one entry for the metric -- the problem is that the metric is never used.

This message is weird because the metric has been documented in the comments section.

Not exactly sure what to do here, but this doesn't look right to me.
statusMessage = substr($0, index($0, $16))
This is fine -- not actually setting any of the positional variables. Make an exception for this.
We want some kind of 'build version' to increment when we do a deployment so that we can quickly confirm that the deployment "worked"
Capture those old tests (0,1,2,3).
This one's just bizarre:

#! META
name: chkp-gaia-routes-vsx
description: Report configured static and direct routes, and compare configured static routes with Linux routes.
type: monitoring
monitoring_interval: 10 minutes
requires:
    vendor: "checkpoint"
    os.name: "gaia"
    vsx: "true"
    role-firewall: "true"
    asg:
        neq: "true"

#! COMMENTS
static-routing-table:
    why: |
        It is important that the routing is configured the same for all cluster members of the same cluster. Otherwise there can be downtime in the event of a failover.
    how: |
        By parsing the gaia configuration database, /config/active, the static routes are retrieved. It can also be retrieved via Clish, but that creates a lot of log entries in /var/log/messages.
    without-indeni: |
        An administrator could login and manually run the command.
    can-with-snmp: true
    can-with-syslog: false
    vendor-provided-management: |
        Listing static routes is only available from the command line interface or via SNMP. In VSX it is also visible in SmartDashboard.

connected-networks-table:
    why: |
        It is important that the connected interfaces is configured the same, for all cluster members of the same cluster. Otherwise there can be downtime in the event of a failure.
    how: |
        By parsing the gaia configuration database, /config/active, the routes for directly connected interfaces are retrieved. It can also be retrieved via Clish, but that creates a lot of log entries in /var/log/messages.
    without-indeni: |
        An administrator could login and manually run the command.
    can-with-snmp: true
    can-with-syslog: false
    vendor-provided-management: |
        Listing routes for directly connected interfaces is only available from the command line interface, or SNMP.

routes-missing-kernel:
    why: |
        If a static route is configured via Clish or WebUI, sometimes the system does not write the route into the Linux kernel routing table. To make sure all routes have been written, we compare the actual kernel routes with those configured in Check Point.
    how: |
        Retrieve Linux kernel routes using the Linux "netstat" command, and then the Check Point configured routes from Gaia's /config/active file. Then compare two route sets to make sure they are the same.
    without-indeni: |
        An administrator could login and manually list routes from both commands, and then compare it. However, often there are a many routes configured; combine this with the difference in output format (for example subnet), and it can be a very cumbersome task.
    can-with-snmp: false
    can-with-syslog: false
    vendor-provided-management: |
        Listing routes from kernel is only available from the command line interface. Listing configured routes is also available from the WebUI.

#! REMOTE::SSH
${nice-path} -n 15 vsx stat -l | ${nice-path} -n 15 awk '/^VSID:/{ vsid=$NF } /^Type:/{ type = ""; for (i=2; i<=NF;i++) {type = type $i} } /^Name:/{ if (type == "VSXGateway" || type == "VirtualSystem"){ print vsid ":" $NF } }' | while read idAndName; do echo "_VSID:Name $idAndName"; IFS=':' read -ra arr <<< "$${idAndName}"; vsenv "$${arr[0]}" && ${nice-path} -n 15 netstat -rn; done; ${nice-path} -n 15 grep "route" /config/active


#! PARSER::AWK

#*** SSH Commandline Comments ***
# Here's a step-by-step explanation of the above command:
# - greps the output of 'vsx stat -l' for the 'VSID:' and 'Name:' lines. Filters on 'Type:'.
# - pipes the vsid:name, as $idAndName, into a while loop, which:
#     - echos each VS ID and Name
#     - parses the ID back out of $idAndName:
#         - splits the line on ':' into the 'arr' variable --> IFS=':' read -ra arr <<< "${idOrName}"
#         - gets the VSID # out of 'arr' as arr[0] (second index in array)
#     - sets the vsenv to the VSID and runs netstat in that context
# - greps /config/active for 'route'
#
# NOTE: even though this commandline grep's /config/active, it shouldn't be a problem for this script,
# since the last many lines of the input are already ignored by this script (i.e., not pertinent or used
# in any way).


function dumpVsRouteData() {
    if (last_instance == "default") {   # default is VSID 0
        last_instance = "0"
    }

    vs_tags["vs.id"] = last_instance
    vs_tags["vs.name"] = vsid_to_name[last_instance]

    if (arraylen(static_routes)) {
        writeComplexMetricObjectArrayWithLiveConfig("static-routing-table", vs_tags, static_routes, "Static Routing Table")
    }

    if (arraylen(direct_routes)) {
        writeComplexMetricObjectArrayWithLiveConfig("connected-networks-table", vs_tags, direct_routes, "Directly Connected Networks")
    }

    # delete arrays between "vs groups" of data
    delete static_routes
    delete direct_routes

    last_instance = current_instance  # set 'last' to the new (next) instance group
}

BEGIN {
    last_instance = ""
    ospf_enabled = 0

    net_mask_to_CIDR["0.0.0.0"] = 0
    net_mask_to_CIDR["128.0.0.0"] = 1
    net_mask_to_CIDR["192.0.0.0"] = 2
    net_mask_to_CIDR["224.0.0.0"] = 3
    net_mask_to_CIDR["240.0.0.0"] = 4
    net_mask_to_CIDR["248.0.0.0"] = 5
    net_mask_to_CIDR["252.0.0.0"] = 6
    net_mask_to_CIDR["254.0.0.0"] = 7
    net_mask_to_CIDR["255.0.0.0"] = 8
    net_mask_to_CIDR["255.128.0.0"] = 9
    net_mask_to_CIDR["255.192.0.0"] = 10
    net_mask_to_CIDR["255.224.0.0"] = 11
    net_mask_to_CIDR["255.240.0.0"] = 12
    net_mask_to_CIDR["255.248.0.0"] = 13
    net_mask_to_CIDR["255.252.0.0"] = 14
    net_mask_to_CIDR["255.254.0.0"] = 15
    net_mask_to_CIDR["255.255.0.0"] = 16
    net_mask_to_CIDR["255.255.128.0"] = 17
    net_mask_to_CIDR["255.255.192.0"] = 18
    net_mask_to_CIDR["255.255.224.0"] = 19
    net_mask_to_CIDR["255.255.240.0"] = 20
    net_mask_to_CIDR["255.255.248.0"] = 21
    net_mask_to_CIDR["255.255.252.0"] = 22
    net_mask_to_CIDR["255.255.254.0"] = 23
    net_mask_to_CIDR["255.255.255.0"] = 24
    net_mask_to_CIDR["255.255.255.128"] = 25
    net_mask_to_CIDR["255.255.255.192"] = 26
    net_mask_to_CIDR["255.255.255.224"] = 27
    net_mask_to_CIDR["255.255.255.240"] = 28
    net_mask_to_CIDR["255.255.255.248"] = 29
    net_mask_to_CIDR["255.255.255.252"] = 30
    net_mask_to_CIDR["255.255.255.254"] = 31
    net_mask_to_CIDR["255.255.255.255"] = 32
}

#_VSID:Name 0:lab-CP-VSXVSLS1
/^_VSID:Name/ {
    arr_len = split($2, id_and_name, ":")
    if (arr_len != 2) {
        # TODO: what to do?
    }
    stat_vs_id = id_and_name[1]
    vs_name = id_and_name[2]
    vsid_to_name[stat_vs_id] = vs_name
    ordered_vsid[++ordered_vsid_index] = stat_vs_id
    next
}

# netstat output: store information about routes configured in the OS.
#10.11.2.0       0.0.0.0         255.255.255.0   U         0 0          0 eth1
/^[0-9]{1,3}\.[0-9]{1,3}\.[0-9]{1,3}\.[0-9]{1,3}/ {
    destination = $1
    subnet_mask = $3
    cidr = net_mask_to_CIDR[subnet_mask]
    flags = $4
    gateway = $2

    if (destination == "0.0.0.0") {
        cidr = "0"
    }

    netstat_routes_for_compare[stat_vs_id ":" destination "/" cidr ":" gateway] = ""

    next
}

#routed:instance:7:static:network:10.20.10.0:masklen:27:gateway:address:10.10.10.6 t
#routed:instance:default:static:network:10.10.100.0:masklen:24:gateway:address:10.11.2.50 t
/routed:instance:/ {

    # This entire section is just to track the groups of VS data from /config/active

    split($1, split_line, ":")
    current_instance = split_line[3]

    # This whole "last_instance" "current_instance" dance lets us process each group of instance data (from /config/active)
    # as a group, group by group.
    if (last_instance == "") {          # only first time through
        last_instance = current_instance
    }

    # Every time we hit a 'new' current_instance (except the first one), dump all the data from the previous instance
    if (current_instance != last_instance) {
        dumpVsRouteData()
    }
}

# Store information about a route which has been configured on the device.
#routed:instance:default:static:network:10.10.100.0:masklen:24:gateway:address:10.11.2.50 t
#routed:instance:7:static:network:10.20.10.0:masklen:27:gateway:address:10.10.10.6 t
#routed:instance:7:static:network:10.10.10.0:masklen:24:gateway:lname:eth0.10 t
#routed:instance:2:static:network:192.168.194.0:masklen:24:gateway t
/routed:instance:.*:static:network:.+:masklen:[0-9]+:gateway:/ {
    split($1, split_line, ":")

    # if the second-to-last field is an IP address, it's a static route
    if (split_line[11] ~ /[0-9]{1,3}\.[0-9]{1,3}\.[0-9]{1,3}\.[0-9]{1,3}/) {
        # This is a static route
        gateway = split_line[11]   # gateway:address --> 10.10.10.6

        destination_network = split_line[6]  # destination network --> 10.20.10.0
        cidr = split_line[8]  # masklen --> 27

        config_vs_id = split_line[3]
        if (config_vs_id == "default")
            config_vs_id = 0

        # use this format to compare (below) with data collected from netstat
        static_routes_for_compare[config_vs_id ":" destination_network "/" cidr ":" gateway] = ""

        static_count++
        static_routes[static_count, "network"] = destination_network
        static_routes[static_count, "mask"] = cidr
        static_routes[static_count, "next-hop"] = gateway
    } else {
        # This is a directly connected route
        destination_network = split_line[6]
        cidr = split_line[8]

        direct_count++
        direct_routes[direct_count, "network"] = destination_network
        direct_routes[direct_count, "mask"] = cidr
    }

    next
}

# Store information about a default gateway configured in Clish.
#routed:instance:default:static:default:gateway:address:192.168.194.1 t
/routed:instance:default:static:default:gateway:address/ {
    split($1, split_line, ":")

    if (split_line[8] ~ /[0-9]{1,3}\.[0-9]{1,3}\.[0-9]{1,3}\.[0-9]{1,3}/) {
        gateway = split_line[8]

        static_routes_for_compare["0:0.0.0.0/0:" gateway] = ""

        static_count++
        static_routes[static_count, "network"] = "0.0.0.0"
        static_routes[static_count, "mask"] = "0"
        static_routes[static_count, "next-hop"] = gateway
    }

    next
}

# If the VSX is using OSPF, we will still report configured routes, but we won't look for missing routes.
#routed:instance:default:ospf2:interface:eth0:area 0.0.0.1
#routed:instance:default:ospf2:interface:eth1:area backbone
/^routed:instance:default:ospf2:interface:.*:area/ {
    ospf_enabled = 1
    next
}

END {
    # Dump the last data
    dumpVsRouteData()

    # If host uses OSPF, we're done: no route comparison with netstat
    if (ospf_enabled)
        exit

    missing_sorted[1] = ""
    missing_route_index = 0

    # For each static route configured on the device, make sure it's also in the netstat output
    for (static_route in static_routes_for_compare) {
        if (! (static_route in netstat_routes_for_compare)) {   # A missing route
            # Sort missing routes as we go so that we can write them out, per VSID, as 'missing-route' metrics below
            missing_sorted[++missing_route_index] = static_route
            for (i = missing_route_index; i > 0; i--) {
                if (static_route < missing_sorted[i]) {
                    hold = missing_sorted[i]
                    missing_sorted[i] = static_route
                    missing_sorted[i + 1] = hold
                }
            }
        }
    }


    # Dump the missing route metrics. There can be 0 -> * missing routes for each VSID.

    # get the first missing route VSID if there is one
    curr_missing_id = -1
    curr_missing_index = 1
    if (missing_sorted[curr_missing_index] != "") {  # we have at least one missing route
        arr_len = split(missing_sorted[1], missing_split, ":")
        # TODO: validate l
        curr_missing_id = missing_split[1]
    }

    # for each VSID
    for (i in ordered_vsid) {
        split("", this_vs_missing)  # This is how to initialize an empty array in AWK -- see use below
        vs_id = ordered_vsid[i]
        metric_tags["vs.name"] = "VSID: " vs_id ", VS Name: " vsid_to_name[vs_id]
        if (vs_id == curr_missing_id) {
            missing_per_vs_index = 0
            while (curr_missing_id == vs_id) {   # collect all missing routes for this VSID
                # add current missing to list
                this_vs_missing[++missing_per_vs_index, "missing-route"] = "network: " missing_split[2] " next-hop: " missing_split[3]

                # get next missing VSID
                if (++curr_missing_index in missing_sorted) {
                    arr_len = split(missing_sorted[curr_missing_index], missing_split, ":")
                    # TODO: validate l
                    curr_missing_id = missing_split[1]
                } else {
                    curr_missing_id = -1  # we walked off the end of the missing routes list -- no more of them
                }
            }
        }

        # Note: if there are no missing routes for this VSID, we write an empty array object to insure correct alert resolution.
        # See the initialization of this_vs_missing above.
        writeComplexMetricObjectArray("routes-missing-kernel", metric_tags, this_vs_missing)
        delete this_vs_missing
    }
}
step2 = $2 ":" $3 ":NotPresent:0.0.0.0"
A request to be able to obfuscate IP, domains etc.
index(string, "!~")
see attached. also, aside from finding the FP in comments, it's also flagging this, which doesn't seem right:
# Sometimes a comma follows the year
gsub(/,/, "", expire_year)   <-- flagging ",/" in the regex...
AWK uses writeDoubleMetricWithLiveConfig. Not necessary.
This is a nasty one. See screenshot and code below:

#! META
name: chkp-gaia-routes-vsx
description: Report configured static and direct routes, and compare configured static routes with Linux routes.
type: monitoring
monitoring_interval: 10 minutes
requires:
    vendor: "checkpoint"
    os.name: "gaia"
    vsx: "true"
    role-firewall: "true"
    asg:
        neq: "true"

#! COMMENTS
static-routing-table:
    why: |
        It is important that the routing is configured the same for all cluster members of the same cluster. Otherwise there can be downtime in the event of a failover.
    how: |
        By parsing the gaia configuration database, /config/active, the static routes are retrieved. It can also be retrieved via Clish, but that creates a lot of log entries in /var/log/messages.
    without-indeni: |
        An administrator could login and manually run the command.
    can-with-snmp: true
    can-with-syslog: false
    vendor-provided-management: |
        Listing static routes is only available from the command line interface or via SNMP. In VSX it is also visible in SmartDashboard.

connected-networks-table:
    why: |
        It is important that the connected interfaces is configured the same, for all cluster members of the same cluster. Otherwise there can be downtime in the event of a failure.
    how: |
        By parsing the gaia configuration database, /config/active, the routes for directly connected interfaces are retrieved. It can also be retrieved via Clish, but that creates a lot of log entries in /var/log/messages.
    without-indeni: |
        An administrator could login and manually run the command.
    can-with-snmp: true
    can-with-syslog: false
    vendor-provided-management: |
        Listing routes for directly connected interfaces is only available from the command line interface, or SNMP.

routes-missing-kernel:
    why: |
        If a static route is configured via Clish or WebUI, sometimes the system does not write the route into the Linux kernel routing table. To make sure all routes have been written, we compare the actual kernel routes with those configured in Check Point.
    how: |
        Retrieve Linux kernel routes using the Linux "netstat" command, and then the Check Point configured routes from Gaia's /config/active file. Then compare two route sets to make sure they are the same.
    without-indeni: |
        An administrator could login and manually list routes from both commands, and then compare it. However, often there are a many routes configured; combine this with the difference in output format (for example subnet), and it can be a very cumbersome task.
    can-with-snmp: false
    can-with-syslog: false
    vendor-provided-management: |
        Listing routes from kernel is only available from the command line interface. Listing configured routes is also available from the WebUI.

#! REMOTE::SSH
${nice-path} -n 15 vsx stat -l | ${nice-path} -n 15 awk '/^VSID:/{ vsid=$NF } /^Type:/{ type = ""; for (i=2; i<=NF;i++) {type = type $i} } /^Name:/{ if (type == "VSXGateway" || type == "VirtualSystem"){ print vsid ":" $NF } }' | while read idAndName; do echo "_VSID:Name $idAndName"; IFS=':' read -ra arr <<< "$${idAndName}"; vsenv "$${arr[0]}" && ${nice-path} -n 15 netstat -rn; done; ${nice-path} -n 15 grep "route" /config/active


#! PARSER::AWK

#*** SSH Commandline Comments ***
# Here's a step-by-step explanation of the above command:
# - greps the output of 'vsx stat -l' for the 'VSID:' and 'Name:' lines. Filters on 'Type:'.
# - pipes the vsid:name, as $idAndName, into a while loop, which:
#     - echos each VS ID and Name
#     - parses the ID back out of $idAndName:
#         - splits the line on ':' into the 'arr' variable --> IFS=':' read -ra arr <<< "${idOrName}"
#         - gets the VSID # out of 'arr' as arr[0] (second index in array)
#     - sets the vsenv to the VSID and runs netstat in that context
# - greps /config/active for 'route'
#
# NOTE: even though this commandline grep's /config/active, it shouldn't be a problem for this script,
# since the last many lines of the input are already ignored by this script (i.e., not pertinent or used
# in any way).


function dumpVsRouteData() {
    if (last_instance == "default") {   # default is VSID 0
        last_instance = "0"
    }

    vs_tags["vs.id"] = last_instance
    vs_tags["vs.name"] = vsid_to_name[last_instance]

    if (arraylen(static_routes)) {
        writeComplexMetricObjectArrayWithLiveConfig("static-routing-table", vs_tags, static_routes, "Static Routing Table")
    }

    if (arraylen(direct_routes)) {
        writeComplexMetricObjectArrayWithLiveConfig("connected-networks-table", vs_tags, direct_routes, "Directly Connected Networks")
    }

    # delete arrays between "vs groups" of data
    delete static_routes
    delete direct_routes

    last_instance = current_instance  # set 'last' to the new (next) instance group
}

BEGIN {
    last_instance = ""
    ospf_enabled = 0

    net_mask_to_CIDR["0.0.0.0"] = 0
    net_mask_to_CIDR["128.0.0.0"] = 1
    net_mask_to_CIDR["192.0.0.0"] = 2
    net_mask_to_CIDR["224.0.0.0"] = 3
    net_mask_to_CIDR["240.0.0.0"] = 4
    net_mask_to_CIDR["248.0.0.0"] = 5
    net_mask_to_CIDR["252.0.0.0"] = 6
    net_mask_to_CIDR["254.0.0.0"] = 7
    net_mask_to_CIDR["255.0.0.0"] = 8
    net_mask_to_CIDR["255.128.0.0"] = 9
    net_mask_to_CIDR["255.192.0.0"] = 10
    net_mask_to_CIDR["255.224.0.0"] = 11
    net_mask_to_CIDR["255.240.0.0"] = 12
    net_mask_to_CIDR["255.248.0.0"] = 13
    net_mask_to_CIDR["255.252.0.0"] = 14
    net_mask_to_CIDR["255.254.0.0"] = 15
    net_mask_to_CIDR["255.255.0.0"] = 16
    net_mask_to_CIDR["255.255.128.0"] = 17
    net_mask_to_CIDR["255.255.192.0"] = 18
    net_mask_to_CIDR["255.255.224.0"] = 19
    net_mask_to_CIDR["255.255.240.0"] = 20
    net_mask_to_CIDR["255.255.248.0"] = 21
    net_mask_to_CIDR["255.255.252.0"] = 22
    net_mask_to_CIDR["255.255.254.0"] = 23
    net_mask_to_CIDR["255.255.255.0"] = 24
    net_mask_to_CIDR["255.255.255.128"] = 25
    net_mask_to_CIDR["255.255.255.192"] = 26
    net_mask_to_CIDR["255.255.255.224"] = 27
    net_mask_to_CIDR["255.255.255.240"] = 28
    net_mask_to_CIDR["255.255.255.248"] = 29
    net_mask_to_CIDR["255.255.255.252"] = 30
    net_mask_to_CIDR["255.255.255.254"] = 31
    net_mask_to_CIDR["255.255.255.255"] = 32
}

#_VSID:Name 0:lab-CP-VSXVSLS1
/^_VSID:Name/ {
    arr_len = split($2, id_and_name, ":")
    if (arr_len != 2) {
        # TODO: what to do?
    }
    stat_vs_id = id_and_name[1]
    vs_name = id_and_name[2]
    vsid_to_name[stat_vs_id] = vs_name
    ordered_vsid[++ordered_vsid_index] = stat_vs_id
    next
}

# netstat output: store information about routes configured in the OS.
#10.11.2.0       0.0.0.0         255.255.255.0   U         0 0          0 eth1
/^[0-9]{1,3}\.[0-9]{1,3}\.[0-9]{1,3}\.[0-9]{1,3}/ {
    destination = $1
    subnet_mask = $3
    cidr = net_mask_to_CIDR[subnet_mask]
    flags = $4
    gateway = $2

    if (destination == "0.0.0.0") {
        cidr = "0"
    }

    netstat_routes_for_compare[stat_vs_id ":" destination "/" cidr ":" gateway] = ""

    next
}

#routed:instance:7:static:network:10.20.10.0:masklen:27:gateway:address:10.10.10.6 t
#routed:instance:default:static:network:10.10.100.0:masklen:24:gateway:address:10.11.2.50 t
/routed:instance:/ {

    # This entire section is just to track the groups of VS data from /config/active

    split($1, split_line, ":")
    current_instance = split_line[3]

    # This whole "last_instance" "current_instance" dance lets us process each group of instance data (from /config/active)
    # as a group, group by group.
    if (last_instance == "") {          # only first time through
        last_instance = current_instance
    }

    # Every time we hit a 'new' current_instance (except the first one), dump all the data from the previous instance
    if (current_instance != last_instance) {
        dumpVsRouteData()
    }
}

# Store information about a route which has been configured on the device.
#routed:instance:default:static:network:10.10.100.0:masklen:24:gateway:address:10.11.2.50 t
#routed:instance:7:static:network:10.20.10.0:masklen:27:gateway:address:10.10.10.6 t
#routed:instance:7:static:network:10.10.10.0:masklen:24:gateway:lname:eth0.10 t
#routed:instance:2:static:network:192.168.194.0:masklen:24:gateway t
/routed:instance:.*:static:network:.+:masklen:[0-9]+:gateway:/ {
    split($1, split_line, ":")

    # if the second-to-last field is an IP address, it's a static route
    if (split_line[11] ~ /[0-9]{1,3}\.[0-9]{1,3}\.[0-9]{1,3}\.[0-9]{1,3}/) {
        # This is a static route
        gateway = split_line[11]   # gateway:address --> 10.10.10.6

        destination_network = split_line[6]  # destination network --> 10.20.10.0
        cidr = split_line[8]  # masklen --> 27

        config_vs_id = split_line[3]
        if (config_vs_id == "default")
            config_vs_id = 0

        # use this format to compare (below) with data collected from netstat
        static_routes_for_compare[config_vs_id ":" destination_network "/" cidr ":" gateway] = ""

        static_count++
        static_routes[static_count, "network"] = destination_network
        static_routes[static_count, "mask"] = cidr
        static_routes[static_count, "next-hop"] = gateway
    } else {
        # This is a directly connected route
        destination_network = split_line[6]
        cidr = split_line[8]

        direct_count++
        direct_routes[direct_count, "network"] = destination_network
        direct_routes[direct_count, "mask"] = cidr
    }

    next
}

# Store information about a default gateway configured in Clish.
#routed:instance:default:static:default:gateway:address:192.168.194.1 t
/routed:instance:default:static:default:gateway:address/ {
    split($1, split_line, ":")

    if (split_line[8] ~ /[0-9]{1,3}\.[0-9]{1,3}\.[0-9]{1,3}\.[0-9]{1,3}/) {
        gateway = split_line[8]

        static_routes_for_compare["0:0.0.0.0/0:" gateway] = ""

        static_count++
        static_routes[static_count, "network"] = "0.0.0.0"
        static_routes[static_count, "mask"] = "0"
        static_routes[static_count, "next-hop"] = gateway
    }

    next
}

# If the VSX is using OSPF, we will still report configured routes, but we won't look for missing routes.
#routed:instance:default:ospf2:interface:eth0:area 0.0.0.1
#routed:instance:default:ospf2:interface:eth1:area backbone
/^routed:instance:default:ospf2:interface:.*:area/ {
    ospf_enabled = 1
    next
}

END {
    # Dump the last data
    dumpVsRouteData()

    # If host uses OSPF, we're done: no route comparison with netstat
    if (ospf_enabled)
        exit

    missing_sorted[1] = ""
    missing_route_index = 0

    # For each static route configured on the device, make sure it's also in the netstat output
    for (static_route in static_routes_for_compare) {
        if (! (static_route in netstat_routes_for_compare)) {   # A missing route
            # Sort missing routes as we go so that we can write them out, per VSID, as 'missing-route' metrics below
            missing_sorted[++missing_route_index] = static_route
            for (i = missing_route_index; i > 0; i--) {
                if (static_route < missing_sorted[i]) {
                    hold = missing_sorted[i]
                    missing_sorted[i] = static_route
                    missing_sorted[i + 1] = hold
                }
            }
        }
    }


    # Dump the missing route metrics. There can be 0 -> * missing routes for each VSID.

    # get the first missing route VSID if there is one
    curr_missing_id = -1
    curr_missing_index = 1
    if (missing_sorted[curr_missing_index] != "") {  # we have at least one missing route
        arr_len = split(missing_sorted[1], missing_split, ":")
        # TODO: validate l
        curr_missing_id = missing_split[1]
    }

    # for each VSID
    for (i in ordered_vsid) {
        split("", this_vs_missing)  # This is how to initialize an empty array in AWK -- see use below
        vs_id = ordered_vsid[i]
        metric_tags["vs.name"] = "VSID: " vs_id ", VS Name: " vsid_to_name[vs_id]
        if (vs_id == curr_missing_id) {
            missing_per_vs_index = 0
            while (curr_missing_id == vs_id) {   # collect all missing routes for this VSID
                # add current missing to list
                this_vs_missing[++missing_per_vs_index, "missing-route"] = "network: " missing_split[2] " next-hop: " missing_split[3]

                # get next missing VSID
                if (++curr_missing_index in missing_sorted) {
                    arr_len = split(missing_sorted[curr_missing_index], missing_split, ":")
                    # TODO: validate l
                    curr_missing_id = missing_split[1]
                } else {
                    curr_missing_id = -1  # we walked off the end of the missing routes list -- no more of them
                }
            }
        }

        # Note: if there are no missing routes for this VSID, we write an empty array object to insure correct alert resolution.
        # See the initialization of this_vs_missing above.
        writeComplexMetricObjectArray("routes-missing-kernel", metric_tags, this_vs_missing)
        delete this_vs_missing
    }
}
See screenshot. Metric written more than once false positive on two occations
First: In a comment(yes, this shouldn't exist, but still)
Second: Matching on a partial metric

Big ask, but it would be nice for an API
Something in the form of "Send code to page"->"Receive code with error markers back"
Just had a session with an IKE that got a weird behavior in his script. Turns out the section marker was missing a "!" which made command-runner/indeni interpret the script as one-step.
#! REMOTE::SSH
#! REMOTE::HTTP
#! META
#! PARSER::AWK
#! PARSER::XML
#! PARSER::JSON
# META
#META
# REMOTE::SSH
# REMOTE SSH
#! REMOTE SSH
#!REMOTE SSH
# REMOTE::HTTP
# REMOTE HTTP
#! REMOTE HTTP
#!REMOTE HTTP

# PARSER::XML
# PARSER XML
#! PARSER XML
#!PARSER XML
# PARSER::XML
# PARSER XML
#! PARSER XML
#!PARSER XML

# PARSER::JSON
# PARSER JSON
#! PARSER JSON
#!PARSER JSON
# PARSER::JSON
# PARSER JSON
#! PARSER JSON
#!PARSER JSON

# PARSER::AWK
# PARSER AWK
#! PARSER AWK
#!PARSER AWK
# PARSER::AWK
# PARSER AWK
#! PARSER AWK
#!PARSER AWK

To Reproduce:
run attached script in codequal:
expected: Should be no exceptions under "Exceptions thrown when parsing"; or, if there are "valid" exceptions, the error message should give some more clear information about what to do about the exception. A stack trace at least...?
actual:

e.g.,
split(infoArray[VS], splitDataArray, ";")
check doesn't catch either of these.
Scope in JavaScript is messy and scary. It's easy to accidentally create variables in global scope, even when you don't mean to. I find myself using slightly/totally different names for the same thing -- especially when I passing functions -- just to make sure I don't accidentally collide with some other variable name.
Should this be a warning or an error?

Probably just need an exception for this?
#! REMOTE::SSH vsName=$(awk -v var="${vsInfo}" 'BEGIN { split(var,splitArr,":"); print splitArr[1]}') && vsIP=$(awk -v var="${vsInfo}" 'BEGIN { split(var,splitArr,":"); print splitArr[2]}'); mdsenv $vsName; cpmiquerybin attr "" network_objects " (type='cluster_member' & vsx_cluster_member='true' & vs_cluster_member='true') | (type='cluster_member' & (! vs_cluster_member='true')) | (vsx_netobj='true') | (type='gateway'&cp_products_installed='true' & (! vs_netobj='true') & location='internal')" -a __name__,ipaddr | xargs -r -n 2 echo "Object: "$vsName" "$vsIP
total_per_vs_per_core[key] += thread_usage

#! META
name: chkp-gaia-routes-vsx
description: Report configured static and direct routes, and compare configured static routes with Linux routes.
type: monitoring
monitoring_interval: 10 minutes
requires:
    vendor: "checkpoint"
    os.name: "gaia"
    vsx: "true"
    role-firewall: "true"
    asg:
        neq: "true"

#! COMMENTS
static-routing-table:
    why: |
        It is important that the routing is configured the same for all cluster members of the same cluster. Otherwise there can be downtime in the event of a failover.
    how: |
        By parsing the gaia configuration database, /config/active, the static routes are retrieved. It can also be retrieved via Clish, but that creates a lot of log entries in /var/log/messages.
    without-indeni: |
        An administrator could login and manually run the command.
    can-with-snmp: true
    can-with-syslog: false
    vendor-provided-management: |
        Listing static routes is only available from the command line interface or via SNMP. In VSX it is also visible in SmartDashboard.

connected-networks-table:
    why: |
        It is important that the connected interfaces is configured the same, for all cluster members of the same cluster. Otherwise there can be downtime in the event of a failure.
    how: |
        By parsing the gaia configuration database, /config/active, the routes for directly connected interfaces are retrieved. It can also be retrieved via Clish, but that creates a lot of log entries in /var/log/messages.
    without-indeni: |
        An administrator could login and manually run the command.
    can-with-snmp: true
    can-with-syslog: false
    vendor-provided-management: |
        Listing routes for directly connected interfaces is only available from the command line interface, or SNMP.

routes-missing-kernel:
    why: |
        If a static route is configured via Clish or WebUI, sometimes the system does not write the route into the Linux kernel routing table. To make sure all routes have been written, we compare the actual kernel routes with those configured in Check Point.
    how: |
        Retrieve Linux kernel routes using the Linux "netstat" command, and then the Check Point configured routes from Gaia's /config/active file. Then compare two route sets to make sure they are the same.
    without-indeni: |
        An administrator could login and manually list routes from both commands, and then compare it. However, often there are a many routes configured; combine this with the difference in output format (for example subnet), and it can be a very cumbersome task.
    can-with-snmp: false
    can-with-syslog: false
    vendor-provided-management: |
        Listing routes from kernel is only available from the command line interface. Listing configured routes is also available from the WebUI.

#! REMOTE::SSH
${nice-path} -n 15 vsx stat -l | ${nice-path} -n 15 awk '/^VSID:/{ vsid=$NF } /^Type:/{ type = ""; for (i=2; i<=NF;i++) {type = type $i} } /^Name:/{ if (type == "VSXGateway" || type == "VirtualSystem"){ print vsid ":" $NF } }' | while read idAndName; do echo "_VSID:Name $idAndName"; IFS=':' read -ra arr <<< "$${idAndName}"; vsenv "$${arr[0]}" && ${nice-path} -n 15 netstat -rn; done; ${nice-path} -n 15 grep "route" /config/active


#! PARSER::AWK

#*** SSH Commandline Comments ***
# Here's a step-by-step explanation of the above command:
# - greps the output of 'vsx stat -l' for the 'VSID:' and 'Name:' lines. Filters on 'Type:'.
# - pipes the vsid:name, as $idAndName, into a while loop, which:
#     - echos each VS ID and Name
#     - parses the ID back out of $idAndName:
#         - splits the line on ':' into the 'arr' variable --> IFS=':' read -ra arr <<< "${idOrName}"
#         - gets the VSID # out of 'arr' as arr[0] (second index in array)
#     - sets the vsenv to the VSID and runs netstat in that context
# - greps /config/active for 'route'
#
# NOTE: even though this commandline grep's /config/active, it shouldn't be a problem for this script,
# since the last many lines of the input are already ignored by this script (i.e., not pertinent or used
# in any way).


function dumpVsRouteData() {
    if (last_instance == "default") {   # default is VSID 0
        last_instance = "0"
    }

    vs_tags["vs.id"] = last_instance
    vs_tags["vs.name"] = vsid_to_name[last_instance]

    if (arraylen(static_routes)) {
        writeComplexMetricObjectArrayWithLiveConfig("static-routing-table", vs_tags, static_routes, "Static Routing Table")
    }

    if (arraylen(direct_routes)) {
        writeComplexMetricObjectArrayWithLiveConfig("connected-networks-table", vs_tags, direct_routes, "Directly Connected Networks")
    }

    # delete arrays between "vs groups" of data
    delete static_routes
    delete direct_routes

    last_instance = current_instance  # set 'last' to the new (next) instance group
}

BEGIN {
    last_instance = ""
    ospf_enabled = 0

    net_mask_to_CIDR["0.0.0.0"] = 0
    net_mask_to_CIDR["128.0.0.0"] = 1
    net_mask_to_CIDR["192.0.0.0"] = 2
    net_mask_to_CIDR["224.0.0.0"] = 3
    net_mask_to_CIDR["240.0.0.0"] = 4
    net_mask_to_CIDR["248.0.0.0"] = 5
    net_mask_to_CIDR["252.0.0.0"] = 6
    net_mask_to_CIDR["254.0.0.0"] = 7
    net_mask_to_CIDR["255.0.0.0"] = 8
    net_mask_to_CIDR["255.128.0.0"] = 9
    net_mask_to_CIDR["255.192.0.0"] = 10
    net_mask_to_CIDR["255.224.0.0"] = 11
    net_mask_to_CIDR["255.240.0.0"] = 12
    net_mask_to_CIDR["255.248.0.0"] = 13
    net_mask_to_CIDR["255.252.0.0"] = 14
    net_mask_to_CIDR["255.254.0.0"] = 15
    net_mask_to_CIDR["255.255.0.0"] = 16
    net_mask_to_CIDR["255.255.128.0"] = 17
    net_mask_to_CIDR["255.255.192.0"] = 18
    net_mask_to_CIDR["255.255.224.0"] = 19
    net_mask_to_CIDR["255.255.240.0"] = 20
    net_mask_to_CIDR["255.255.248.0"] = 21
    net_mask_to_CIDR["255.255.252.0"] = 22
    net_mask_to_CIDR["255.255.254.0"] = 23
    net_mask_to_CIDR["255.255.255.0"] = 24
    net_mask_to_CIDR["255.255.255.128"] = 25
    net_mask_to_CIDR["255.255.255.192"] = 26
    net_mask_to_CIDR["255.255.255.224"] = 27
    net_mask_to_CIDR["255.255.255.240"] = 28
    net_mask_to_CIDR["255.255.255.248"] = 29
    net_mask_to_CIDR["255.255.255.252"] = 30
    net_mask_to_CIDR["255.255.255.254"] = 31
    net_mask_to_CIDR["255.255.255.255"] = 32
}

#_VSID:Name 0:lab-CP-VSXVSLS1
/^_VSID:Name/ {
    arr_len = split($2, id_and_name, ":")
    if (arr_len != 2) {
        # TODO: what to do?
    }
    stat_vs_id = id_and_name[1]
    vs_name = id_and_name[2]
    vsid_to_name[stat_vs_id] = vs_name
    ordered_vsid[++ordered_vsid_index] = stat_vs_id
    next
}

# netstat output: store information about routes configured in the OS.
#10.11.2.0       0.0.0.0         255.255.255.0   U         0 0          0 eth1
/^[0-9]{1,3}\.[0-9]{1,3}\.[0-9]{1,3}\.[0-9]{1,3}/ {
    destination = $1
    subnet_mask = $3
    cidr = net_mask_to_CIDR[subnet_mask]
    flags = $4
    gateway = $2

    if (destination == "0.0.0.0") {
        cidr = "0"
    }

    netstat_routes_for_compare[stat_vs_id ":" destination "/" cidr ":" gateway] = ""

    next
}

#routed:instance:7:static:network:10.20.10.0:masklen:27:gateway:address:10.10.10.6 t
#routed:instance:default:static:network:10.10.100.0:masklen:24:gateway:address:10.11.2.50 t
/routed:instance:/ {

    # This entire section is just to track the groups of VS data from /config/active

    split($1, split_line, ":")
    current_instance = split_line[3]

    # This whole "last_instance" "current_instance" dance lets us process each group of instance data (from /config/active)
    # as a group, group by group.
    if (last_instance == "") {          # only first time through
        last_instance = current_instance
    }

    # Every time we hit a 'new' current_instance (except the first one), dump all the data from the previous instance
    if (current_instance != last_instance) {
        dumpVsRouteData()
    }
}

# Store information about a route which has been configured on the device.
#routed:instance:default:static:network:10.10.100.0:masklen:24:gateway:address:10.11.2.50 t
#routed:instance:7:static:network:10.20.10.0:masklen:27:gateway:address:10.10.10.6 t
#routed:instance:7:static:network:10.10.10.0:masklen:24:gateway:lname:eth0.10 t
#routed:instance:2:static:network:192.168.194.0:masklen:24:gateway t
/routed:instance:.*:static:network:.+:masklen:[0-9]+:gateway:/ {
    split($1, split_line, ":")

    # if the second-to-last field is an IP address, it's a static route
    if (split_line[11] ~ /[0-9]{1,3}\.[0-9]{1,3}\.[0-9]{1,3}\.[0-9]{1,3}/) {
        # This is a static route
        gateway = split_line[11]   # gateway:address --> 10.10.10.6

        destination_network = split_line[6]  # destination network --> 10.20.10.0
        cidr = split_line[8]  # masklen --> 27

        config_vs_id = split_line[3]
        if (config_vs_id == "default")
            config_vs_id = 0

        # use this format to compare (below) with data collected from netstat
        static_routes_for_compare[config_vs_id ":" destination_network "/" cidr ":" gateway] = ""

        static_count++
        static_routes[static_count, "network"] = destination_network
        static_routes[static_count, "mask"] = cidr
        static_routes[static_count, "next-hop"] = gateway
    } else {
        # This is a directly connected route
        destination_network = split_line[6]
        cidr = split_line[8]

        direct_count++
        direct_routes[direct_count, "network"] = destination_network
        direct_routes[direct_count, "mask"] = cidr
    }

    next
}

# Store information about a default gateway configured in Clish.
#routed:instance:default:static:default:gateway:address:192.168.194.1 t
/routed:instance:default:static:default:gateway:address/ {
    split($1, split_line, ":")

    if (split_line[8] ~ /[0-9]{1,3}\.[0-9]{1,3}\.[0-9]{1,3}\.[0-9]{1,3}/) {
        gateway = split_line[8]

        static_routes_for_compare["0:0.0.0.0/0:" gateway] = ""

        static_count++
        static_routes[static_count, "network"] = "0.0.0.0"
        static_routes[static_count, "mask"] = "0"
        static_routes[static_count, "next-hop"] = gateway
    }

    next
}

# If the VSX is using OSPF, we will still report configured routes, but we won't look for missing routes.
#routed:instance:default:ospf2:interface:eth0:area 0.0.0.1
#routed:instance:default:ospf2:interface:eth1:area backbone
/^routed:instance:default:ospf2:interface:.*:area/ {
    ospf_enabled = 1
    next
}

END {
    # Dump the last data
    dumpVsRouteData()

    # If host uses OSPF, we're done: no route comparison with netstat
    if (ospf_enabled)
        exit

    missing_sorted[1] = ""
    missing_route_index = 0

    # For each static route configured on the device, make sure it's also in the netstat output
    for (static_route in static_routes_for_compare) {
        if (! (static_route in netstat_routes_for_compare)) {   # A missing route
            # Sort missing routes as we go so that we can write them out, per VSID, as 'missing-route' metrics below
            missing_sorted[++missing_route_index] = static_route
            for (i = missing_route_index; i > 0; i--) {
                if (static_route < missing_sorted[i]) {
                    hold = missing_sorted[i]
                    missing_sorted[i] = static_route
                    missing_sorted[i + 1] = hold
                }
            }
        }
    }


    # Dump the missing route metrics. There can be 0 -> * missing routes for each VSID.

    # get the first missing route VSID if there is one
    curr_missing_id = -1
    curr_missing_index = 1
    if (missing_sorted[curr_missing_index] != "") {  # we have at least one missing route
        arr_len = split(missing_sorted[1], missing_split, ":")
        # TODO: validate l
        curr_missing_id = missing_split[1]
    }

    # for each VSID
    for (i in ordered_vsid) {
        split("", this_vs_missing)  # This is how to initialize an empty array in AWK -- see use below
        vs_id = ordered_vsid[i]
        metric_tags["vs.name"] = "VSID: " vs_id ", VS Name: " vsid_to_name[vs_id]
        if (vs_id == curr_missing_id) {
            missing_per_vs_index = 0
            while (curr_missing_id == vs_id) {   # collect all missing routes for this VSID
                # add current missing to list
                this_vs_missing[++missing_per_vs_index, "missing-route"] = "network: " missing_split[2] " next-hop: " missing_split[3]

                # get next missing VSID
                if (++curr_missing_index in missing_sorted) {
                    arr_len = split(missing_sorted[curr_missing_index], missing_split, ":")
                    # TODO: validate l
                    curr_missing_id = missing_split[1]
                } else {
                    curr_missing_id = -1  # we walked off the end of the missing routes list -- no more of them
                }
            }
        }

        # Note: if there are no missing routes for this VSID, we write an empty array object to insure correct alert resolution.
        # See the initialization of this_vs_missing above.
        writeComplexMetricObjectArray("routes-missing-kernel", metric_tags, this_vs_missing)
        delete this_vs_missing
    }
}
Not sure if we care. If we do, this is a false positive:
writeDynamicVariable("vsInfo", step1)
Right now, we essentially have two JS script load paths: one for the code in the browser (in indeni.html using <script> tags), and one for the tape tests (using require() via node.js).
At this point, it's not too bad, but generally speaking, this is a terrible way to go: every time we want to expose another function for testing, we have to re-architect the code to isolate the dependencies enough to make it possible to test.
I took a look at requre.js. I'm pretty sure it would be possible to use this for both the browser code and the test code, so we would have one way to load the JS for both browser and testing. I dug into a little, but didn't make a proof of concept: it's not entirely trivial, at least to me. I think that, once we got it setup, it would be pretty obvious how it's supposed to work, and would almost certainly help clean up the overall structure of the code.
Note that we will also probably want/need this: http://requirejs.org/docs/download.html#domReady
A declarative, efficient, and flexible JavaScript library for building user interfaces.
🖖 Vue.js is a progressive, incrementally-adoptable JavaScript framework for building UI on the web.
TypeScript is a superset of JavaScript that compiles to clean JavaScript output.
An Open Source Machine Learning Framework for Everyone
The Web framework for perfectionists with deadlines.
A PHP framework for web artisans
Bring data to life with SVG, Canvas and HTML. 📊📈🎉
JavaScript (JS) is a lightweight interpreted programming language with first-class functions.
Some thing interesting about web. New door for the world.
A server is a program made to process requests and deliver data to clients.
Machine learning is a way of modeling and interpreting data that allows a piece of software to respond intelligently.
Some thing interesting about visualization, use data art
Some thing interesting about game, make everyone happy.
We are working to build community through open source technology. NB: members must have two-factor auth.
Open source projects and samples from Microsoft.
Google ❤️ Open Source for everyone.
Alibaba Open Source for everyone
Data-Driven Documents codes.
China tencent open source team.