Coder Social home page Coder Social logo

turnip-calculator's Introduction

ACNH Turnip Calculator

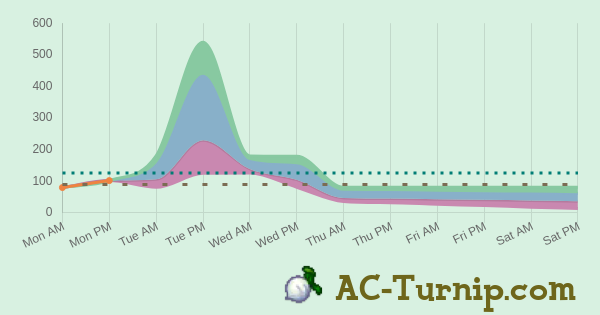
Calculate your turnip price patterns and gain the most from the stalk market!

You can find the live calculator here.

API

Looking for an API? See this

Local Development

To run this application locally, run the following commands:

git clone [email protected]:elxris/Turnip-Calculator.git
cd Turnip-Calculator
npm i
npm start

Localizations

For translators

Please go to i18n.ac-turnip.com to start translating.

For developers

This app supports dynamic localization using i18next and react-i18next, with i18next-browser-languagedetector to automatically detect the user's native OS language preferences and switch the app's language accordingly.

Adding new text to localizations

As features are added to the calculator, they'll most likely not be localised immediately. To localise any new text in the app, make sure to first wrap the text in the t() method taken from the useTranslation() hook. Then, in your language's translation.json, add a new JSON key/value pair with the key used in the t() method, using your translated text as the value.

For example, let's say we're adding a new button that says "Show Current Pattern". In the component where that text would be displayed, you would instead write t("Show Current Pattern"), wrapping the statement in brackets {} if it were part of JSX code.

Then, to add a translation to your language, you'd go to your languages translation.json file, and add the following line (using Spanish as an example):

"Show Current Pattern": "Mostrar Patrón Actual",

If no key is specified in the localization files, the app will simply display whatever text is passed into t(), to avoid errors.

Creating new localizations

To localise the app to a new language, the following simple steps need to be done:

  • Create a new folder under /locales for your language using the standard two-letter IETF language code for your language (e.g. es for Spanish, zh for Chinese). Keep in mind, the language code often differs from the more commonly known country code. For example, the country code for Korea is kr, but the language code for Korean is ko.
    • Dialect codes are supported (e.g. en-GB for British English and pt-BR for Brazilian Portuguese), but be sure to avoid hyphens (-) in variable names. As a reminder, hyphens can't be used in JavaScript variable names. When in doubt, stay consistent with existing code.
  • In the newly created folder, copy and paste the translation.json file from one of the other languages.
  • Edit the translation.json file to translate each untranslated JSON value to the appropriate translated equivalent in your language.
  • In /src/i18n.js, create an import statement for your language, importing the translation.json file you just created. Follow the pattern used by the existing statements.
  • In the same file (/src/i18n.js), add your language to the list of languages inside the resources object within the i18n.init() method, following the pattern of other declared languages, and using the same two-letter language code you used for the folder name in the first step.
  • Lastly, to add your language to the manual language switcher on the page, make sure to edit the Localizer component at /src/Localizer.jsx. Add a tuple for your language to the languages array, with the first value being your two-letter language code and the second value being the name of your language, in your language.
    • For example, to add Japanese to the list, you'd add ["ja", "日本語"],

The localization is now ready to deploy and will appear to users who use your language for their browser.

turnip-calculator's People

Contributors

actions-user avatar alans181824 avatar benhid avatar borjiso avatar dependabot[bot] avatar devsplash avatar dstaley avatar ekaekale avatar elxris avatar evansantos avatar fabiomurru96 avatar jarodyparody avatar jaucr avatar jeandeaual avatar lucka-me avatar mmarquez76 avatar moonseob avatar ndoll avatar noelierx avatar osro avatar pindab0ter avatar saitho avatar silpheel avatar superpranx avatar suzuya1755 avatar sylviaji avatar tiagoskaneta avatar uabaena avatar weblate avatar ybalrid avatar

Stargazers

 avatar  avatar  avatar  avatar  avatar  avatar  avatar  avatar  avatar  avatar  avatar  avatar  avatar  avatar  avatar  avatar  avatar  avatar  avatar  avatar  avatar  avatar  avatar  avatar  avatar  avatar  avatar  avatar  avatar  avatar  avatar  avatar  avatar  avatar  avatar  avatar  avatar  avatar  avatar  avatar  avatar  avatar  avatar  avatar  avatar  avatar  avatar  avatar  avatar  avatar  avatar  avatar  avatar  avatar  avatar  avatar  avatar  avatar  avatar  avatar  avatar  avatar  avatar  avatar  avatar  avatar  avatar  avatar  avatar  avatar  avatar  avatar  avatar  avatar  avatar  avatar  avatar  avatar  avatar  avatar  avatar  avatar  avatar  avatar  avatar  avatar  avatar  avatar  avatar  avatar  avatar  avatar  avatar  avatar  avatar  avatar  avatar  avatar  avatar  avatar

Watchers

 avatar  avatar  avatar  avatar  avatar  avatar  avatar  avatar  avatar  avatar

turnip-calculator's Issues

[request] ability to hide max/average/min tooltip

As the title states, just a small QOL suggestion. I find myself trying to get a look at my full graph for the week but on mobile that tooltip takes up a good chunk of screen space right where I'm trying to look.

Thank you for the calculator! If its projections are accurate I'm looking at a sharp spike to the 400 range in an hour :) pretty stoked

Market changes post-update

Before the update and remodel of Nook's, my market trend was showing an absolute max of 222bells/turnip. When I checked my market tonight, I had a spike of 432 bells. I don't know whether the shop closing it update caused this because they happened in the same day

Sell price went under the minimum guaranteed

Hi ! I bought my turnips 103 bells on 04/19, and time-traveled my way through the week, to test the simulation, first 04/20 10am then 2pm next 04/21 10am then 2pm and on and on.
On Tuesday AM, the price went to 84 for a guaranted minimum of 87, and then kept on falling to a ridicule 47 bells on saturday PM.
I had a promising friday PM but unfortunately it crashed down.

Screenshot 2020-04-19 at 13 34 26

Screenshot 2020-04-19 at 13 31 46

Screenshot 2020-04-19 at 13 28 07

What did I do wrong ?
Anyway thanks for all the work you put on on this tool !
Greetings from France (excuse the bad english)

[REQUEST] Copy share data

I believe it could be useful to add a button on the share window to copy the data to the text field on the main page. An example would be if you have an external tool to generate a share link for the turnip calculator and you would like to use or modify that data on the website itself.

WASM support

In your Reddit post you mentioned wanting to port the original code to WASM?

I spent an evening trying to port the original program to run in the browser (I haven't done this before), but had trouble exposing the functions to the JavaScript runtime. I want to spend a couple more nights this week trying to figure it out 🛠

Are you open to pull requests? I really love the graphs!

[Request] Guaranteed Minimum Price

Example data:

Purchase price: 91
Mon AM: 47
Mon PM: 43
Tues AM: 39

The chart seems to indicate that there's a chance that the price will never break 100, but that's not actually true. Every pattern actually hits 126 minimum at some point during the week, even if all patterns combined have a chance of being below 100 every day.

I'm not a dataviz expert, so I'm not sure what options there are to improve this, but somehow indicating that all patterns will at least hit a certain minimum is useful information that the chart obscures due to how the patterns can be offset by a day from eachother throughout the week.

Maybe we can just add a note at the bottom of the table indicating the smallest possible peak across all patterns, so you can tell whether the value you're currently seeing is lower than peak on the worst available pattern.

Result graph decreases slowly in height on page load

When load the site, I can see the result graph below BUT it is decreasing in height over time which prevents me from being able to see the result after a specific time has passed.

Gotta admit tho, looks kinda hilarious. I attached a preview of it.

Using Edge Chromium 80 on Windows10
Bug

Share Graph does not match calculated graph

Turnip prices of:
Buy: 103
Mon AM: 70
Mon PM: 65
Tue AM: 62
Tue PM: 57
Wed AM: 53
Wed PM: 48
Displays a graph where it looks like the spike would be Friday PM/Saturday AM.
image

However, the share graph is very different:
image

For some reason it has both the spike occurring Wed PM, and the daily price line is all sorts of wrong. It should be trending down from day 1, not going up from Tue through Wed, and not missing from Mon PM through Tue PM.

I am assuming something isn't being parsed correctly with the given inputs.

[REQUEST] Public API

Would a public API be possible? In our discord we keep track of everyone's prices and use this website for predictions. I wanted to make a bot to keep track of everyone's entries and it might be cool to be able to send the numbers through a public endpoint and receive the same data the chart receives.

Just a thought, not sure if anyone else would find this useful.

Garanteed Minimum is Wrong for me

Hello ! (I'm french, so sorry if my English is bad :P)

The Garanteed Minimum value is 76 this week for me, but I had 75 yesterday and 72 this morning. What's wrong ?

Thanks for your tool :)

Screenshot_20200421-081045_Chrome
Screenshot_20200421-081133_Chrome

Different Results between Desktop and Mobile

Current data: https://ac-turnip.com/share?f=90-78-122

Desktop Graph:

Mobile Graph:

image

Mobile Screenshot (Both graphs)

image

Note: Mobile share graph seems to match desktop graph.

Also, the first image is linked directly from the website (i.e. https://ac-turnip.com/p-90-78-122.png) so I would imagine this is what the graph is supposed to look like.

Potentially related to #89?


UPDATE:
Just tried to view that issue and the same thing happens on mobile... so this might simply be a duplicate of #89 or #79.

Chart Pattern Doesn't Exist?

I had a price fluctuation happen that apparently doesn't exist and just hoping I can get some insight on that as to why it happened?

I attached a screenshot below to hopefully assist.

Turnip Wrong

graph won't show if i put in my friday prices

these are all genuine prices, i had a real bad week for turnip prices:
monday: 47/45
tuesday ??/35
wednesday: 122/87
thursday: 135/168
friday: 77/??

and as soon as i add the 77, the whole colours disappear from the background.
before:
image

after:
image

i assume this is by design, however it's strange to see the whole graph go away with genuine prices

[FEATURE] Chaning UI Fonts

I just saw the Asian and Russian versions of the tool don't display the correct font (This is due to the fonts not having those characters).
My suggestion is to use the in-game fonts which do have all those characters (I can send them via email in case you don't have them).

Feature Improvement - Datatips Info Timeout

Datatips on mobile block most of the chart. Any way to make those go away? Once they appear, I can't find a way on mobile to remove the datatips pop up. Maybe add a timeout to cause them to drop away after a few seconds or maybe after a second tap on the same point?

Minor QOL change but I'd find it much more readable this way

[Request] Allow for store closed day?

When Nook's Cranny upgrades you can't sell turnips. It doesn't mess with the trend, but I wish there was a way to lock the value as 'null' or '-'.

the link is Redirecting

[You can find the live calculator here.]
which I click the word here and I couldn‘t get the Calculator,web page shows that page is Redirecting ...

Site is down

When I go to the github.io link, I get redirected to ac-turnip.com, which produces a 404 error. Was some site configuration not updated?

Guaranteed Minimum changed mid-week

My island has a decreasing trend - the calculator had a guaranteed minimum of 134 until today, where it correctly detected the downward trend and adapted the guaranteed minimum.

I am not sure if this is desired behaviour for a "guarantee", here is the data for the week:
Buy: 97
78 - 80 - 77 - 74 - 70 - 66 - 62 -59

Until entering the 59 for Thu PM the guaranteed minimum stays at 134.

If it is intended behaviour please change the wording to "expected minimum" or "probable minimum"

Catalan translation

Hi guys, first of all good job, i did the catalan translation (code ca) how can i add it to the master?

i cloned the repo and i transalated and commited, but when i tried to upload i got a 403 error because i'm not a collaborator

what i need to do for upload the translation?

Cheers

Min/max around known data points?

Perhaps more of a question than an absolute issue. Once you've entered a few data points, the graph shows minimum and maximum values around those points you've already entered. Why is that? Shouldn't all possible models that don't actually match the values you've entered already be eliminated? I would expect to see nothing but one line (or really, four overlapping lines) in the sections where absolute truth has already been entered.

Website doesn't work on Firefox ?

Hello

On Firefox, I tried 1 hour ago to connect to ac-turnip.com and it didn't work and now it still doesn't.
I opened Chrome and the website works

Can someone check if I'm not the only one where it doesn't work on Firefox, else just close this issue
I just find it weird that it works only on Chrome now, bc this early morning 8:00 UTC+1 it still worked on Firefox

Add tickbox for "first week buying on your island"

The first week you buy turnips from your island, the game rerolls your prices on the next Monday morning (including base price) & forces you onto the small spike pattern. This adds some unpredictability as to what the base price is, but at least the pattern is known.

Internationalization is good, but let us choose the language

Hi, I really like this project and the work put behind this is admirable

I'm pleased to see that the site is translated in different languages, but the core mechanic of changing the language is missing.

My PC is in German, but I would prefer to be able to use this tool in English...

If this is already implemented but I'm too dumb to find it, I'm sorry ;)

Incorrect bump model math

This is very sleek! I think there's a bug: Try setting prices to 90,87,84,81,78,75,72 to try to narrow this down to a weak bump model; the peak prices are AFAIUI not [153, 221] inclusive but should be:

1.4 * 110 --> 154; and
2.0 * 110 --> 220.

The days before and after the peak should be shifted down by one; so [153, 219].

...If I am understanding ninji's code analysis correctly, anyway.

(I wrote my own price predictor in python; it does not have a very pretty web UI, but I think I have a good idea of what it takes to do backwards analysis for the prices to weed out invalid models.)

[REQUEST] Allow creating share-able links

I'm thinking you could encode the numbers into a queryparameter that would load in the linked numbers without overriding your local storage filters.

Maybe you could format the same way, just an array like [100,81,77,,,,,,,,,,,] and then just base64 encode so https://elxris.github.io/Turnip-Calculator/?filters=WzEwMCw4MSw3NywsLCwsLCwsLCwsXQo= would drop those numbers in.

Do you think this is a good idea? Is filters a good name for the queryparam? I'd love to work on this feature if you think it's worth implementing.

Empty chart? Post here

Please post here your input data if the calculator can't give you a result.

Example format:

Version: 1.9.0
Buy price: 90
Mon ??, 90
Tue 80. ??
Wed ??, 90
...

It is not necessary to fill days you don't know the date.

Internationalization

Update May/2023:

The server was decommissioned due the low usage over the last year. You can continue to make PR's to update the translation. If you have questions or need help, please post a comment here.

Please go to https://i18n.ac-turnip.com/projects/ac-turnip-com/turnip-calculator/ to start translating!

Register an account and make changes!

Update May/2022:

The previous instance of this platform had an unrecoverable failure and now it is long gone with all the users.
You will need to create a new user to translate again.
Sorry for the inconveniences, I will try my best this time.

Wrong Max

So far, 2 days this week prices have exceeded the max (it's wednesday as I'm typing this). This was before the latest patch and nothing out of the ordinary happened this week (no shop closings etc). Please, let me know if you need more details. Thanks!
Screenshots:
Screen Shot 2020-04-22 at 8 32 33 PM
Screen Shot 2020-04-22 at 8 32 52 PM
Screen Shot 2020-04-22 at 8 33 04 PM

[REQUEST] Predict what pattern we are/aren't in.

If I am understanding correctly it should be possible to predict what pattern you are in kind of quickly. For example, I bought turnips for 90 and my Monday numbers were 67 and 61 for the morning and afternoon respectfully. This tells me that I can't be in a decreasing pattern as the drop from 90->67 is just too sharp.

Graph Shrinking

Using Microsoft Edge browser, the graph is shrinking vertically until it disappears. Using the inspector I can see the heights in this code starts around 566 and 400px and increments down to 0 in a matter of seconds.

<canvas unselectable="on" width="1276" height="0" style="user-select: none; display: block; box-sizing: border-box; width: 880px; height: 0px;">

Forcing the second (px) value to anything over 641px has it shrink to 641px. Setting it to 1600px shrinks it down to 1282px (excactly 2x 641px).

Works fine in Chrome and Firefox. Worked fine in Edge until recently.

Repeated error

So three times in a row now I input the start value and values up till Thursday am. Usually itd project a friday average that's decent (100+). Then I input Thursday PM and the whole chart changes to next day dropping down below 50 and saturday even lower.
Not sure why its changing the graph 70% through the week. Didnt so this first couple times I used it.

Model shows future values that ar not possible for Random/Fluctuating pattern

Using the input data of:
Buy: 90
Price: 66,61,54,83,99 through Wed AM

This pattern should be the Random/Fluctuating type of pattern. Given this data the model on your tool shows possible values that range from 22 to 181. Given the pattern it should dip down then back up at some point. Minimum would be 45 and max would be 126.

When the value of 64 is put in for Wed PM it show the correct pattern. It seems to assume there is the possibility of a small spike until that value is put in.

I'm not the best at code, but let me know if I can help.

Previous week's data?

I'm just curious, when the week rolls over do I clear data and start over? Or do I leave last week's data in the fields?

French translation

Hi, I would love to help you with this application. I would like to translate it in French to share to my friends but I don't really know how to ... xD
Maybe you can tell me how to :)

Small Error in new language switcher

Hi again

I issued #29 and I appreciate the work done

Currently the German button is "Deutsche", but "Deutsch" would be correct
I don't know how the language checker is handled, my web-dev knowledge is to low to try correct it myself

I know it's no important change, but still nice to have

[REQUEST] Support tracking multiple sets of turnip prices

Hey, awesome tool!

I'd love to suggest the addition of being able to have multiple "sets" of turnip prices. I'm keeping track of the prices of 5 different people and would love to be able to keep track of them all at the same time.

Adding tabs to the interface seems like it would be the easiest way to keep the UI the same, easily swapping between people.

I think rounding math might lead to incorrect results

I don't yet have in-game experimental evidence to back this claim up, but I've been thinking a lot about the way prices are calculated (from @_Ninji's work):

intceil(rate * basePrice)

If my basePrice is 105 and the rate variable is something like 89.9%, ceil() will give me a resulting price of 95. The rate variable is within the 85-90% range for Monday AM meaning Pattern 1 is possible, but your tool disqualifies it -- I assume because 95 / 105 is greater than 90%, as a case like 94 / 105 functions properly.

Recommend Projects

  • React photo React

    A declarative, efficient, and flexible JavaScript library for building user interfaces.

  • Vue.js photo Vue.js

    🖖 Vue.js is a progressive, incrementally-adoptable JavaScript framework for building UI on the web.

  • Typescript photo Typescript

    TypeScript is a superset of JavaScript that compiles to clean JavaScript output.

  • TensorFlow photo TensorFlow

    An Open Source Machine Learning Framework for Everyone

  • Django photo Django

    The Web framework for perfectionists with deadlines.

  • D3 photo D3

    Bring data to life with SVG, Canvas and HTML. 📊📈🎉

Recommend Topics

  • javascript

    JavaScript (JS) is a lightweight interpreted programming language with first-class functions.

  • web

    Some thing interesting about web. New door for the world.

  • server

    A server is a program made to process requests and deliver data to clients.

  • Machine learning

    Machine learning is a way of modeling and interpreting data that allows a piece of software to respond intelligently.

  • Game

    Some thing interesting about game, make everyone happy.

Recommend Org

  • Facebook photo Facebook

    We are working to build community through open source technology. NB: members must have two-factor auth.

  • Microsoft photo Microsoft

    Open source projects and samples from Microsoft.

  • Google photo Google

    Google ❤️ Open Source for everyone.

  • D3 photo D3

    Data-Driven Documents codes.