Python Outlier Detection (PyOD)
Deployment & Documentation & Stats


Build Status & Code Coverage & Maintainability


PyOD is a comprehensive and scalable Python toolkit for detecting outlying objects in multivariate data. This exciting yet challenging field is commonly referred as Outlier Detection or Anomaly Detection. Since 2017, PyOD has been successfully used in various academic researches and commercial products [17] [18] [19]. PyOD is featured for:
- Unified APIs, detailed documentation, and interactive examples across various algorithms.
- Advanced models, including Neural Networks/Deep Learning and Outlier Ensembles.
- Optimized performance with JIT and parallelization when possible, using numba and joblib.
- Compatible with both Python 2 & 3 (scikit-learn compatible as well).
Important Notes: PyOD contains some neural network based models, e.g., AutoEncoders, which are implemented in keras. However, PyOD would NOT install Keras and/or TensorFlow automatically. This reduces the risk of damaging your local installations. So you should install keras and back-end libraries like TensorFlow, if you want to use neural net based models. An instruction is provided: issue19b.
Key Links and Resources:
Table of Contents:
- Quick Introduction
- Installation
- API Cheatsheet & Reference
- Algorithm Benchmark
- Quick Start for Outlier Detection
- Quick Start for Combining Outlier Scores from Various Base Detectors
- How to Contribute and Collaborate
Quick Introduction
PyOD toolkit consists of three major groups of functionalities:
(i) Individual Detection Algorithms :
| Type | Abbr | Algorithm | Year | Ref |
|---|---|---|---|---|
| Linear Model | PCA | Principal Component Analysis (the sum of weighted projected distances to the eigenvector hyperplanes) | 2003 | [16] |
| Linear Model | MCD | Minimum Covariance Determinant (use the mahalanobis distances as the outlier scores) | 1999 | [6] [15] |
| Linear Model | OCSVM | One-Class Support Vector Machines | 2003 | [12] |
| Proximity-Based | LOF | Local Outlier Factor | 2000 | [4] |
| Proximity-Based | CBLOF | Clustering-Based Local Outlier Factor | 2003 | [7] |
| Proximity-Based | LOCI | LOCI: Fast outlier detection using the local correlation integral | 2003 | [13] |
| Proximity-Based | HBOS | Histogram-based Outlier Score | 2012 | [5] |
| Proximity-Based | kNN | k Nearest Neighbors (use the distance to the kth nearest neighbor as the outlier score | 2000 | [14] |
| Proximity-Based | AvgKNN | Average kNN (use the average distance to k nearest neighbors as the outlier score) | 2002 | [3] |
| Proximity-Based | MedKNN | Median kNN (use the median distance to k nearest neighbors as the outlier score) | 2002 | [3] |
| Probabilistic | ABOD | Angle-Based Outlier Detection | 2008 | [9] |
| Probabilistic | FastABOD | Fast Angle-Based Outlier Detection using approximation | 2008 | [9] |
| Probabilistic | SOS | Stochastic Outlier Selection | 2012 | [8] |
| Outlier Ensembles | IForest | Isolation Forest | 2008 | [11] |
| Neural Networks | AutoEncoder | Fully connected AutoEncoder (use reconstruction error as the outlier score) | [1] [Ch.3] |
FAQ regarding AutoEncoder in PyOD and debugging advice: known issues
(ii) Outlier Ensembles & Outlier Detector Combination Frameworks:
| Type | Abbr | Algorithm | Year | Ref |
|---|---|---|---|---|
| Outlier Ensembles | Feature Bagging | 2005 | [10] | |
| Outlier Ensembles | LSCP | LSCP: Locally Selective Combination of Parallel Outlier Ensembles | 2019 | [19] |
| Combination | Average | Simple combination by averaging the scores | 2015 | [2] |
| Combination | Weighted Average | Simple combination by averaging the scores with detector weights | 2015 | [2] |
| Combination | Maximization | Simple combination by taking the maximum scores | 2015 | [2] |
| Combination | AOM | Average of Maximum | 2015 | [2] |
| Combination | MOA | Maximization of Average | 2015 | [2] |
(iii) Utility Functions:
| Type | Name | Function | Documentation |
|---|---|---|---|
| Data | generate_data | Synthesized data generation; normal data is generated by a multivariate Gaussian and outliers are generated by a uniform distribution | generate_data |
| Stat | wpearsonr | Calculate the weighted Pearson correlation of two samples | wpearsonr |
| Utility | get_label_n | Turn raw outlier scores into binary labels by assign 1 to top n outlier scores | get_label_n |
| Utility | precision_n_scores | calculate precision @ rank n | precision_n_scores |
Installation
It is recommended to use pip for installation. Please make sure the latest version is installed, as PyOD is updated frequently:
pip install pyod
pip install --upgrade pyod # make sure the latest version is installed!
Alternatively, install from github directly (NOT Recommended)
git clone https://github.com/yzhao062/pyod.git
python setup.py install
Required Dependencies:
- Python 2.7, 3.5, 3.6, or 3.7
- numpy>=1.13
- numba>=0.35
- scipy>=0.19.1
- scikit_learn>=0.19.1
Optional Dependencies (required for running examples and AutoEncoder):
- Keras (optional, required if calling AutoEncoder, other backend works)
- Matplotlib (optional, required for running examples)
- TensorFlow (optional, required if calling AutoEncoder, other backend works)
Known Issue 1: Running examples needs Matplotlib, which may throw errors in conda virtual environment on mac OS. See reasons and solutions issue6.
Known Issue 2: Keras and/or TensorFlow are listed as optional. However, they are both required if you want to use neural network based models, such as AutoEncoder. See reasons and solutions issue19a
API Cheatsheet & Reference
Full API Reference: (https://pyod.readthedocs.io/en/latest/pyod.html). API cheatsheet for all detectors:
- fit(X): Fit detector.
- fit_predict(X): Fit detector and predict if a particular sample is an outlier or not.
- fit_predict_score(X, y): Fit, predict and then evaluate with predefined metrics (ROC and precision @ rank n).
- decision_function(X): Predict anomaly score of X of the base classifiers.
- predict(X): Predict if a particular sample is an outlier or not. The model must be fitted first.
- predict_proba(X): Predict the probability of a sample being outlier. The model must be fitted first.
Key Attributes of a fitted model:
- decision_scores: The outlier scores of the training data. The higher, the more abnormal. Outliers tend to have higher scores.
- labels_: The binary labels of the training data. 0 stands for inliers and 1 for outliers/anomalies.
Full package structure can be found below:
- http://pyod.readthedocs.io/en/latest/genindex.html
- http://pyod.readthedocs.io/en/latest/py-modindex.html
Algorithm Benchmark
Comparison of all implemented models are made available below:
(Figure, compare_all_models.py, Interactive Jupyter Notebooks):
For Jupyter Notebooks, please navigate to "/notebooks/Compare All Models.ipynb"
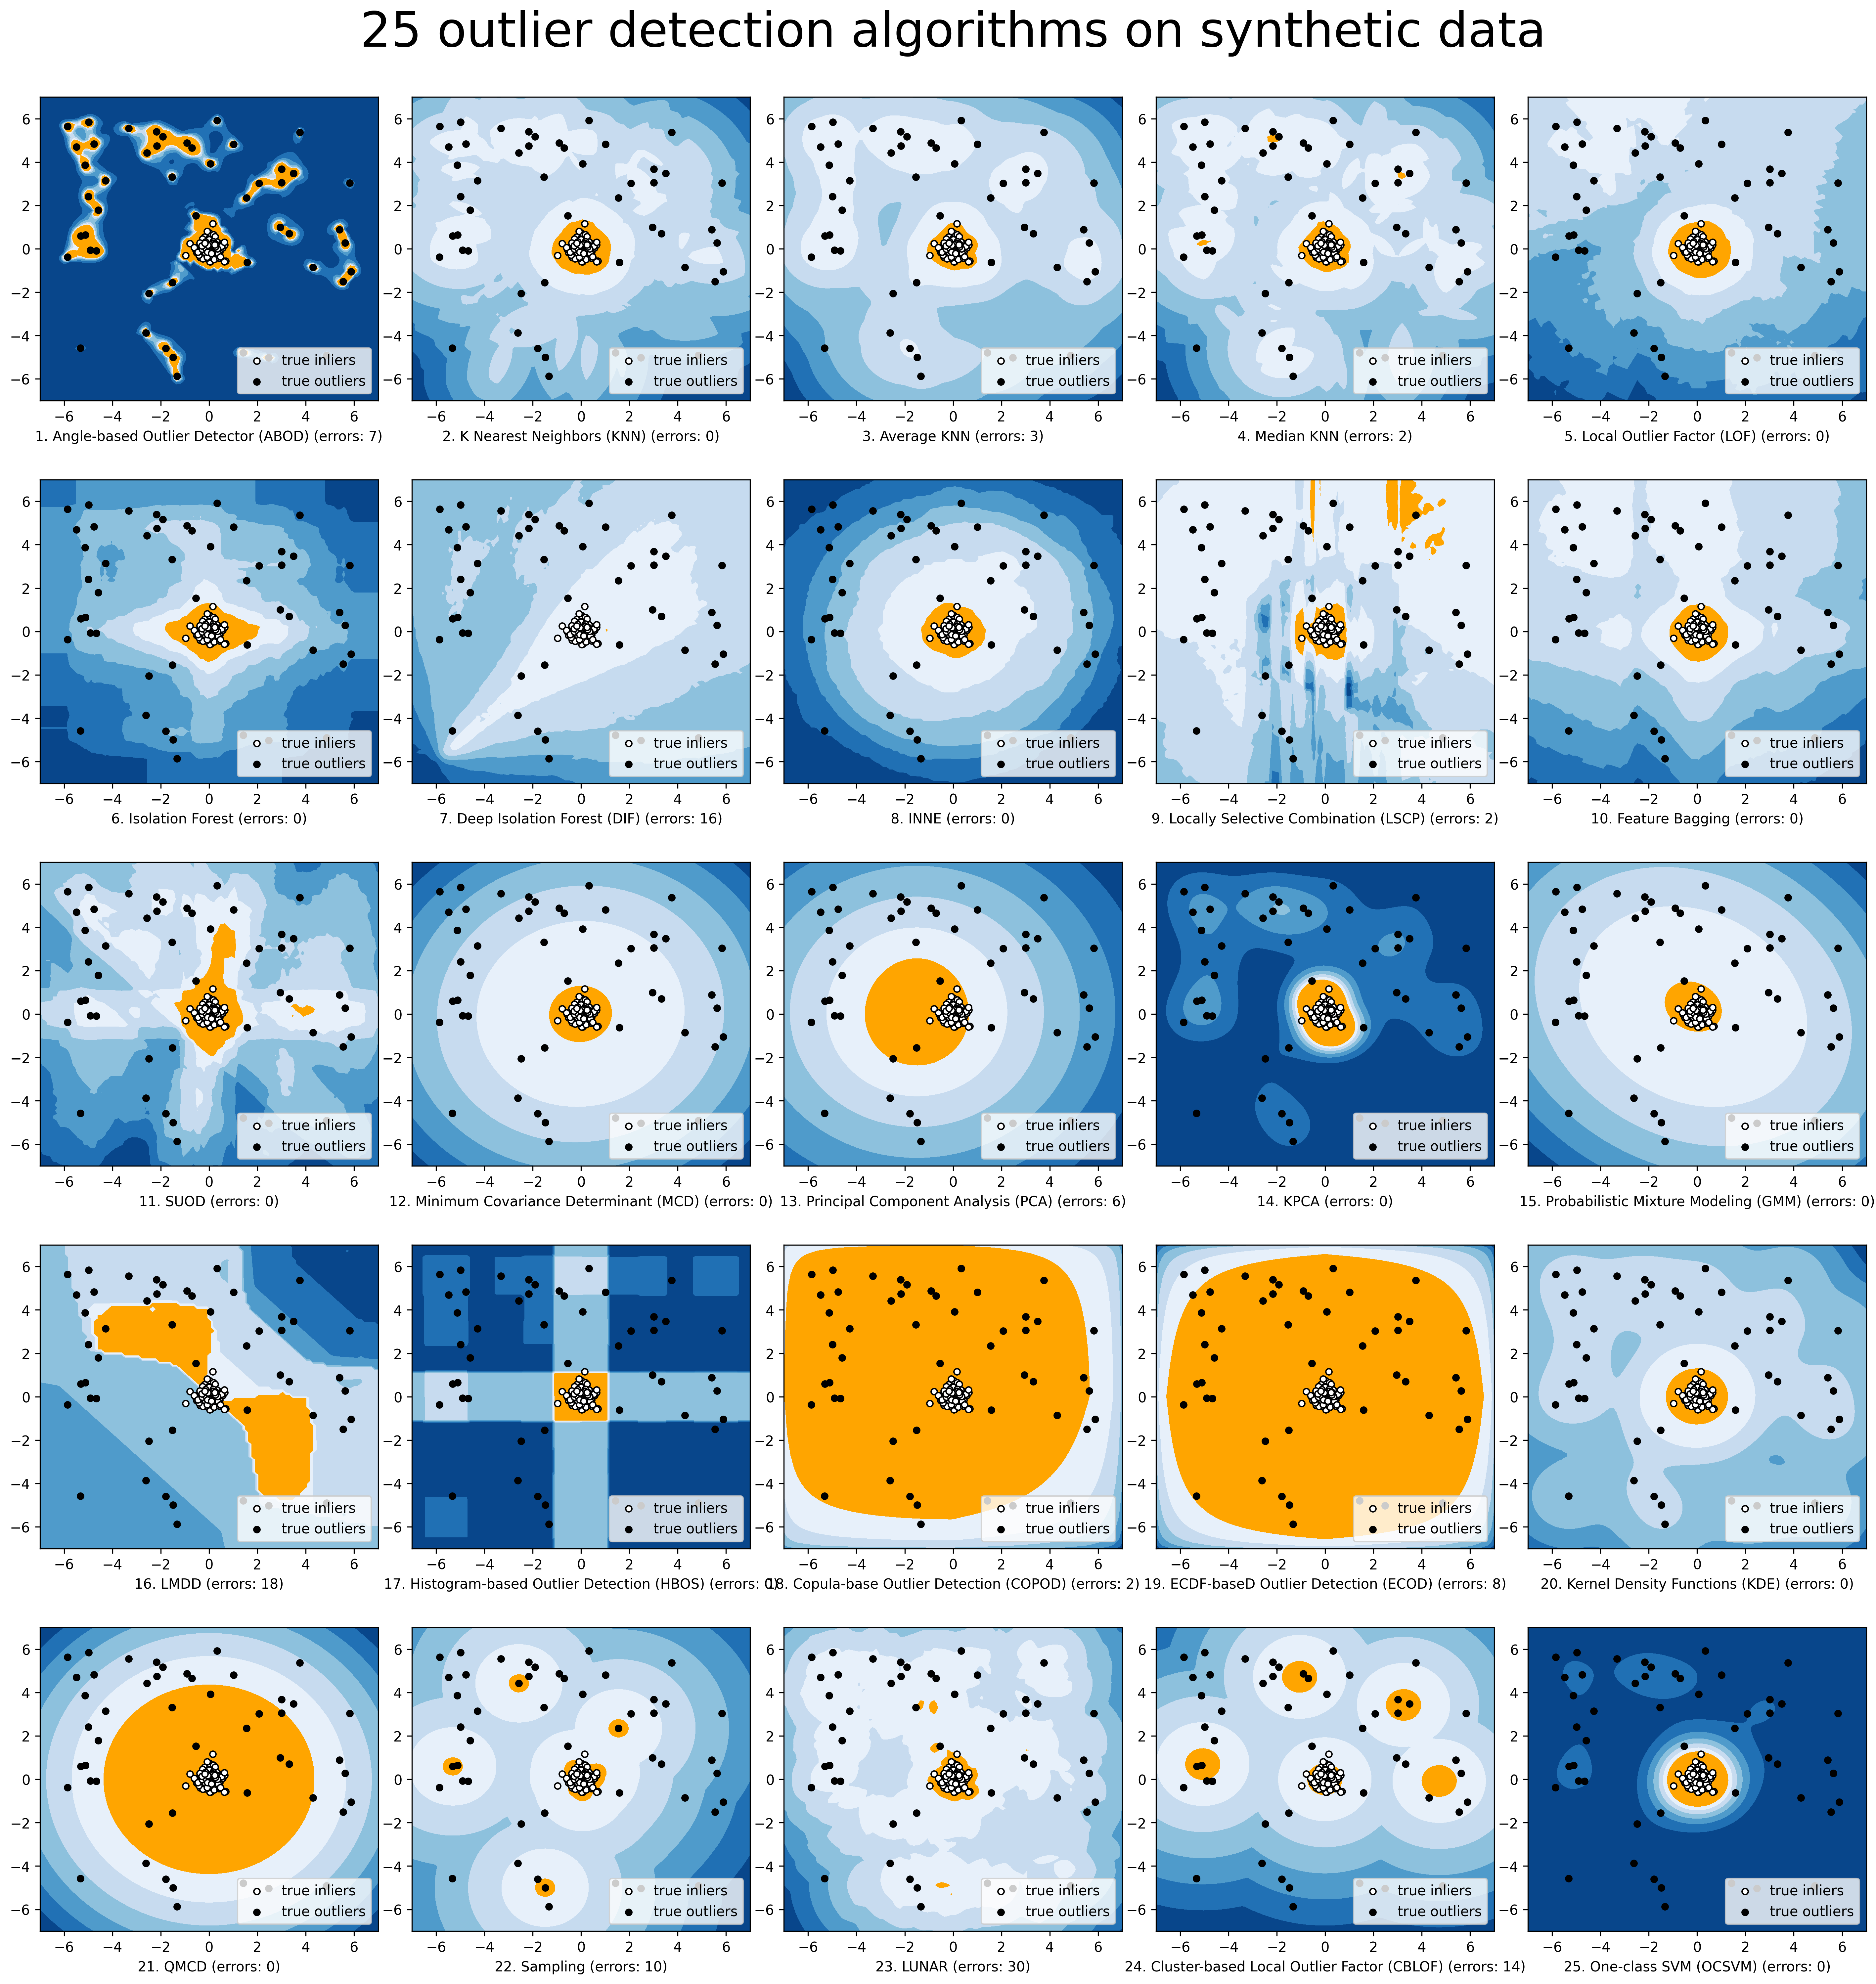
To provide an overview and quick guidance of the implemented models, a benchmark is supplied. In total, 17 benchmark data are used for comparision, all datasets could be downloaded at ODDS.
For each dataset, it is first split into 60% for training and 40% for testing. All experiments are repeated 20 times independently with different samplings. The mean of 20 trials are taken as the final result. Three evaluation metrics are provided:
- The area under receiver operating characteristic (ROC) curve
- Precision @ rank n (P@N)
- Execution time
Check the latest result benchmark. You are welcome to replicate this process by running benchmark.py.
Quick Start for Outlier Detection
See examples directory for more demos. "examples/knn_example.py" demonstrates the basic APIs of PyOD using kNN detector. It is noted the APIs for other detectors are similar.
More detailed instruction of running examples can be found examples.
Initialize a kNN detector, fit the model, and make the prediction.
from pyod.models.knn import KNN   # kNN detector

# train kNN detector
clf_name = 'KNN'
clf = KNN()
clf.fit(X_train)

# get the prediction label and outlier scores of the training data
y_train_pred = clf.labels_  # binary labels (0: inliers, 1: outliers)
y_train_scores = clf.decision_scores_  # raw outlier scores

# get the prediction on the test data
y_test_pred = clf.predict(X_test)  # outlier labels (0 or 1)
y_test_scores = clf.decision_function(X_test)  # outlier scores
Evaluate the prediction by ROC and Precision@rank n (p@n):
# evaluate and print the results
print("\nOn Training Data:")
evaluate_print(clf_name, y_train, y_train_scores)
print("\nOn Test Data:")
evaluate_print(clf_name, y_test, y_test_scores)
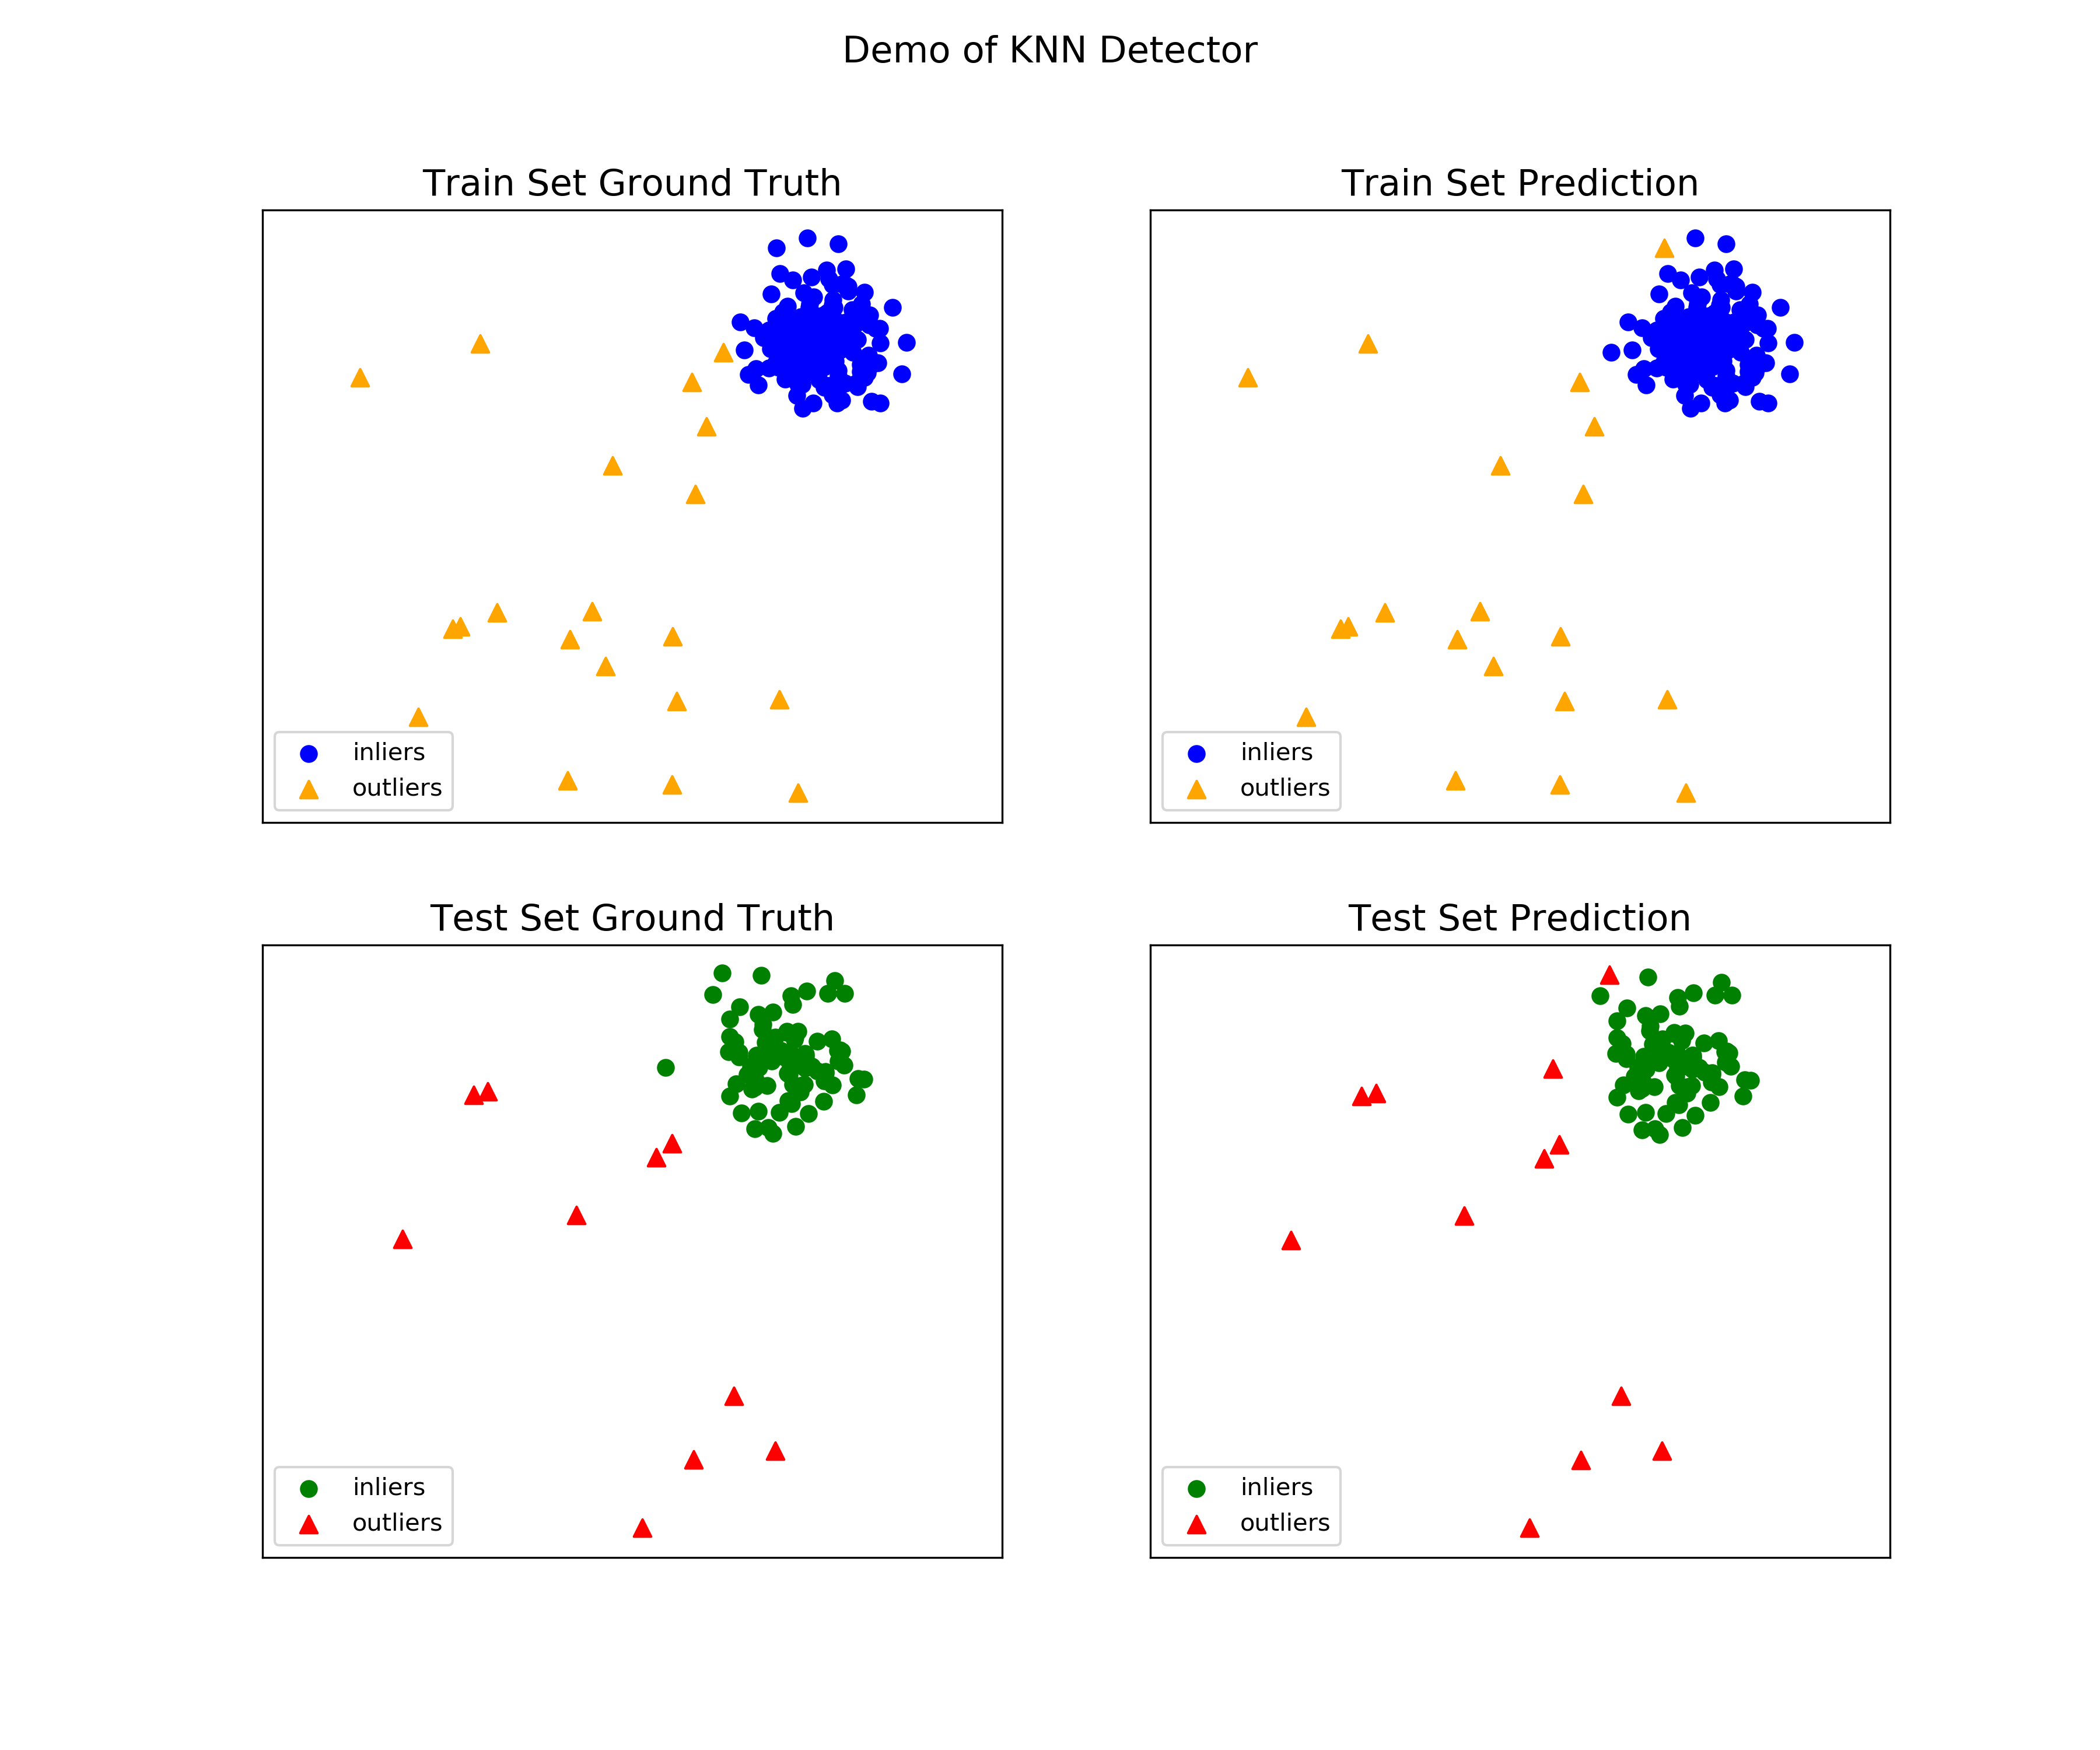
See a sample output & visualization
On Training Data:
KNN ROC:1.0, precision @ rank n:1.0

On Test Data:
KNN ROC:0.9989, precision @ rank n:0.9
visualize(clf_name, X_train, y_train, X_test, y_test, y_train_pred,
    y_test_pred, show_figure=True, save_figure=False)
Visualization (knn_figure):
Quick Start for Combining Outlier Scores from Various Base Detectors
"examples/comb_example.py" illustrates the APIs for combining multiple base detectors (comb_example.py, Jupyter Notebooks).
For Jupyter Notebooks, please navigate to "/notebooks/Model Combination.ipynb"
Given we have n individual outlier detectors, each of them generates an individual score for all samples. The task is to combine the outputs from these detectors effectively Key Step: conducting Z-score normalization on raw scores before the combination. Four combination mechanisms are shown in this demo:
- Average: take the average of all base detectors.
- maximization : take the maximum score across all detectors as the score.
- Average of Maximum (AOM): first randomly split n detectors in to p groups. For each group, use the maximum within the group as the group output. Use the average of all group outputs as the final output.
- Maximum of Average (MOA): similarly to AOM, the same grouping is introduced. However, we use the average of a group as the group output, and use maximum of all group outputs as the final output. To better understand the merging techniques, refer to [6].
The walkthrough of the code example is provided:
Import models and generate sample data
from pyod.models.knn import KNN
from pyod.models.combination import aom, moa, average, maximization
from pyod.utils.data import generate_data

X, y = generate_data(train_only=True)  # load data
First initialize 20 kNN outlier detectors with different k (10 to 200), and get the outlier scores:
# initialize 20 base detectors for combination
k_list = [10, 20, 30, 40, 50, 60, 70, 80, 90, 100, 110, 120, 130, 140,
            150, 160, 170, 180, 190, 200]

train_scores = np.zeros([X_train.shape[0], n_clf])
test_scores = np.zeros([X_test.shape[0], n_clf])

for i in range(n_clf):
    k = k_list[i]

    clf = KNN(n_neighbors=k, method='largest')
    clf.fit(X_train_norm)

    train_scores[:, i] = clf.decision_scores_
    test_scores[:, i] = clf.decision_function(X_test_norm)
Then the output codes are standardized into zero mean and unit variance before combination.
from pyod.utils.utility import standardizer
train_scores_norm, test_scores_norm = standardizer(train_scores, test_scores)
Then four different combination algorithms are applied as described above:
comb_by_average = average(test_scores_norm)
comb_by_maximization = maximization(test_scores_norm)
comb_by_aom = aom(test_scores_norm, 5) # 5 groups
comb_by_moa = moa(test_scores_norm, 5)) # 5 groups
Finally, all four combination methods are evaluated with ROC and Precision @ Rank n:
Combining 20 kNN detectors
Combination by Average ROC:0.9194, precision @ rank n:0.4531
Combination by Maximization ROC:0.9198, precision @ rank n:0.4688
Combination by AOM ROC:0.9257, precision @ rank n:0.4844
Combination by MOA ROC:0.9263, precision @ rank n:0.4688
How to Contribute and Collaborate
You are welcome to contribute to this exciting project, and we are preparing a manuscript at JMLR (Track for open-source software).
If you are interested in contributing:
- Please first check Issue lists for "help wanted" tag and comment the one you are interested
- Fork the repository and add your improvement/modification/fix
- Create a pull request
To make sure the code has the same style and standard, please refer to models, such as abod.py, hbos.py, or feature bagging for example.
You are also welcome to share your ideas by opening an issue or dropping me an email at [email protected] :)
Reference
| [1] | Aggarwal, C.C., 2015. Outlier analysis. In Data mining (pp. 237-263). Springer, Cham. |
| [2] | (1, 2, 3, 4, 5) Aggarwal, C.C. and Sathe, S., 2015. Theoretical foundations and algorithms for outlier ensembles.ACM SIGKDD Explorations Newsletter, 17(1), pp.24-47. |
| [3] | (1, 2) Angiulli, F. and Pizzuti, C., 2002, August. Fast outlier detection in high dimensional spaces. In European Conference on Principles of Data Mining and Knowledge Discovery pp. 15-27. |
| [4] | Breunig, M.M., Kriegel, H.P., Ng, R.T. and Sander, J., 2000, May. LOF: identifying density-based local outliers. ACM Sigmod Record, 29(2), pp. 93-104. |
| [5] | Goldstein, M. and Dengel, A., 2012. Histogram-based outlier score (hbos): A fast unsupervised anomaly detection algorithm. In KI-2012: Poster and Demo Track, pp.59-63. |
| [6] | Hardin, J. and Rocke, D.M., 2004. Outlier detection in the multiple cluster setting using the minimum covariance determinant estimator. Computational Statistics & Data Analysis, 44(4), pp.625-638. |
| [7] | He, Z., Xu, X. and Deng, S., 2003. Discovering cluster-based local outliers. Pattern Recognition Letters, 24(9-10), pp.1641-1650. |
| [8] | Janssens, J.H.M., Huszár, F., Postma, E.O. and van den Herik, H.J., 2012. Stochastic outlier selection. Technical report TiCC TR 2012-001, Tilburg University, Tilburg Center for Cognition and Communication, Tilburg, The Netherlands. |
| [9] | (1, 2) Kriegel, H.P. and Zimek, A., 2008, August. Angle-based outlier detection in high-dimensional data. In KDD '08, pp. 444-452. ACM. |
| [10] | Lazarevic, A. and Kumar, V., 2005, August. Feature bagging for outlier detection. In KDD '05. 2005. |
| [11] | Liu, F.T., Ting, K.M. and Zhou, Z.H., 2008, December. Isolation forest. In International Conference on Data Mining, pp. 413-422. IEEE. |
| [12] | Ma, J. and Perkins, S., 2003, July. Time-series novelty detection using one-class support vector machines. In IJCNN' 03, pp. 1741-1745. IEEE. |
| [13] | Papadimitriou, S., Kitagawa, H., Gibbons, P.B. and Faloutsos, C., 2003, March. LOCI: Fast outlier detection using the local correlation integral. In ICDE '03, pp. 315-326. IEEE. |
| [14] | Ramaswamy, S., Rastogi, R. and Shim, K., 2000, May. Efficient algorithms for mining outliers from large data sets. ACM Sigmod Record, 29(2), pp. 427-438). |
| [15] | Rousseeuw, P.J. and Driessen, K.V., 1999. A fast algorithm for the minimum covariance determinant estimator. Technometrics, 41(3), pp.212-223. |
| [16] | Shyu, M.L., Chen, S.C., Sarinnapakorn, K. and Chang, L., 2003. A novel anomaly detection scheme based on principal component classifier. MIAMI UNIV CORAL GABLES FL DEPT OF ELECTRICAL AND COMPUTER ENGINEERING. |
| [17] | Zhao, Y. and Hryniewicki, M.K. DCSO: Dynamic Combination of Detector Scores for Outlier Ensembles. ACM SIGKDD Workshop on Outlier Detection De-constructed (ODD v5.0), 2018. |
| [18] | Zhao, Y. and Hryniewicki, M.K. XGBOD: Improving Supervised Outlier Detection with Unsupervised Representation Learning. IEEE International Joint Conference on Neural Networks, 2018. |
| [19] | (1, 2) Zhao, Y., Hryniewicki, M.K., Nasrullah, Z., and Li, Z. LSCP: Locally Selective Combination of Parallel Outlier Ensembles. SIAM International Conference on Data Mining (SDM). Currently Under Review. |


