Describe the bug
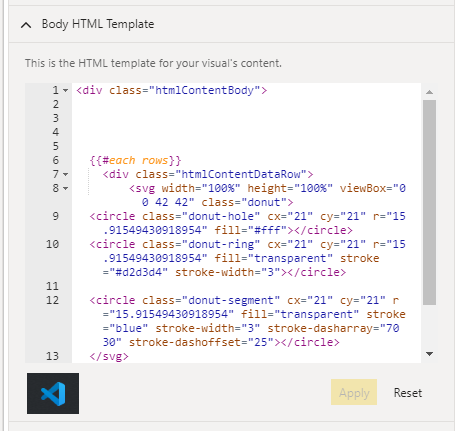
Power BI's Feb 22 release has degraded the functionality for the Measure-Based Stylesheet field. With Power BI's new format pane preview enabled (on by default), the field is displayed, but it will not accept a field from a query table. Existing visuals retain the CSS styling set prior to the Power BI update, but the field now behaves as a textbox. New instances of the HTML visual will only accept CSS content pasted into the Measure-Based Stylesheet field.
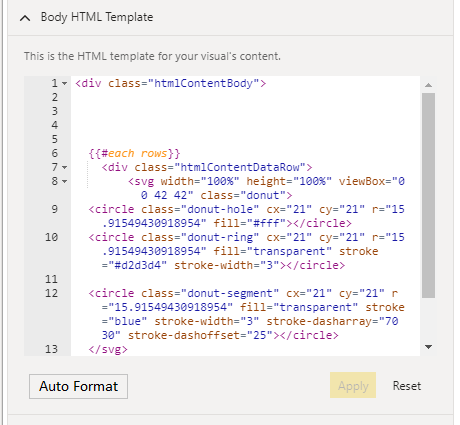
After turning off the new format pane preview in Power BI's settings, the Measure-Based Stylesheet field is no longer displayed. However, it does display an Advanced Controls link that enables the user to select a query field containing CSS content.
To summarize, with the new format pane preview enabled, CSS can only be applied by pasting literal CSS text into the textbox displayed in the Measure-Based Stylesheet field. Any CSS updates must be copy-pasted into every HTML visual manually.
If the new format pane preview is turned off, the visual is again functional, but the experience different than before the Power BI update.
To Reproduce
Steps to reproduce the behavior:
Power BI version must be Feb 22 update.
- Add a new HTML visual
- Add the HTML content field
- Attempt to add CSS content from a query table field.
- Measure based stylesheet field will not accept a query table field. It will only accept literal CSS text pasted into the field.
Expected behavior
The Measure based stylesheet field should accept a query table field that contains CSS content.
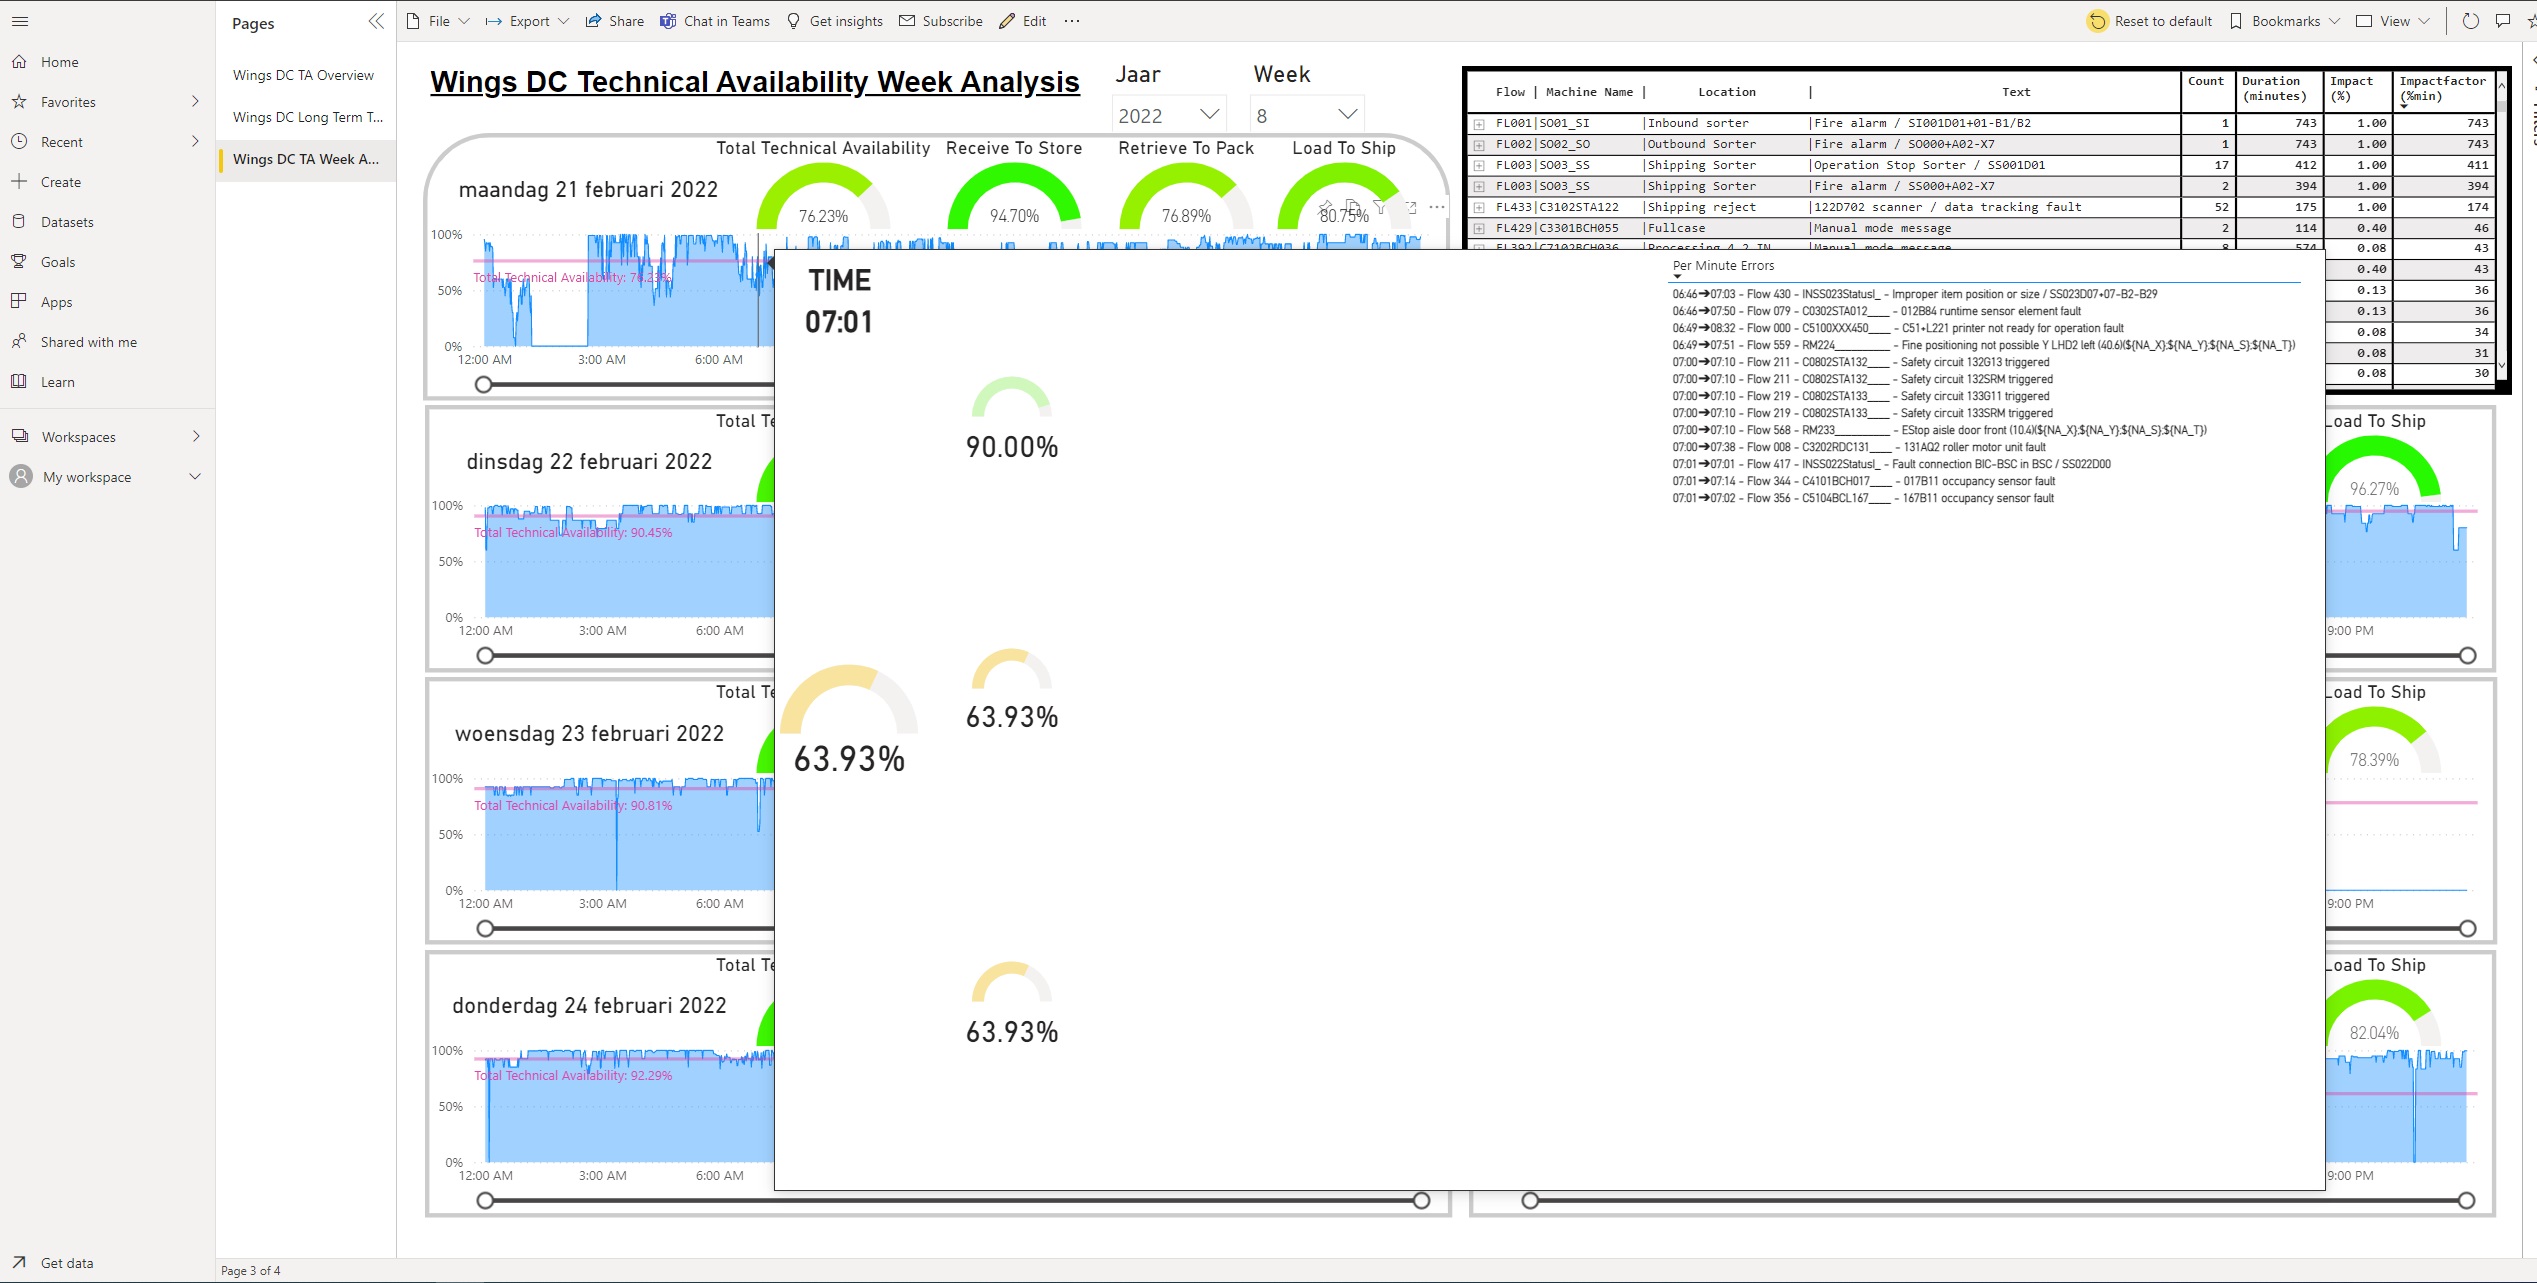
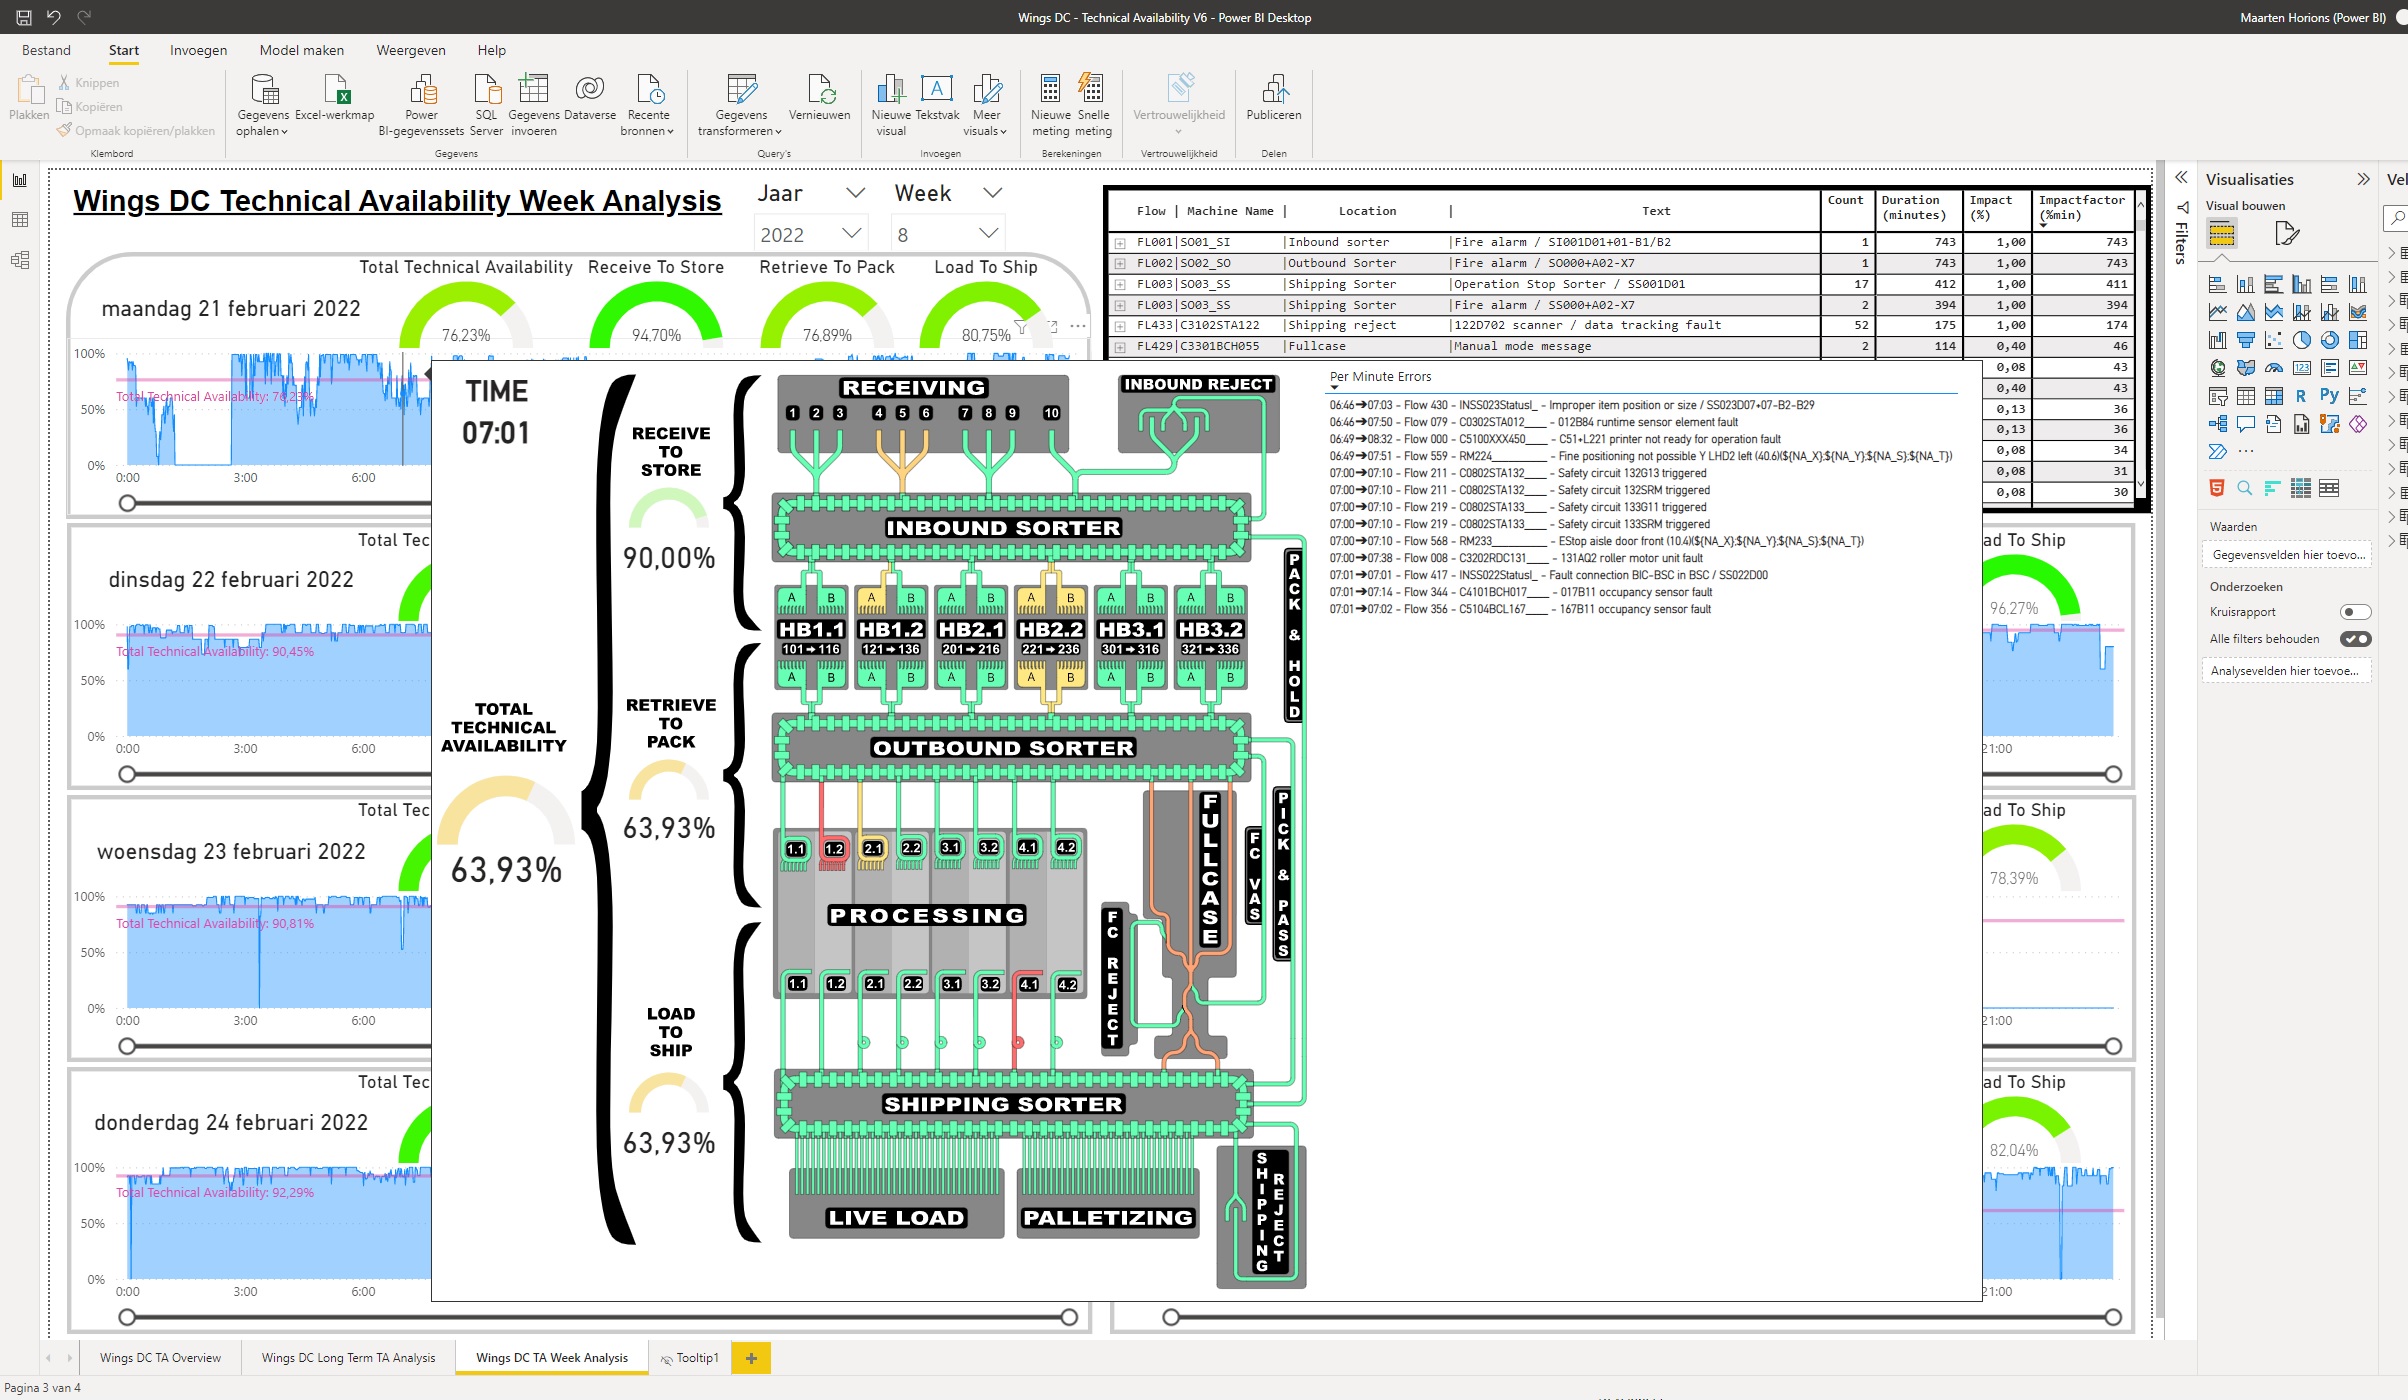
Screenshots/Workbook
If applicable, attach screenshots or a sample workbook with data suitable for public viewing to help explain your problem.
Power BI Setup (please complete the following information):
- Platform: Power BI Desktop
- OS: Windows 11
- Browser: Edge, but not applicable for desktop reason (I think).
- Version: 1.2.0.16 (HTML visual version, if that's what is expected here).
Visual Information (please complete the following information, available by right-clicking the visual in Power BI and selecting About):
- Version: 2.102.683.0 64-bit (February 2022)
Additional context
Add any other context about the problem here.

![dependabot[bot] avatar](https://avatars.githubusercontent.com/in/29110?v=4 "dependabot[bot]")