Coder Social home page Coder Social logo

Hi there πŸ‘‹

I am a Web Developer with expertise building data-rich web applications, creative visual interfaces and interactive business intelligence dashboards. My specialisation is in relationship mapping through network/graph visualization with D3.js, PIXI.js and Neo4j.

Know-how:

  • Designing and creating data viz, from simple chart types to custom high-density visuals, with Javascript/Python in either object oriented or functional paradigm
  • Creating React/Next.js or Svelte-based web applications from the ground up
  • Creating reusable and responsive UI layouts and components with CSS/Tailwind CSS/Chakra UI from existing Figma designs
  • Designing and creating network/graph visualizations with D3.js, PIXI.js
  • Neo4j set-up, graph modelling, data import, cypher querying
  • Handling complex data structures and creating data processing pipelines
  • Creating backend-for-frontend APIs with Node.js, Express or Flask
  • Postgresql database (Supabase) set-up, schema creation and querying
  • App deployment to platforms such as Vercel, Netlify, AWS.
  • App testing with Jest

Recent interest:

  • Generative AI: Knowledge graph construction from unstructured and structured documents with LangChain, LLM, OpenAI, Neo4j
  • Generative AI: Neo4j graph-based Retrieval-Augmented Generation (RAG) system, experimenting with various RAG techniques
  • Prompt engineering

Please reach out to me on Contra or Upwork if you are interested to hire me or work together on a project!


Diana's Projects

aurahealth-app icon aurahealth-app

Healthcare questionnaire & reporting platform to demonstrate multi-tenancy with Supabase in a Sveltekit application

fifa-viz icon fifa-viz

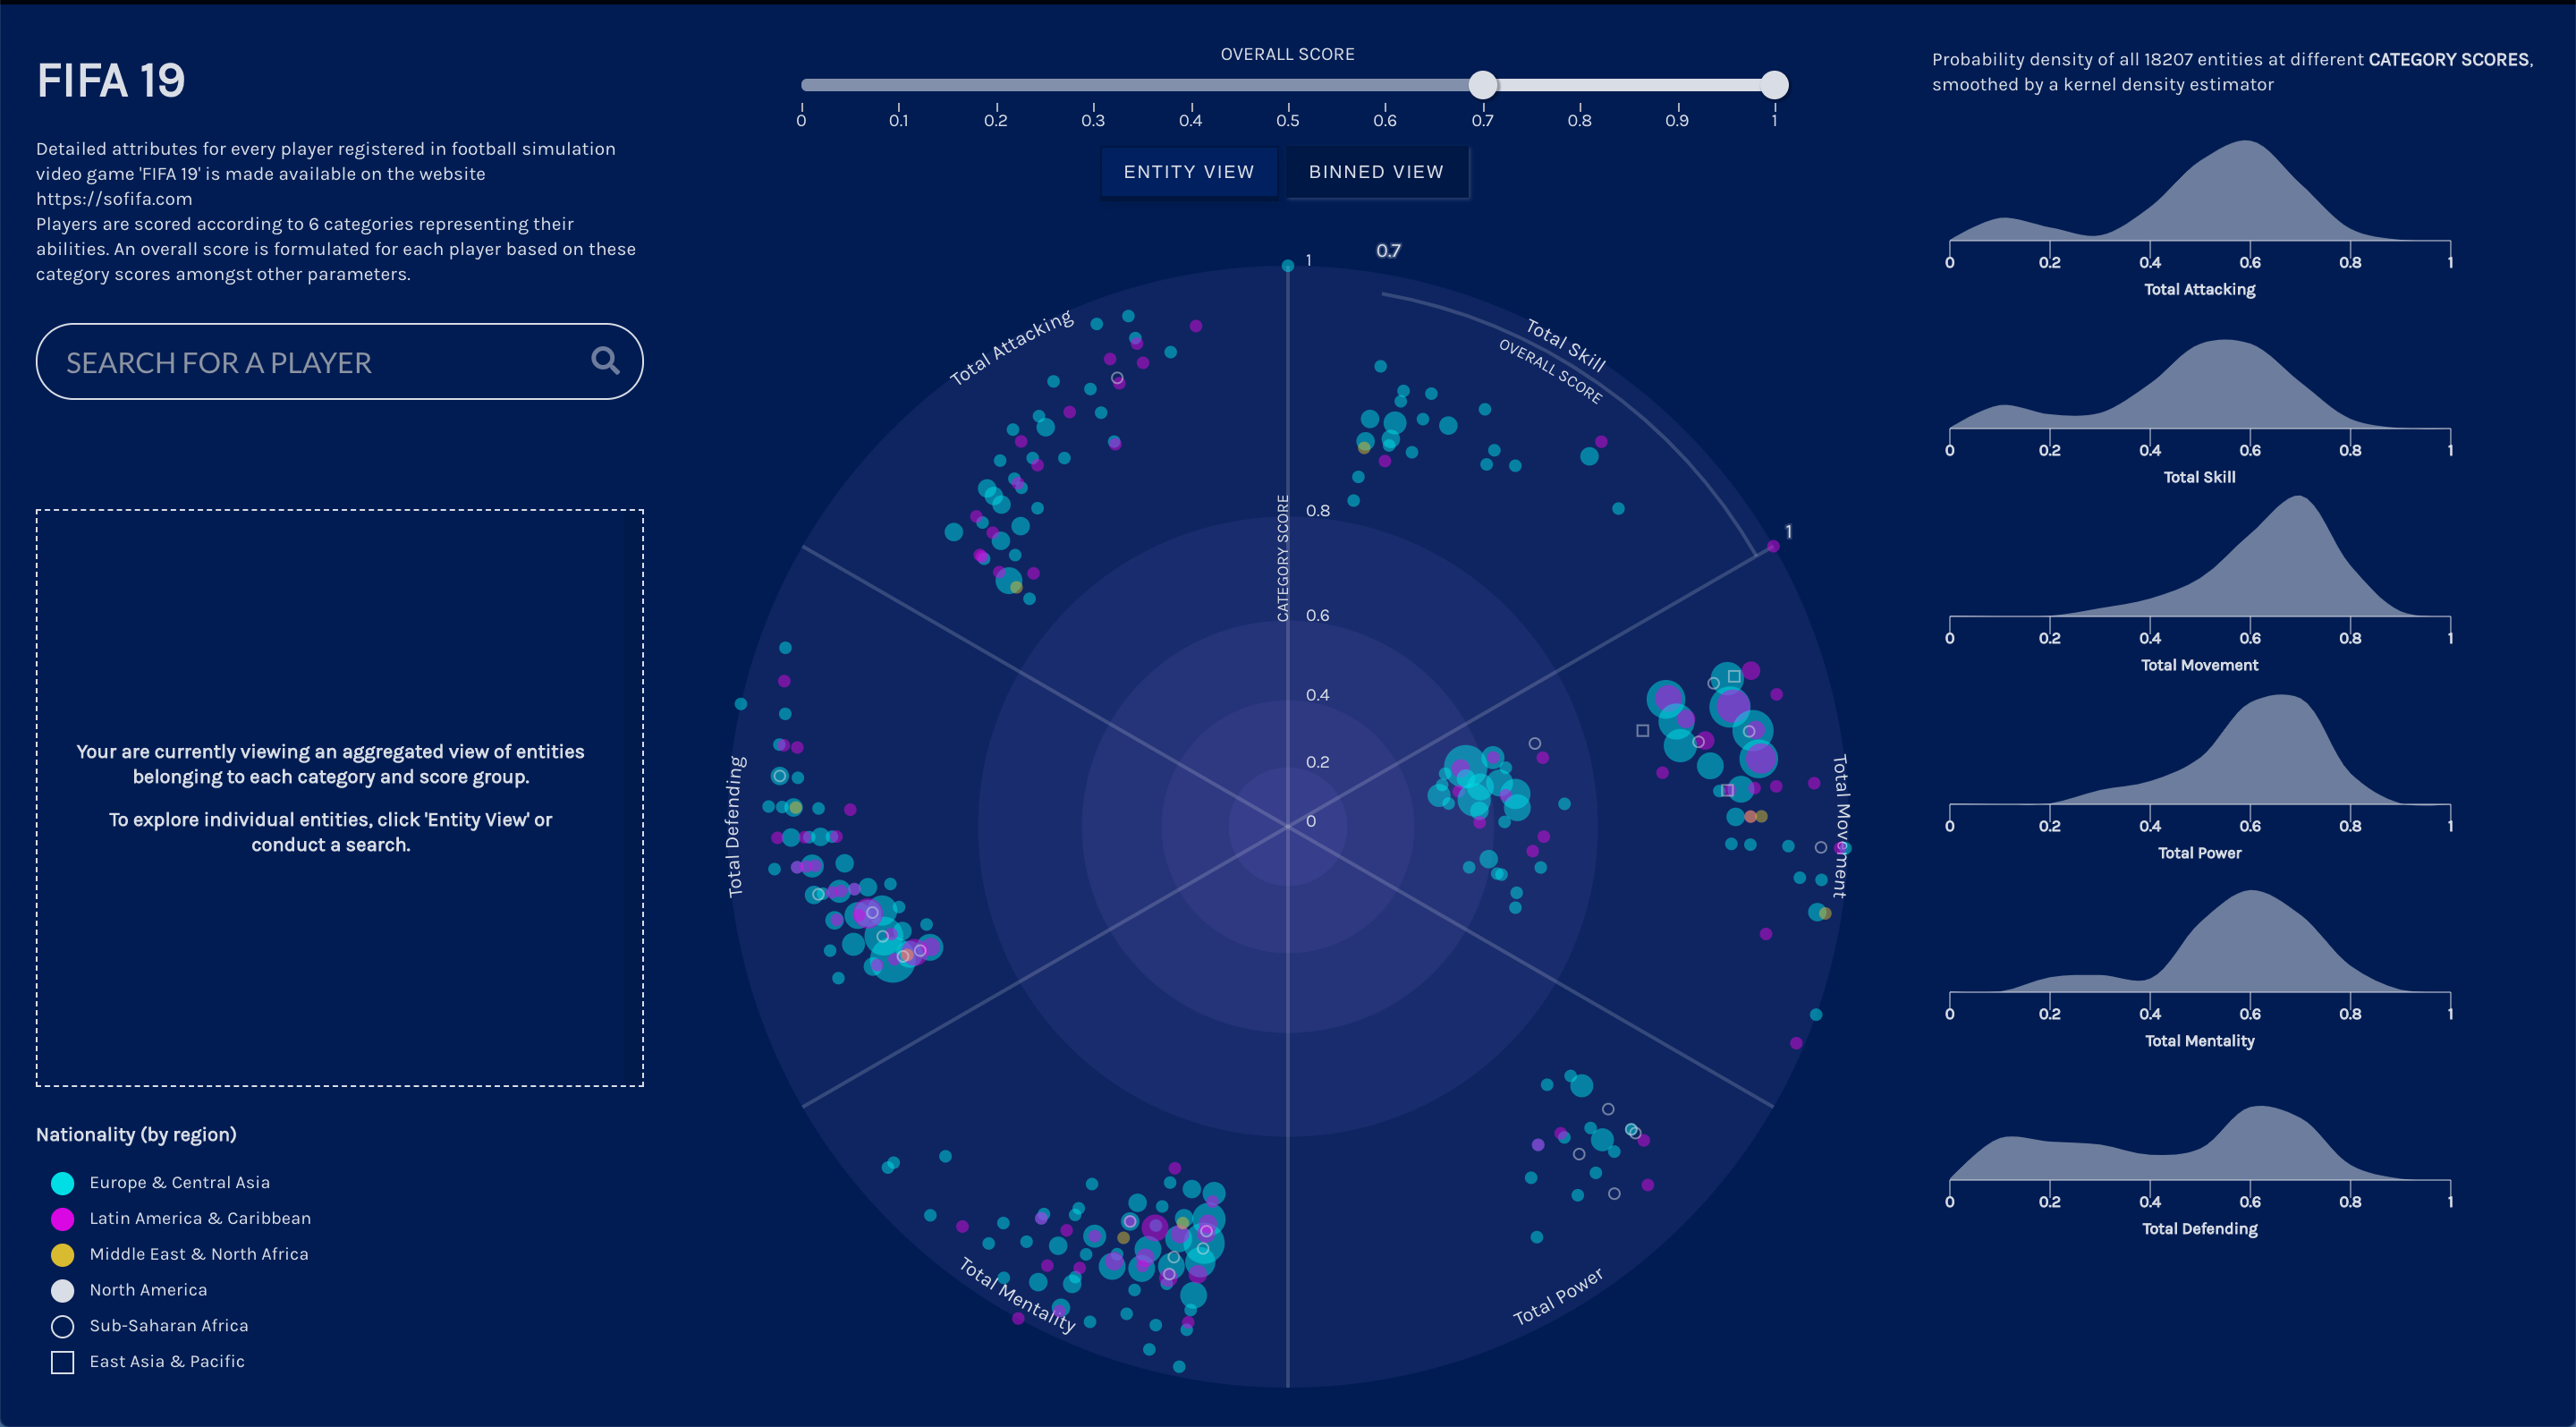
React/D3.js: Visualizing high-level score attributes and connections of players in the FIFA 19 game

fifa22-svelte icon fifa22-svelte

Svelte/D3.js: Visualizing club attributes in FIFA games from 2015 to 2022

flask-react-d3-celery icon flask-react-d3-celery

A full-stack dockerized web application to visualize Formula 1 race statistics from 2016 to present, with a Python Flask server and a React front-end with d3.js as data visualization tool.

graph-viz icon graph-viz

Graph/Network visualization library built with D3.js, with customizations

knowledge-graph-pdf icon knowledge-graph-pdf

This application lets you load multiple PDF documents to construct a Knowledge Graph and embed it into Neo4j so you can ask questions about its contents and have the LLM answer them using vector similarity search and graph traversal

knowledge_graph icon knowledge_graph

A web-based dashboard visualizing NLP results as a knowledge graph with D3.js

llm-neo4j-chatbot icon llm-neo4j-chatbot

This chatbot helps to recommend skincare products based on a user’s queries. Currently, this chatbot only has knowledge of 10 skincare products fed into a Neo4j.

monsta_fungus_viewer icon monsta_fungus_viewer

A gallery of hundreds of images of my generative artworks to showcase their possible traits and structures.

network-explorer icon network-explorer

A graph visualization tool built with React, Graphin, D3, and Ant Design

oop-knowledge-graph icon oop-knowledge-graph

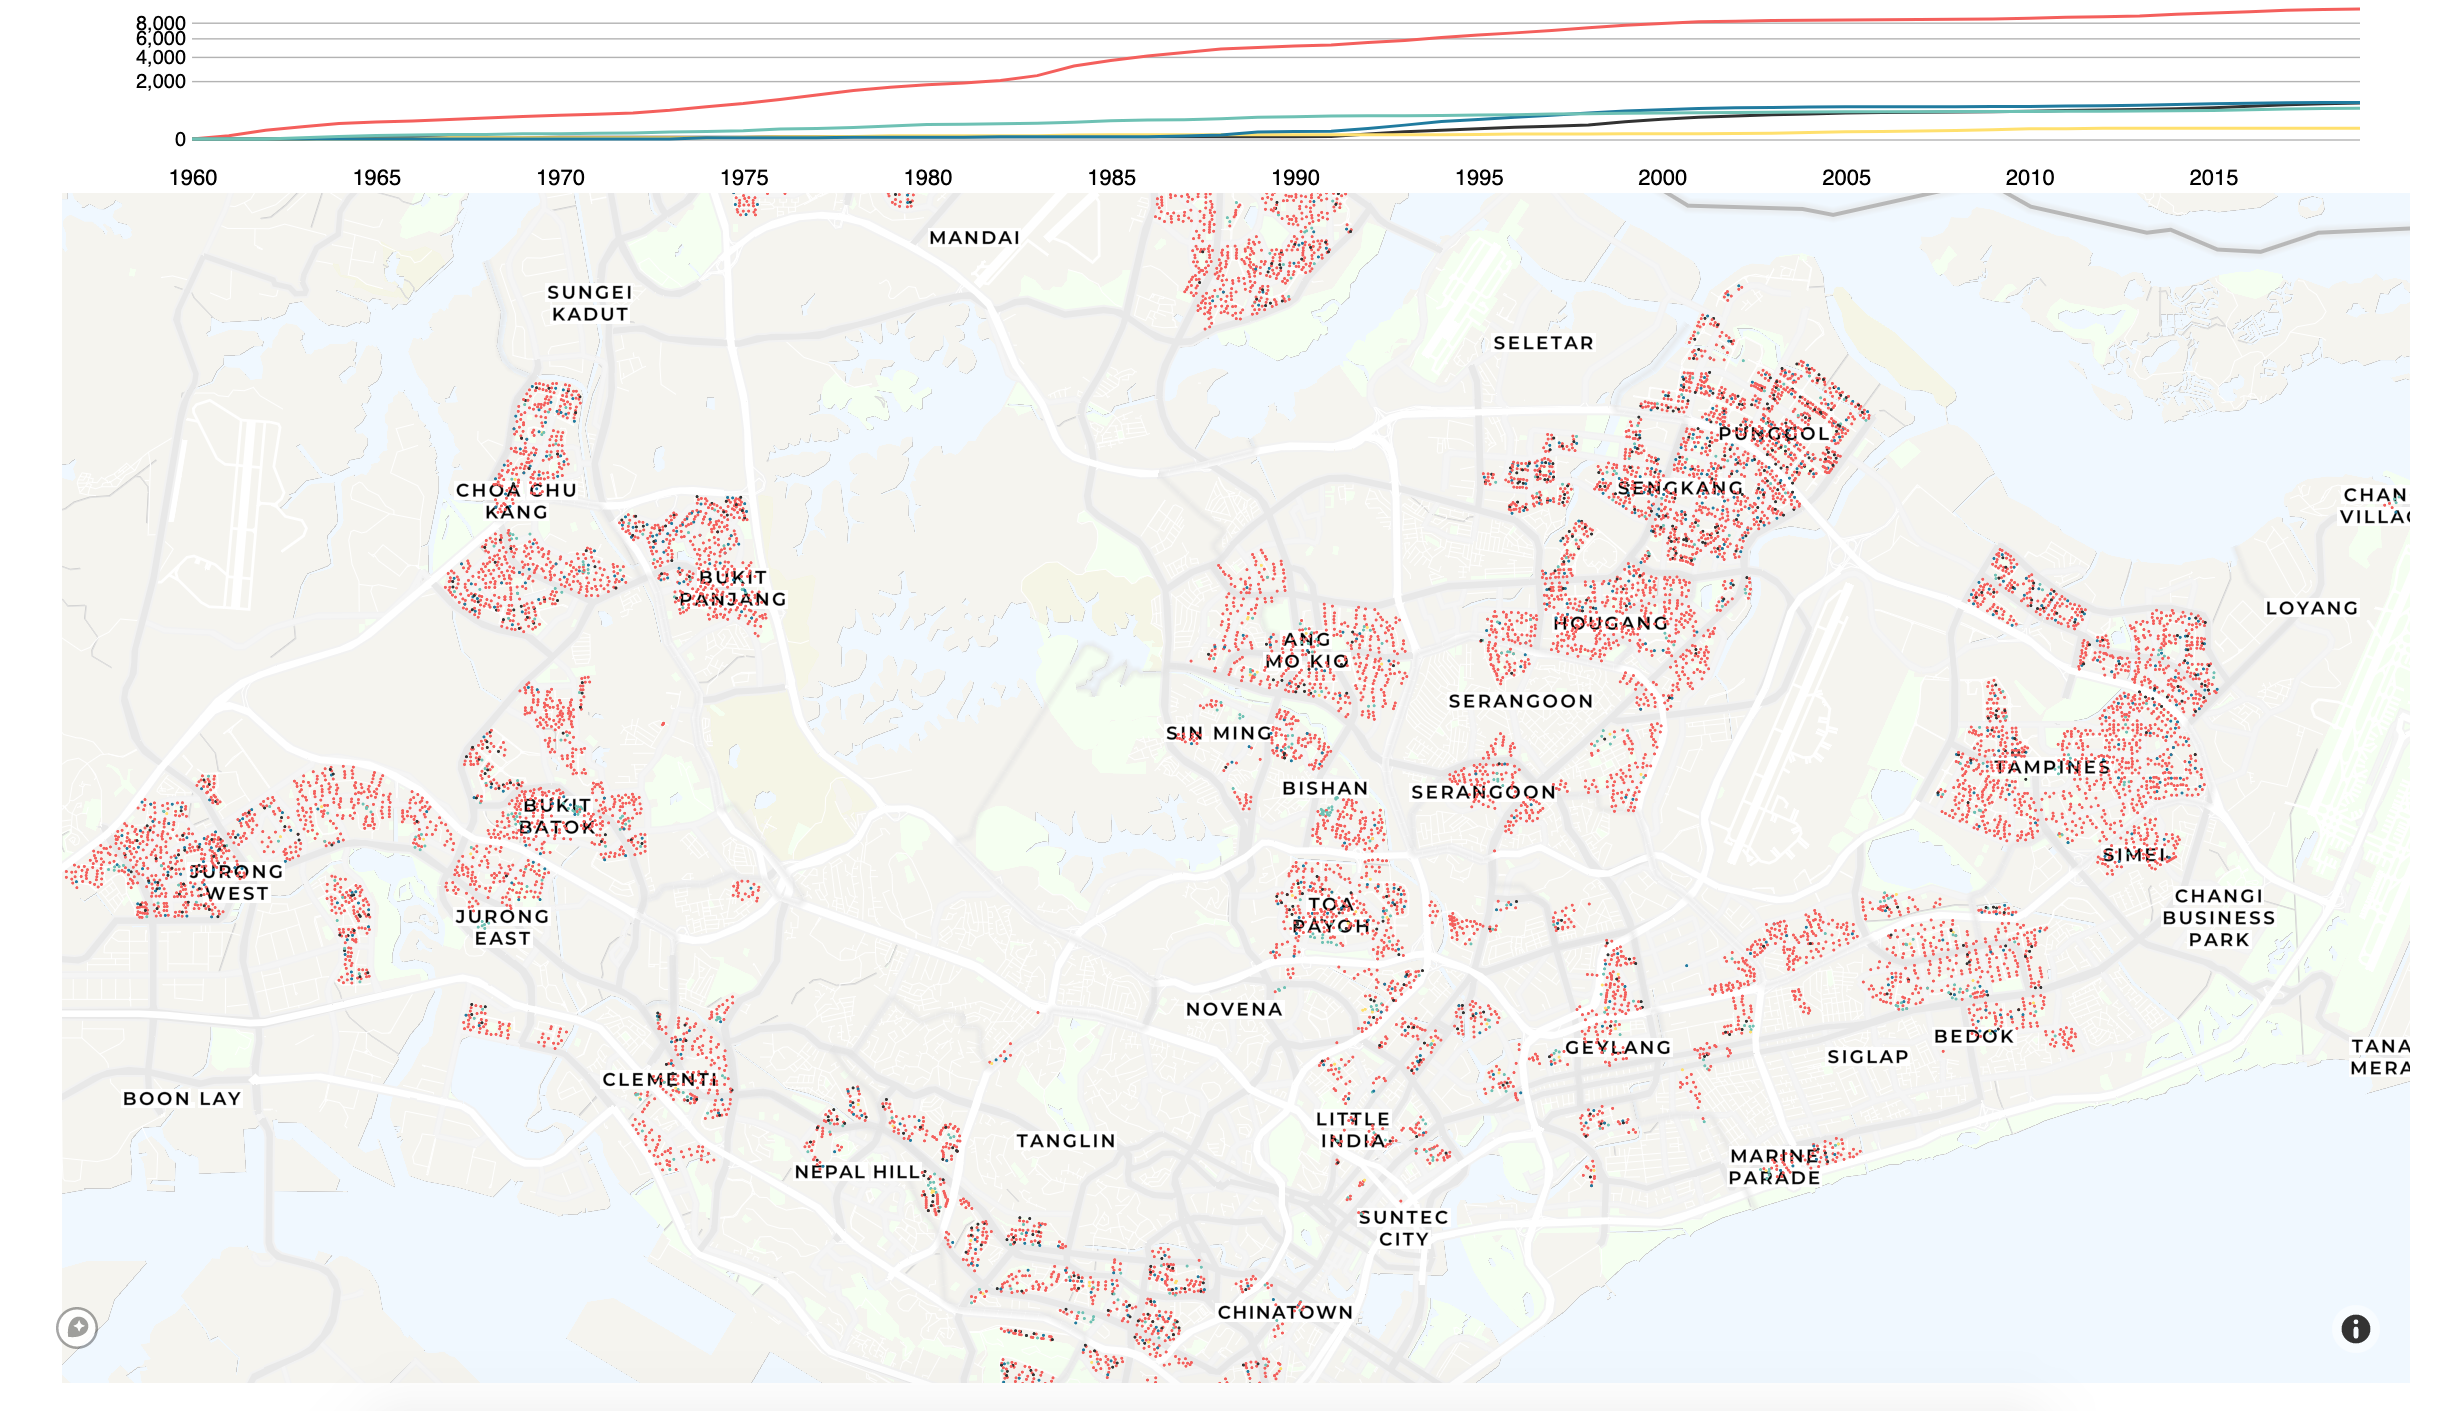
Visualizing hierarchical financial information of countries and companies as an interactive tree diagram. The interactive dashboard was built with Svelte and D3.js, in Object Oriented Programming style.

ploty-dash-fifa icon ploty-dash-fifa

Dash/Plotly (Python): Visualizing high-level score attributes and connections of players in the FIFA 22 game

Recommend Projects

  • React photo React

    A declarative, efficient, and flexible JavaScript library for building user interfaces.

  • Vue.js photo Vue.js

    πŸ–– Vue.js is a progressive, incrementally-adoptable JavaScript framework for building UI on the web.

  • Typescript photo Typescript

    TypeScript is a superset of JavaScript that compiles to clean JavaScript output.

  • TensorFlow photo TensorFlow

    An Open Source Machine Learning Framework for Everyone

  • Django photo Django

    The Web framework for perfectionists with deadlines.

  • D3 photo D3

    Bring data to life with SVG, Canvas and HTML. πŸ“ŠπŸ“ˆπŸŽ‰

Recommend Topics

  • javascript

    JavaScript (JS) is a lightweight interpreted programming language with first-class functions.

  • web

    Some thing interesting about web. New door for the world.

  • server

    A server is a program made to process requests and deliver data to clients.

  • Machine learning

    Machine learning is a way of modeling and interpreting data that allows a piece of software to respond intelligently.

  • Game

    Some thing interesting about game, make everyone happy.

Recommend Org

  • Facebook photo Facebook

    We are working to build community through open source technology. NB: members must have two-factor auth.

  • Microsoft photo Microsoft

    Open source projects and samples from Microsoft.

  • Google photo Google

    Google ❀️ Open Source for everyone.

  • D3 photo D3

    Data-Driven Documents codes.