Name: David Mozart Andraws
Email: [email protected]
University: Linnaeus University
PowerPoint: Smart-Store


Smart Store is a project that aims towards smartifying department stores, by monitoring air conditions and customer behaviour, of course while respecting their integrity. The smart store device can be installed in multiple sections in the store and once installed, data about air conditions and customer movement activity will be transmitted to the sigfox network and further on to ubidots and google cloud for real-time visualisation.
Estimated time: 10h
Table of Contents
- Smart Store
| Component | Task | Price | Link |
|---|---|---|---|
| LoPy4, exp-board & antenna | To power sensors and communicate with the sigfox backend | ~€60 | here |
| Breadboard | To help us connect our sensors to the lopy4 | ~€7 | here |
| BME680 Air Quality Sensor | Monitor Air Conditions | ~€28 | here |
| HC-SR501 PIR Movement Detection | To help us connect our sensors to the lopy4 | ~€5 | here |
| Resistor bundle with 1 Resistor 220 Ohms 1% | To power our led when movement is detected (Mostly for debugging purposes, thus not really necessary) | ~€12 | here |
| IoT Thing | Link |
|---|---|
| Sigfox-backend Account | Here |
| Ubidots account | Here |
| Google Cloud console | Here |
| Google Cloud functions | Here |
| Google Cloud pubsub | Here |
| Google Cloud bigquery | Here |
-
Chosen IDE Atom
-
How the code is uploaded From Atom with the PyMakr-plugin though a micro usb cable connected to the lopy4 expantion board
-
Steps that you needed to do for your computer. Installation of Node.js, extra drivers, etc.
- Update device firmware, more about that here.
- Create a project folder and open it with atom.
- Upload some example code e.g. RGB LED to test connectivity
- Circuit diagram (can be hand drawn)

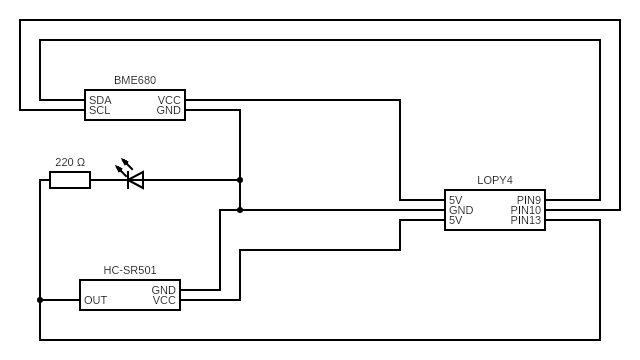 Circuit created with https://www.circuit-diagram.org/
- *Electrical calculations
N/A, see the Transmitting the data / connectivity section. Also, no sensor had an output larger than 3.3V, so no voltage devider was needed (lopy4 input pins only tolerate up to 3.3V as input).
Possible improvements
- Keep wifi disabled - Saves 12mA
- Remove the LED that the pir triggers - Saves ~20mA
This leaves:
- Pir - 65mA
- BME680 ~13mA (once/h, else ~0.15µA in sleep-mode)
So a 1200mAh battery would not be able to power this device more than ~2-3 weeks with the led removed and wifi disabled.
The platform of choice is cloud-based, to keep it as serverless as possible.
Used to receive data transmitted by the IOT device over their IOT network. Transmitted data looks like this:

The uplink payload is sent and represented in hexadecimal format. It is also limited to 12 bytes for uplink, e.g your data to sigfox can at max be 12 bytes, and to 8 bytes for downlink, excluding header size in both cases. Sigfox allows for a maximum of 120 uplink messages o be transmitted per day and 4 downlink messages per day. Read more.
More on how to connect your device to sigfox can be found here.
Used to get the payload (data) from sigfox, store it in a database and visiualize the data. The configuration is as following:
- Create a Pub/Sub topic in the google cloud platform
- Implement a callback function in sigfox to forward the data received by the device to google cloud platform.
- Implement a callback function in google cloud platform to receive the sigfox data (this callback function will publish the data to the Pub/Sub topic)
- Create a callback function to decode the payload (data) and store it in bigquery
Refer to the following tutorial for more detailed instructions
In a nutshell, the image below shows how everything is assembled together. (Ignore title in the first box and the title in the third box where it says Sens'it V3 Data Backend, the infrastructure can be used for any device, assuming the developer handles the decoding of the payload in the cloud function. the image is just to illustrate the infrastructure).

Used to visualize the data in a few easy steps. This is how:
- Create a ubidots account
- Create an ubifunction in your ubidots account
- Create a sigfox callback to ubidots in the sigfox-backend.
- Request a downlink from ubidots (At this point, your device is created)
- Create variables in ubidots
- Create a dashboard in ubidots choosing the variables created in the previous steps.
Refer to the following tutorial for more detailed instructions
- Explain and elaborate what made you choose this platform
To quickly visualize my data, i chose to go with the Sigfox+ubidots configuration as it requires fewer steps and less time.
Once done, i began exploring other cloud platforms and chose to go with Google Cloud since it seemed to offer a large number of functionalies, including database solutions.
This is how main.py looks like. The complete repository can be found in my github repository here. (Exluded it for convenience)
import time
import _thread
from lib.bme import BME
import struct
from lib.pir import PIR
from network import Sigfox
import socket

# init Sigfox for RCZ1 (Europe)
sigfox = Sigfox(mode=Sigfox.SIGFOX, rcz=Sigfox.RCZ1)

# create a Sigfox socket
s = socket.socket(socket.AF_SIGFOX, socket.SOCK_RAW)

# make the socket blocking
s.setblocking(True)

# configure it as uplink (Disabled downlink for now)
s.setsockopt(socket.SOL_SIGFOX, socket.SO_RX, False)

# PIR (Output to pin 13 (G5))
pir = PIR('G5')

"""
The run_pir() basically runs the sensor and keeps track of how
many time the sensor is triggered by incrementing a variable by 1.
This variable is set back to 0 each time the get_count_last_h() method is called.
This way, each time get_count_last_h() is called, it will return the number of
detections since last time this method was called.
"""
_thread.start_new_thread(pir.run_pir, ())

# BME680 (Output to Pin 9 and 10 (G16 and G17))
bme = BME(('P9', 'P10'))

while True:
    # Get the movement count since last time (Currently once / hour)
    count_last_hour = pir.get_count_last_h()

    # Get air condition values
    temp, humidity, pressure, air_quality = bme.get_values()

    # Print all
    print(temp, humidity, pressure, air_quality, count_last_hour)


    """
    Prepare the data by packing it before sending it to sigfox
    Payload format is: >bb BB HHHH HHHH HHHH where
    b = Temperature         (1 byte,  8 bits,  signed)       Range: -128 to 127
    B = Humidity            (1 byte,  8 bits,  unsigned)     Range: 0 to 255
    H = Pressure            (2 bytes, 16 bits, unsigned)     Range: 0 to 65,535
    H = Air Quality         (2 bytes, 16 bits, unsigned)     Range: 0 to 65,535
    H = Movement last hour  (2 bytes, 16 bits, unsigned)     Range: 0 to 65,535
    """
    package = struct.pack('>bBHBI',
                            int(temp),
                            int(humidity),
                            int(pressure),
                            int(air_quality),
                            int(count_last_hour))

    # Send the data to sigfox backend
    s.send(package)

    """
    Sleep for 60 minutes
    Pir is running on its own thread, and continues to do so while
    this thread sleeps.
    """
time.sleep(3600)How is the data transmitted to the internet? Describe the package format. All the different steps that are needed in getting the data to your end point. Explain both the code and choice of wireless protocols
- How often is the data sent?
- Once per hour
- Which wireless protocols did you use (WiFi, LoRa, etc ...)?
- Sigfox Radio Network
- Which transport protocols were used (MQTT, webhook, etc ...)
- Sigfox - Ubidots: HTTP
- Sigfox - Google Cloud: HTTP
- *Explain how much data is sent every day.
The Device transmitts data to Sigfox-backend every hour, which is 24 times per 24h. Each payload carries several sensor values and consists of a total of 8 bytes
The payload hexadecimal schema is: TTHHPPPPAAAAMMMM, where each character represents 1 byte, see table below.
| Value | Bytes | Range | Needed |
|---|---|---|---|
| Temperature (T) | 1 byte, signed | -128 to 127 | -40 to 85 (°C) |
| Humidity (H) | 1 byte, unsigned | 0 to 255 | 0 to 100 (% r.H.) |
| Pressure (H) | 2 bytes, unsigned | 0 to 65,535 | 300 to 1100 (hPa) |
| Air Quality (A) | 2 bytes, unsigned | 0 to 65,535 | 0 to 500 (IAQ) |
| Movement (M) | 2 bytes, unsigned | 0 to 65,535 | 0 to 600 (detections / h MAX) |
The size of each field is chosen with consultation from the component datasheet.
So in total, there are 8 bytes being trasmitted from the device every hour, excluding the datapacket header size. The effective payload size, exluding header size, each day is 8x24 = 192 bytes.
Example: The device sends the following data: 1b2803f1006300dc Temperature: 0x1b = 27 in decimal Humidity: 0x28 = 40 in decimal Pressure: 0x03f1 = 1009 in decimal Air Quality: 0x0063 = 99 in decimal Movement: 0x00dc = 220 in decimal
It is also possible to further encode the data but shrinking it with a factor, but at the cost of losing resolution.
For uplink messages, sigfox has pre-defined payload lengths of 1, 4, 8 and 12 bytes. If the data being sent is 5 bytes, then 3 additional bytes of padding are added to the payload, to "fill the free space". This device has support for 5 additional bytes that could be used if upgraded with additional sensors in the future.
*Elaborate on the designb choices. That is how your choices affect the device range and battery consumption For these type of devices, that never sleeps, power consumption is high, as they actively listen for input. Therefore, I decided to just power it with a 5V micro-usb.
- Provide visual examples on how the dashboard looks. Pictures needed.


- How often is data saved in the database
The data transmitted by the device every hour is saved in a bigQuery table forever, e.g. no expiry date. This could be set up, if needed.
- *Explain your choice of database.
I chose bigQuery as it is designed to scale and stream data analytics in real-time and because it is serverless. It is also fast and provides an option to share stored data to other applications, e.g. to the A.I platform or to grafana (via the BigQuery-plugin) to visualize the data.
It is free of charge for the first 1TB of data processed each month. Stream-inserts (When our callback receives the data from sigfox-backend, decode it and insert it to bigquery) costs $0.01 per 200MB, which is very cheap.
This means that years/months/days old data can be reviewed and compared to current data or simply data from 2 date intervals can compared together.
- *Automation/triggers of the data
Sigfox:
- Callback 1 (UPLINK) - Once sigfox-backend receives a message from the device, a callback function is triggered and forwards the data to ubidots.
- Callback 2 (BIDIR) - Once sigfox-backend receives a message from the device, a callback function is triggered and forwards the data to google cloud.

Ubitdots
- Receives and decode the payload and store the values in the created variables

Google Cloud
- Callback-data - Receives the data from the sigfox-backend callback and pushes the data to the Pub/Sub topic.
- pubsub-iot-decode - Is triggered when the Pub/Sub topic received new data and fetches it, decodes it and inserts the different values in a BigQuery table.

This couse was very educational, with a balanced mix of theory and experiential learning. The lectures were interactive and there were a decent number of workshops with skilled and helpful teaching assistants.
This project gave me a clearer insight into commercial systems are created. It also revealed some hidden aspects that has to be dealt with when developing such systems, e.g. minimize payload, minimize power consumption, maximize reliability & usability and following IOT-standards by using recommended transport protocols, such as MQTT etc..
While there is only one device presented in this project, the main idea is to have several devices monitoring a store section each. That is easily done by just connecting more devices to Sigfox-backend using existing callbacks.
- Show final results of the project


