Flask Charts via Flask-RestX
Sample project crafted with Flask, Flask-RestX and Charts.JS - provided by
AppSeed
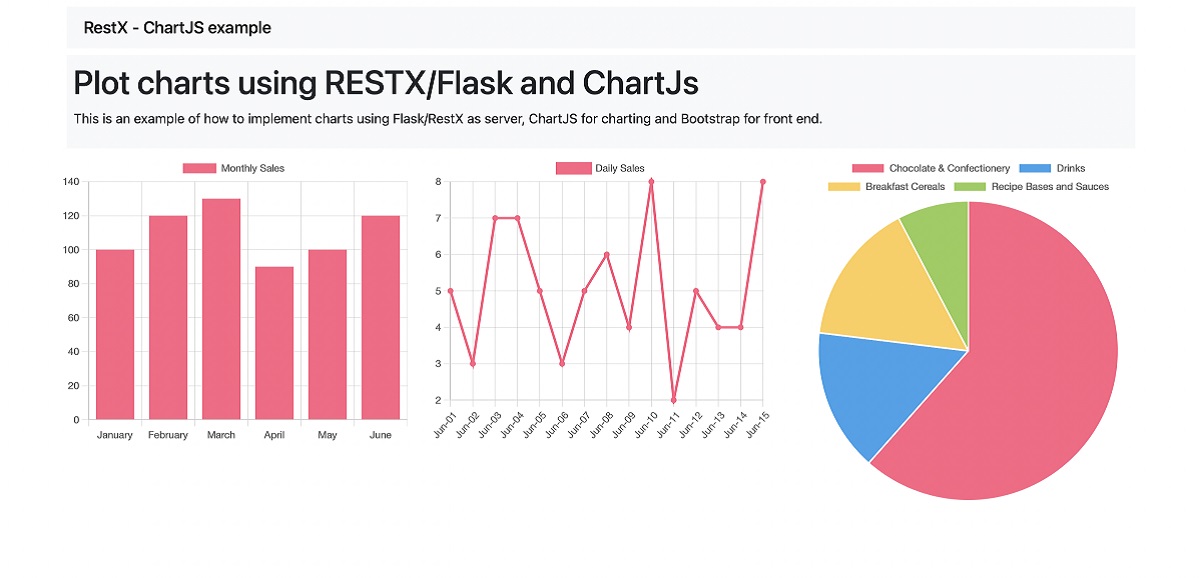
This is a sample code to showcase how to plot charts using Flask as the backend framework. Frontend uses Bootstrap5 for styling and Chart.js for dynamic charts. The dataset is loaded via a custom Flask CLI and the project homepage showcases three charts type: line, bar and pie.
👉 Charts via Flask-RestX - LIVE Demo👉 Free support viaemailand Discord.
Features:
Up-to-date dependenciesStack: FlaskAPI: Flask-RestXDB Tools: Flask-SqlAlchemy, SQLiteCharts: Charts.js
✨ How to use it
👉 Clone Sources (this repo)
$ git clone https://github.com/app-generator/blog-sample-flask-charts.git
$ cd blog-sample-flask-charts
👉 Install Modules using a Virtual Environment
$ virtualenv env
$ source env/bin/activate
$ pip3 install -r requirements.txt
Or for Windows-based Systems
$ virtualenv env
$ .\env\Scripts\activate
$
$ # Install modules - SQLite Database
$ pip3 install -r requirements.txt
👉 Set up the environment
$ export FLASK_APP=app.py
$ export FLASK_ENV=development
Or for Windows-based Systems
$ # CMD terminal
$ set FLASK_APP=app.py
$ set FLASK_ENV=development
$
$ # Powershell
$ $env:FLASK_APP = ".\app.py"
$ $env:FLASK_ENV = "development"
👉 Load Sample Data fromdatadirectory
monthly_customers.csvmonthly_sales.csvproduct_sales.csv
$ flask load-data
👉 Start the APP
$ flask run ✨ Code-base structure
< PROJECT ROOT >
   |
   |-- app.py            # Create and start the APP object
   |-- api.py            # Simple API node
   |-- models.py         # app models
   |
   |-- data_loader.py    # Save the data in DB
   |
   |-- templates
   |    |-- index.html   # Simple page styled with BS5
   |
   |-- static
   |    |-- js/custom.js # Code the Charts
   |
   |-- *******************
The bootstrap flow
app.py- bundles all resources
- serve the
index.html
api.pyexposes a simple API using the DB datatemplates/index.html- HOMEpage of the project
js/custom.js- fetch data exposed by the
API
- fetch data exposed by the
Flask Charts via Flask-RestX - provided by AppSeed


