Coder Social home page Coder Social logo

datavisyn / chartjs-chart-box-and-violin-plot Goto Github PK

View Code? Open in Web Editor NEW
107.0 6.0 34.0 913 KB

Chart.js Box Plot addon

License: BSD 3-Clause "New" or "Revised" License

JavaScript 100.00%
chartjs boxplot chart javascript violin-plot charting-boxplots

chartjs-chart-box-and-violin-plot's Introduction

DEPRECATED: Chart.js Box and Violin Plot

Target Discovery Platform NPM Package CircleCI

Chart.js module for charting box and violin plots. Works only with Chart.js >= 2.8.0

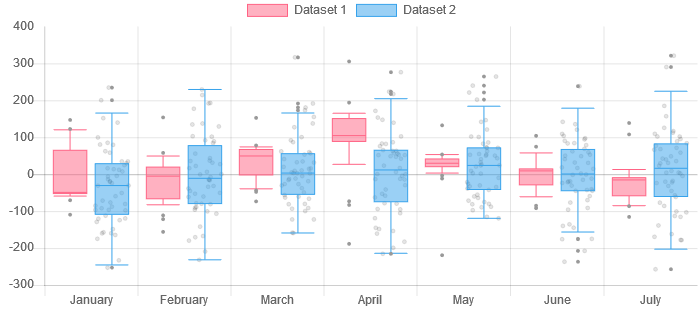
Box Plot Violin Plot

DEPRECATION Information

Please note that this project has been archived and is no longer being maintained. There is an active fork https://github.com/sgratzl/chartjs-chart-boxplot and we will also contribute our future changes to it.

Install

npm install --save chart.js chartjs-chart-box-and-violin-plot

Usage

see Samples on Github

and CodePen

Chart

four new types: boxplot, horizontalBoxplot, violin, and horizontalViolin.

Config

/**
 * Limit decimal digits by an optional config option
 **/
  tooltipDecimals?: number;

Styling

The boxplot element is called boxandwhiskers. The basic options are from the rectangle element. The violin element is called violin also based on the rectangle element.

interface IBaseStyling {
  /**
   * @default see rectangle
   * @scriptable
   * @indexable
   */
  backgroundColor: string;

  /**
   * @default see rectangle
   * @scriptable
   * @indexable
   */
  borderColor: string;

  /**
   * @default null takes the current borderColor
   * @scriptable
   * @indexable
   */
  medianColor: string;

  /**
   * @default 1
   * @scriptable
   * @indexable
   */
  borderWidth: number;

  /**
   * radius used to render outliers
   * @default 2
   * @scriptable
   * @indexable
   */
  outlierRadius: number;

  /**
   * @default see rectangle.backgroundColor
   * @scriptable
   * @indexable
   */
  outlierColor: string;

  /**
   * to fill color below the median line of the box
   * @default see rectangle.lowerColor
   * @scriptable
   * @indexable
   */
  lowerColor: string;

  /**
   * radius used to render items
   * @default 0 so disabled
   * @scriptable
   * @indexable
   */
  itemRadius: number;

  /**
   * item style used to render items
   * @default circle
   */
  itemStyle: 'circle'|'triangle'|'rect'|'rectRounded'|'rectRot'|'cross'|'crossRot'|'star'|'line'|'dash';

  /**
   * background color for items
   * @default see rectangle backgroundColor
   * @scriptable
   * @indexable
   */
  itemBackgroundColor: string;

  /**
   * border color for items
   * @default see rectangle backgroundColor
   * @scriptable
   * @indexable
   */
  itemBorderColor: string;

  /**
   * padding that is added around the bounding box when computing a mouse hit
   * @default 1
   * @scriptable
   * @indexable
   */
  hitPadding: number;

  /**
   * hit radius for hit test of outliers
   * @default 4
   * @scriptable
   * @indexable
   */
  outlierHitRadius: number;
}

interface IBoxPlotStyling extends IBaseStyling {
  // no extra styling options
}

interface IViolinStyling extends IBaseStyling {
  /**
  * number of sample points of the underlying KDE for creating the violin plot
  * @default 100
  */
  points: number;
}

In addition, two new scales were created arrayLinear and arrayLogarithmic. They were needed to adapt to the required data structure.

Scale Options

Both arrayLinear and arrayLogarithmic support the two additional options to their regular counterparts:

interface IArrayLinearScale {
  ticks: {
    /**
     * statistic measure that should be used for computing the minimal data limit
     * @default 'min'
     */
    minStats: 'min'|'q1'|'whiskerMin';

    /**
     * statistic measure that should be used for computing the maximal data limit
     * @default 'max'
     */
    maxStats: 'max'|'q3'|'whiskerMax';

    /**
     * from the R doc: this determines how far the plot ‘whiskers’ extend out from
     * the box. If coef is positive, the whiskers extend to the most extreme data
     * point which is no more than coef times the length of the box away from the
     * box. A value of zero causes the whiskers to extend to the data extremes
     * @default 1.5
     */
    coef: number;

    /**
     * the method to compute the quantiles. 7 and 'quantiles' refers to the type-7 method as used by R 'quantiles' method. 'hinges' and 'fivenum' refers to the method used by R 'boxplot.stats' method.
     * @default 7
     */
    quantiles: 7 | 'quantiles' | 'hinges' | 'fivenum' | ((sortedArr: number[]) => {min: number, q1: number, median: number, q3: number, max: number});
  };
}

Data structure

Both types support that the data is given as an array of numbers number[]. The statistics will be automatically computed. In addition, specific summary data structures are supported:

interface IBaseItem {
  min: number;
  median: number;
  max: number;
  /**
   * values of the raw items used for rendering jittered background points
   */
  items?: number[];
}

interface IBoxPlotItem extends IBaseItem {
  q1: number;
  q3: number;
  whiskerMin?: number;
  whiskerMax?: number;
  /**
   * list of box plot outlier values
   */
  outliers?: number[];
}

interface IKDESamplePoint {
  /**
   * sample value
   */
  v: number;
  /**
   * sample estimation
   */
  estimate: number;
}

interface IViolinItem extends IBaseItem {
  /**
   * samples of the underlying KDE
   */
  coords: IKDESamplePoint[];
}

Note: The statistics will be cached within the array. Thus, if you manipulate the array content without creating a new instance the changes won't be reflected in the stats. See also CodePen for a comparison.

Tooltips

In order to simplify the customization of the tooltips, two additional tooltip callback methods are available. Internally the label callback will call the correspondig callback depending on the type.

arr = {
  options: {
    tooltips: {
      callbacks: {
        /**
         * custom callback for boxplot tooltips
         * @param item see label callback
         * @param data see label callback
         * @param stats {IBoxPlotItem} the stats of the hovered element
         * @param hoveredOutlierIndex {number} the hovered outlier index or -1 if none
         * @return {string} see label callback
         */
        boxplotLabel: function(item, data, stats, hoveredOutlierIndex) {
          return 'Custom tooltip';
        },
        /**
         * custom callback for violin tooltips
         * @param item see label callback
         * @param data see label callback
         * @param stats {IViolinItem} the stats of the hovered element
         * @return {string} see label callback
         */
        violinLabel: function(item, data, stats) {
          return 'Custom tooltip';
        },
      }
    }
  }
}

Building

npm install
npm run build

Angular CLI Usage

Here is an example project based on Angular CLI with Angular 7 dependencies: https://github.com/sluger/ng-chartjs-boxplot

The incomaptibility with Webpack 4, mjs and Angular CLI can be solved by importing the chartjs boxplot library via the .js build artifact:

import "chartjs-chart-box-and-violin-plot/build/Chart.BoxPlot.js";

This repository is part of the Target Discovery Platform (TDP). For tutorials, API docs, and more information about the build and deployment process, see the documentation page.

chartjs-chart-box-and-violin-plot's People

Stargazers

 avatar  avatar  avatar  avatar  avatar  avatar  avatar  avatar  avatar  avatar  avatar  avatar  avatar  avatar  avatar  avatar  avatar  avatar  avatar  avatar  avatar  avatar  avatar  avatar  avatar  avatar  avatar  avatar  avatar  avatar  avatar  avatar  avatar  avatar  avatar  avatar  avatar  avatar  avatar  avatar  avatar  avatar  avatar  avatar  avatar  avatar  avatar  avatar  avatar  avatar  avatar  avatar  avatar  avatar  avatar  avatar  avatar  avatar  avatar  avatar  avatar  avatar  avatar  avatar  avatar  avatar  avatar  avatar  avatar  avatar  avatar  avatar  avatar  avatar  avatar  avatar  avatar  avatar  avatar  avatar  avatar  avatar  avatar  avatar  avatar  avatar  avatar  avatar  avatar  avatar  avatar  avatar  avatar  avatar  avatar  avatar  avatar  avatar  avatar  avatar

Watchers

 avatar  avatar  avatar  avatar  avatar  avatar

chartjs-chart-box-and-violin-plot's Issues

Control the width?

Is there a way to control the width of the box? I want a sleeker looking box.
Thanks.

Min=Max tooltip missing

Thanks for this very nice extension.

Ive got a data series where, for a given data point, min=max is a possibility. In such case, I see a single whisker and cannot get a tooltip to display when hovering over the whisker. It works fine for all the other data points in my series where min != max. Seems like I should at least be able to get a tooltip when hovering over any of my data points even when its a single whisker (min=max case).

If there is a workaround or a way to fix this, it'd be appreciated.

Thanks!

Aspect Ratio does not change plot

Updating the aspectRatio option of a box plot does not change the aspect ratio of the box plot, even with the maintainAspectRatio disabled. I've tested every combination of maintainAspectRatio and responsive, as well as adjusting the canvas holding the box plot, but all that winds up doing is stretching the box plot to the point where it becomes almost unreadable (see image below).

image

I feel like I'm just missing something but would like to open this anyway in case anybody else needs help with this.

Whiskers being drawn within area of Q1-Q3

With data with extreme outliers, I am finding a lot of times this chart style is drawing the whiskers above Q1 and below Q3. Is there a way to keep this from happening?
image

Cannot read property 'minBarLength' of undefined.

Hi everyone! Could you guide me on how to use this with reactjs.

in chart.js file

import React, { useEffect } from 'react';
import { Chart as Graph } from 'chart.js';
import 'chartjs-chart-box-and-violin-plot/build/Chart.BoxPlot.js';

export default React.memo(function Chart({ data, options, type }) {
    const chartRef = React.useRef(null);

    useEffect(() => {
        const { current } = chartRef;
        const chartContext = current.getContext('2d');

        new Graph(chartContext, {
            type,
            data,
            options,
        });
    }, [chartRef, data, options, type]);

    return (
        <>
            <canvas id={`${type}-graph`} ref={chartRef} className="Chart" />
        </>
    )})

In ChartBoxPlot.js file

import React from 'react';
import Chart from  './Chart';

const ChartBoxPlot = ({ data, options }) => {
    return (
          <div>
            <div className="Bar">
                <Chart data={data} options={options} type="boxplot" />
            </div>
        </div>);
};
export default ChartBoxPlot;`

This is what I get in the console

Cannot read property 'minBarLength' of undefined
TypeError: Cannot read property 'minBarLength' of undefined
    at ChartElement.calculateBarValuePixels (http://localhost:64876/vendors~main.88ed1bbe4abec7a73360.bundle.js:43171:30)
    at ChartElement._updateElementGeometry (http://localhost:64876/vendors~main.88ed1bbe4abec7a73360.bundle.js:43066:20)
    at ChartElement._updateElementGeometry (http://localhost:64876/vendors~main.88ed1bbe4abec7a73360.bundle.js:55359:62)
    at ChartElement.updateElement (http://localhost:64876/vendors~main.88ed1bbe4abec7a73360.bundle.js:43051:6)
    at ChartElement.updateElement (http://localhost:64876/vendors~main.88ed1bbe4abec7a73360.bundle.js:55236:53)
    at ChartElement.update (http://localhost:64876/vendors~main.88ed1bbe4abec7a73360.bundle.js:43024:7)
    at ChartElement._update (http://localhost:64876/vendors~main.88ed1bbe4abec7a73360.bundle.js:41960:6)
    at ChartElement.reset (http://localhost:64876/vendors~main.88ed1bbe4abec7a73360.bundle.js:41862:8)
    at http://localhost:64876/vendors~main.88ed1bbe4abec7a73360.bundle.js:47721:16
    at Object.each (http://localhost:64876/vendors~main.88ed1bbe4abec7a73360.bundle.js:40354:9)

Animated transitions?

Hi,

Thank you for this great add-in.

Is there support for animated transitions when updating the chart values, like in Chart.js? Or, is this on the roadmap?

Best wishes,

Dan

other chartjs chart not drawing on same page

i am using your script to draw a boxplot. on same same page, i am also using the original chart.js to draw a doughnut and line chart.

when both chart.min.js and your chart.bundle.js where loaded in the html page, only your boxplot chart are drawn but not the chart.js ones . is there potentially a conflict between those two.

i tried drawn other chartsbusing your chart.bundle.js but neither doughnut or line chat appear?

perhaps some mistake in my implementation?

Question about how to use interface

I'm trying to use an interface for box plot. I can't find any example for this. I created an array of objects which has the same attributes like q1 and q3 but it didn't draw the chart. Is there a sample that uses an interface?

interface IBoxPlotItem extends IBaseItem {
  q1: number;
  q3: number;
  whiskerMin?: number;
  whiskerMax?: number;
  /**
   * list of box plot outlier values
   */
  outliers?: number[];
}

Box plot not display correctly when data {min:0, q1:41, median:51, q3:63, max:99}

im new using boxplot chart js, when i filled data with value {min:0, q1:41, median:51, q3:63, max:99} min and max line didn't show up correctly.

function randomValues(count, min, max) {
const delta = max - min;
return Array.from({length: count}).map(() => Math.random() * delta + min);
}

const boxplotData = {
// define label tree
labels: ['data 1','data 2', 'data 3'],
datasets: [{
label: 'Dataset 1',
backgroundColor: 'rgba(255,0,0,0.5)',
borderColor: 'red',
borderWidth: 1,
outlierColor: '#e53636',
padding: 100,
itemRadius: 0,
data: [
{min:0, q1:41, median:51, q3:63, max:99},
[0, 25, 51, 75, 99]
]
}]
};
window.onload = () => {
const ctx = document.getElementById("canvas").getContext("2d");
window.myBar = new Chart(ctx, {
type: 'boxplot',
data: boxplotData,
options: {
responsive: true,
legend: {
position: 'top',
},
title: {
display: true,
text: 'Chart.js Box Plot Chart'
}
}
});

};

image

Data point alignment

When specific data points are plotted on the box chart they appear randomly across the width of the box chart area, opposed to horizontally centered to the box cart? Is there a way of forcing the individual data point plots to center?

The first sample chart on the readme page show this, the pink box chart has all the points aligned, while the blue are scatter? How do I get the points to align like the pink box chart?

Update: After looking at the boxplots vs boxplotsArray function in the util.js, the pink/red chart is only showing the outliers which are centered, but the other chart (blue) is showing all the data points which seem to be scattered (eg similar to the violin plot?), how do I either center them? or hide them?

Tooltip Label along with Mean, Median, Q1, Q3 Data

Please let me know how to add tooltip label with boxplot plugin in chart.js. I tried adding using below code example but mean, max, median, q1 and q3 values goes missing. Please suggest.


options: {
tooltips: {
callbacks: {
label: function (tooltipItems, data) {
return data.datasets[tooltipItems.datasetIndex].label + ': ' + data.datasets[tooltipItems.datasetIndex].data[tooltipItems.index] + ' €';
}
}

    }

Draw the chart without providing millions of data points

Hello,

As I understood from the examples, this addon needs the full list of points in order to draw the chart.
What if our dataset is huge and we already have Q1, Q2, Q3, mean and outliers and we want to draw the chart directly from these information?

Thank you!

Import error

I am trying to use this in my Vue.js project with vue-chartjs. Sadly, I receive this error:

Expand to see the error

 ERROR  Failed to compile with 52 errors                                                 1:06:34 PM

 error  in ./node_modules/chartjs-chart-box-and-violin-plot/build/Chart.BoxPlot.mjs

Can't import the named export 'Element' from non EcmaScript module (only default export is availabl
e)

 error  in ./node_modules/chartjs-chart-box-and-violin-plot/build/Chart.BoxPlot.mjs

Can't import the named export 'Element' from non EcmaScript module (only default export is availabl
e)

 error  in ./node_modules/chartjs-chart-box-and-violin-plot/build/Chart.BoxPlot.mjs

Can't import the named export 'Element' from non EcmaScript module (only default export is availabl
e)

 error  in ./node_modules/chartjs-chart-box-and-violin-plot/build/Chart.BoxPlot.mjs

Can't import the named export 'LinearScaleBase' from non EcmaScript module (only default export is 
available)

 error  in ./node_modules/chartjs-chart-box-and-violin-plot/build/Chart.BoxPlot.mjs

Can't import the named export 'LinearScaleBase' from non EcmaScript module (only default export is 
available)

 error  in ./node_modules/chartjs-chart-box-and-violin-plot/build/Chart.BoxPlot.mjs

Can't import the named export 'canvasHelpers' from non EcmaScript module (only default export is av
ailable)

 error  in ./node_modules/chartjs-chart-box-and-violin-plot/build/Chart.BoxPlot.mjs

Can't import the named export 'canvasHelpers' from non EcmaScript module (only default export is av
ailable)

 error  in ./node_modules/chartjs-chart-box-and-violin-plot/build/Chart.BoxPlot.mjs

Can't import the named export 'canvasHelpers' from non EcmaScript module (only default export is av
ailable)

 error  in ./node_modules/chartjs-chart-box-and-violin-plot/build/Chart.BoxPlot.mjs

Can't import the named export 'controllers' from non EcmaScript module (only default export is avai
lable)

 error  in ./node_modules/chartjs-chart-box-and-violin-plot/build/Chart.BoxPlot.mjs

Can't import the named export 'controllers' from non EcmaScript module (only default export is avai
lable)

 error  in ./node_modules/chartjs-chart-box-and-violin-plot/build/Chart.BoxPlot.mjs

Can't import the named export 'controllers' from non EcmaScript module (only default export is available)

 error  in ./node_modules/chartjs-chart-box-and-violin-plot/build/Chart.BoxPlot.mjs

Can't import the named export 'controllers' from non EcmaScript module (only default export is available)

 error  in ./node_modules/chartjs-chart-box-and-violin-plot/build/Chart.BoxPlot.mjs

Can't import the named export 'controllers' from non EcmaScript module (only default export is available)

 error  in ./node_modules/chartjs-chart-box-and-violin-plot/build/Chart.BoxPlot.mjs

Can't import the named export 'controllers' from non EcmaScript module (only default export is available)

 error  in ./node_modules/chartjs-chart-box-and-violin-plot/build/Chart.BoxPlot.mjs

Can't import the named export 'controllers' from non EcmaScript module (only default export is available)

 error  in ./node_modules/chartjs-chart-box-and-violin-plot/build/Chart.BoxPlot.mjs

Can't import the named export 'controllers' from non EcmaScript module (only default export is available)

 error  in ./node_modules/chartjs-chart-box-and-violin-plot/build/Chart.BoxPlot.mjs

Can't import the named export 'controllers' from non EcmaScript module (only default export is available)

 error  in ./node_modules/chartjs-chart-box-and-violin-plot/build/Chart.BoxPlot.mjs

Can't import the named export 'controllers' from non EcmaScript module (only default export is available)

 error  in ./node_modules/chartjs-chart-box-and-violin-plot/build/Chart.BoxPlot.mjs

Can't import the named export 'controllers' from non EcmaScript module (only default export is available)

 error  in ./node_modules/chartjs-chart-box-and-violin-plot/build/Chart.BoxPlot.mjs

Can't import the named export 'defaults' from non EcmaScript module (only default export is available)

 error  in ./node_modules/chartjs-chart-box-and-violin-plot/build/Chart.BoxPlot.mjs

Can't import the named export 'defaults' from non EcmaScript module (only default export is available)

 error  in ./node_modules/chartjs-chart-box-and-violin-plot/build/Chart.BoxPlot.mjs

Can't import the named export 'defaults' from non EcmaScript module (only default export is available)

 error  in ./node_modules/chartjs-chart-box-and-violin-plot/build/Chart.BoxPlot.mjs

Can't import the named export 'defaults' from non EcmaScript module (only default export is available)

 error  in ./node_modules/chartjs-chart-box-and-violin-plot/build/Chart.BoxPlot.mjs

Can't import the named export 'defaults' from non EcmaScript module (only default export is available)

 error  in ./node_modules/chartjs-chart-box-and-violin-plot/build/Chart.BoxPlot.mjs

Can't import the named export 'defaults' from non EcmaScript module (only default export is available)

 error  in ./node_modules/chartjs-chart-box-and-violin-plot/build/Chart.BoxPlot.mjs

Can't import the named export 'defaults' from non EcmaScript module (only default export is available)

 error  in ./node_modules/chartjs-chart-box-and-violin-plot/build/Chart.BoxPlot.mjs

Can't import the named export 'defaults' from non EcmaScript module (only default export is available)

 error  in ./node_modules/chartjs-chart-box-and-violin-plot/build/Chart.BoxPlot.mjs

Can't import the named export 'defaults' from non EcmaScript module (only default export is available)

 error  in ./node_modules/chartjs-chart-box-and-violin-plot/build/Chart.BoxPlot.mjs

Can't import the named export 'defaults' from non EcmaScript module (only default export is available)

 error  in ./node_modules/chartjs-chart-box-and-violin-plot/build/Chart.BoxPlot.mjs

Can't import the named export 'defaults' from non EcmaScript module (only default export is available)

 error  in ./node_modules/chartjs-chart-box-and-violin-plot/build/Chart.BoxPlot.mjs

Can't import the named export 'defaults' from non EcmaScript module (only default export is available)

 error  in ./node_modules/chartjs-chart-box-and-violin-plot/build/Chart.BoxPlot.mjs

Can't import the named export 'defaults' from non EcmaScript module (only default export is available)

 error  in ./node_modules/chartjs-chart-box-and-violin-plot/build/Chart.BoxPlot.mjs

Can't import the named export 'defaults' from non EcmaScript module (only default export is available)

 error  in ./node_modules/chartjs-chart-box-and-violin-plot/build/Chart.BoxPlot.mjs

Can't import the named export 'elements' from non EcmaScript module (only default export is available)

 error  in ./node_modules/chartjs-chart-box-and-violin-plot/build/Chart.BoxPlot.mjs

Can't import the named export 'elements' from non EcmaScript module (only default export is available)

 error  in ./node_modules/chartjs-chart-box-and-violin-plot/build/Chart.BoxPlot.mjs

Can't import the named export 'elements' from non EcmaScript module (only default export is available)

 error  in ./node_modules/chartjs-chart-box-and-violin-plot/build/Chart.BoxPlot.mjs

Can't import the named export 'elements' from non EcmaScript module (only default export is available)

 error  in ./node_modules/chartjs-chart-box-and-violin-plot/build/Chart.BoxPlot.mjs

Can't import the named export 'helpers' from non EcmaScript module (only default export is available)

 error  in ./node_modules/chartjs-chart-box-and-violin-plot/build/Chart.BoxPlot.mjs

Can't import the named export 'helpers' from non EcmaScript module (only default export is available)

 error  in ./node_modules/chartjs-chart-box-and-violin-plot/build/Chart.BoxPlot.mjs

Can't import the named export 'helpers' from non EcmaScript module (only default export is available)

 error  in ./node_modules/chartjs-chart-box-and-violin-plot/build/Chart.BoxPlot.mjs

Can't import the named export 'helpers' from non EcmaScript module (only default export is available)

 error  in ./node_modules/chartjs-chart-box-and-violin-plot/build/Chart.BoxPlot.mjs

Can't import the named export 'helpers' from non EcmaScript module (only default export is available)

 error  in ./node_modules/chartjs-chart-box-and-violin-plot/build/Chart.BoxPlot.mjs

Can't import the named export 'helpers' from non EcmaScript module (only default export is available)

 error  in ./node_modules/chartjs-chart-box-and-violin-plot/build/Chart.BoxPlot.mjs

Can't import the named export 'helpers' from non EcmaScript module (only default export is available)

 error  in ./node_modules/chartjs-chart-box-and-violin-plot/build/Chart.BoxPlot.mjs

Can't import the named export 'helpers' from non EcmaScript module (only default export is available)

 error  in ./node_modules/chartjs-chart-box-and-violin-plot/build/Chart.BoxPlot.mjs

Can't import the named export 'helpers' from non EcmaScript module (only default export is available)

 error  in ./node_modules/chartjs-chart-box-and-violin-plot/build/Chart.BoxPlot.mjs

Can't import the named export 'scaleService' from non EcmaScript module (only default export is available)

 error  in ./node_modules/chartjs-chart-box-and-violin-plot/build/Chart.BoxPlot.mjs

Can't import the named export 'scaleService' from non EcmaScript module (only default export is available)

 error  in ./node_modules/chartjs-chart-box-and-violin-plot/build/Chart.BoxPlot.mjs

Can't import the named export 'scaleService' from non EcmaScript module (only default export is available)

 error  in ./node_modules/chartjs-chart-box-and-violin-plot/build/Chart.BoxPlot.mjs

Can't import the named export 'scaleService' from non EcmaScript module (only default export is available)

 error  in ./node_modules/chartjs-chart-box-and-violin-plot/build/Chart.BoxPlot.mjs

Can't import the named export 'scaleService' from non EcmaScript module (only default export is available)

 error  in ./node_modules/chartjs-chart-box-and-violin-plot/build/Chart.BoxPlot.mjs

Can't import the named export 'scaleService' from non EcmaScript module (only default export is available)


Here is my chart component:

import 'chartjs-chart-box-and-violin-plot'
import { generateChart } from 'vue-chartjs'

export default generateChart('boxplot', 'boxplot')

Do you have any ideas about how to resolve this?

Wrong boxplot graph

So, I was using this data:

4.16666666666667,7.14285714285714,7.14285714285714,8.88888888888889,9.09090909090909,10,10,10,10.5263157894737,11.1111111111111,12.5,14.2857142857143,14.2857142857143,15.625,18.1818181818182,20,25,25,25,33.3333333333333,33.3333333333333,50,100,100,100,100

The tooltip is correct, but the graph is somewhat incorrect.
This is my code:

function randomValues(count, min, max) {
  //const delta = max - min;
  //return Array.from({length: count}).map(() => Math.random() * delta + min);
  var dataSet = [];
  dataSet = [4.16666666666667, 7.14285714285714, 7.14285714285714, 8.88888888888889, 9.09090909090909, 10.000000, 10.000000, 10.000000, 10.5263157894737, 11.1111111111111, 12.5, 14.2857142857143, 14.2857142857143, 15.625, 18.1818181818182, 20.000000, 25.000000, 25.000000, 25.000000, 33.3333333333333, 33.3333333333333, 50.000000, 100.000000, 100.000000, 100.000000, 100.000000];
  return dataSet.sort();
}
//console.log(randomValues(100, 0, 100));
const boxplotData = {
  // define label tree
  labels: ['January', 'February', 'March', 'April', 'May', 'June', 'July'],
  datasets: [{
    label: 'Dataset 1',
    backgroundColor: 'rgba(255,0,0,0.5)',
    borderColor: 'red',
    borderWidth: 1,
    outlierColor: '#999999',
    padding: 10,
    itemRadius: 0,
    data: [
      randomValues(100, 0, 100),
      randomValues(100, 0, 20),
      randomValues(100, 20, 70),
      randomValues(100, 60, 100),
      randomValues(40, 50, 100),
      randomValues(100, 60, 120),
      randomValues(100, 80, 100)
    ]
  }, {
    label: 'Dataset 2',
    backgroundColor:  'rgba(0,0,255,0.5)',
    borderColor: 'blue',
    borderWidth: 1,
    outlierColor: '#999999',
    padding: 10,
    itemRadius: 0,
    data: [
      randomValues(100, 60, 100),
      randomValues(100, 0, 100),
      randomValues(100, 0, 20),
      randomValues(100, 20, 70),
      randomValues(40, 60, 120),
      randomValues(100, 20, 100),
      randomValues(100, 80, 100)
    ]
  }]
};
window.onload = () => {
  const ctx = document.getElementById("canvas").getContext("2d");
  window.myBar = new Chart(ctx, {
    type: 'boxplot',
    data: boxplotData,
    options: {
      responsive: true,
      legend: {
        position: 'top',
      },
      title: {
        display: true,
        text: 'Chart.js Box Plot Chart'
      }
    }
  });
};

image

Could you please help me? Thanks before 💃

dots in boxplots shouldn't be covered by background color

There came up a generell issue with the chartjs boxplots library.
The dots of the boxplots aren't properly visible. We played around with the alpha value of the background color, but still it's not very nice.
Couldn't the dots be brought to the front of the boxplots?
In some cases with few samples we want to show the dots within the boxes. That is supported by the boxplot chartjs-lib and has already been implemented for some views. You can show the dots by the following setting (see also the code snippet above).
itemRadius: 3, // render items

BoxPlot.update() not working properly

hy,
first of all, great work!
The initial Drawing Looks good but,I run into one Problem, the BoxPot wont refresh after adding new values to it and Calling the ChartJs myChart.update() function. It just leaves a blank Chart without a boxplot (and not throwing any error either)

any ideas, what i can do?

Kind Regards.

Boxplot/Violin type is not recognized

Hi! I'm trying to paint a Boxplot chart but I got this error:

error

I'm using an Angular 5 project. I have built Chart.BoxPlot.js previously and I have included in assets folder in my project. Also, I have included chart.js and Chart.BoxPlot.js files in .angular-cli.json:

"scripts": [ "../node_modules/chart.js/dist/Chart.bundle.js", "assets/Chart.BoxPlot.js" ]

Then, I have imported chart.js module in my app.component.ts:

import * as Chart from 'chart.js';

But the error appears all the time when I try to build a chart with type: 'boxplot' or type: 'violin'.

I'm a bit new with Angular 5 and I really need help to know how to make this works in an Angular project. A simple example would be so helpful.

Sorry if I explained myself wrong... and thank you so much!!!

Feature request: Tooltips decimals

Thanks for this awesome plugin first of all.

A minor thing that would be nice to have is the option to round or cut the values in the tooltips to some limited decimals. Maybe have the limit as optional parameter?

Set box max width

Is there a way to set the max width of a box-plot rectangle. If my dataset only contains one or two items I not want it to stretch as below:

image

I saw in another issue that a box plot uses the Bar Controller but maxBarThickness is not working.

Reduce range of displayed outliers / do not display outliers

Hi,

first of all thanks a lot for this plug-in, it works great!
I have one feature request though: would it be possible to not display outliers / reduce the range of displayed outliers? Otherwise, if there are outliers far away, it can make the plot a lot less readable (see attached). What I am most interested in are the median calculated quartiles; I am happy to chop off the fourth quartile at a certain point, knowing that there are outliers above. So if I could somehow set a flag to suppress outliers, that would be perfect.

Thanks!

screenshot from 2018-07-13 08-50-06

Angular build error

Here are my project specifications:

Angular version: 6.1.0
Node version: 8.11.3
NPM version: 5.6.0
chartjs version: 2.7.2
chartjs-chart-box-and-violin-plot version: 1.4.1

The scripts array in angular.json file:

"scripts": [
              "node_modules/chart.js/dist/Chart.js",
              "node_modules/chartjs-chart-box-and-violin-plot/build/Chart.BoxPlot.min.js",
              "node_modules/hammerjs/hammer.min.js"
            ]

I have also imported in the main module of the project:
import 'chartjs-chart-box-and-violin-plot';

Take a look at the error I see in my Angular build logs:

ERROR in ./node_modules/chartjs-chart-box-and-violin-plot/build/Chart.BoxPlot.mjs
1016:0-8 Can't import the named export 'defaults' from non EcmaScript module (only default export is available)

ERROR in ./node_modules/chartjs-chart-box-and-violin-plot/build/Chart.BoxPlot.mjs
1016:19-26 Can't import the named export 'helpers' from non EcmaScript module (only default export is available)

ERROR in ./node_modules/chartjs-chart-box-and-violin-plot/build/Chart.BoxPlot.mjs
1016:38-46 Can't import the named export 'defaults' from non EcmaScript module (only default export is available)

ERROR in ./node_modules/chartjs-chart-box-and-violin-plot/build/Chart.BoxPlot.mjs
1017:0-8 Can't import the named export 'defaults' from non EcmaScript module (only default export is available)

ERROR in ./node_modules/chartjs-chart-box-and-violin-plot/build/Chart.BoxPlot.mjs
1017:29-36 Can't import the named export 'helpers' from non EcmaScript module (only default export is available)

ERROR in ./node_modules/chartjs-chart-box-and-violin-plot/build/Chart.BoxPlot.mjs
1017:48-56 Can't import the named export 'defaults' from non EcmaScript module (only default export is available)

ERROR in ./node_modules/chartjs-chart-box-and-violin-plot/build/Chart.BoxPlot.mjs
1020:19-27 Can't import the named export 'elements' from non EcmaScript module (only default export is available)

ERROR in ./node_modules/chartjs-chart-box-and-violin-plot/build/Chart.BoxPlot.mjs
1029:4-15 Can't import the named export 'controllers' from non EcmaScript module (only default export is available)

ERROR in ./node_modules/chartjs-chart-box-and-violin-plot/build/Chart.BoxPlot.mjs
1062:14-25 Can't import the named export 'controllers' from non EcmaScript module (only default export is available)

ERROR in ./node_modules/chartjs-chart-box-and-violin-plot/build/Chart.BoxPlot.mjs
1062:36-47 Can't import the named export 'controllers' from non EcmaScript module (only default export is available)

ERROR in ./node_modules/chartjs-chart-box-and-violin-plot/build/Chart.BoxPlot.mjs
1063:24-35 Can't import the named export 'controllers' from non EcmaScript module (only default export is available)

ERROR in ./node_modules/chartjs-chart-box-and-violin-plot/build/Chart.BoxPlot.mjs
1063:56-67 Can't import the named export 'controllers' from non EcmaScript module (only default export is available)

ERROR in ./node_modules/chartjs-chart-box-and-violin-plot/build/Chart.BoxPlot.mjs
1066:0-8 Can't import the named export 'defaults' from non EcmaScript module (only default export is available)

ERROR in ./node_modules/chartjs-chart-box-and-violin-plot/build/Chart.BoxPlot.mjs
1066:18-25 Can't import the named export 'helpers' from non EcmaScript module (only default export is available)

ERROR in ./node_modules/chartjs-chart-box-and-violin-plot/build/Chart.BoxPlot.mjs
1066:37-45 Can't import the named export 'defaults' from non EcmaScript module (only default export is available)

ERROR in ./node_modules/chartjs-chart-box-and-violin-plot/build/Chart.BoxPlot.mjs
1067:0-8 Can't import the named export 'defaults' from non EcmaScript module (only default export is available)

ERROR in ./node_modules/chartjs-chart-box-and-violin-plot/build/Chart.BoxPlot.mjs
1067:28-35 Can't import the named export 'helpers' from non EcmaScript module (only default export is available)

ERROR in ./node_modules/chartjs-chart-box-and-violin-plot/build/Chart.BoxPlot.mjs
1067:47-55 Can't import the named export 'defaults' from non EcmaScript module (only default export is available)

ERROR in ./node_modules/chartjs-chart-box-and-violin-plot/build/Chart.BoxPlot.mjs
1070:19-27 Can't import the named export 'elements' from non EcmaScript module (only default export is available)

ERROR in ./node_modules/chartjs-chart-box-and-violin-plot/build/Chart.BoxPlot.mjs
1079:4-15 Can't import the named export 'controllers' from non EcmaScript module (only default export is available)

ERROR in ./node_modules/chartjs-chart-box-and-violin-plot/build/Chart.BoxPlot.mjs
1139:15-26 Can't import the named export 'controllers' from non EcmaScript module (only default export is available)

ERROR in ./node_modules/chartjs-chart-box-and-violin-plot/build/Chart.BoxPlot.mjs
1139:36-47 Can't import the named export 'controllers' from non EcmaScript module (only default export is available)

ERROR in ./node_modules/chartjs-chart-box-and-violin-plot/build/Chart.BoxPlot.mjs
1140:23-34 Can't import the named export 'controllers' from non EcmaScript module (only default export is available)

ERROR in ./node_modules/chartjs-chart-box-and-violin-plot/build/Chart.BoxPlot.mjs
1140:54-65 Can't import the named export 'controllers' from non EcmaScript module (only default export is available)

ERROR in ./node_modules/chartjs-chart-box-and-violin-plot/build/Chart.BoxPlot.mjs
1142:16-23 Can't import the named export 'helpers' from non EcmaScript module (only default export is available)

ERROR in ./node_modules/chartjs-chart-box-and-violin-plot/build/Chart.BoxPlot.mjs
1143:71-83 Can't import the named export 'scaleService' from non EcmaScript module (only default export is available)

ERROR in ./node_modules/chartjs-chart-box-and-violin-plot/build/Chart.BoxPlot.mjs
1144:23-35 Can't import the named export 'scaleService' from non EcmaScript module (only default export is available)

ERROR in ./node_modules/chartjs-chart-box-and-violin-plot/build/Chart.BoxPlot.mjs
1146:11-26 Can't import the named export 'LinearScaleBase' from non EcmaScript module (only default export is available)

ERROR in ./node_modules/chartjs-chart-box-and-violin-plot/build/Chart.BoxPlot.mjs
1154:0-12 Can't import the named export 'scaleService' from non EcmaScript module (only default export is available)

ERROR in ./node_modules/chartjs-chart-box-and-violin-plot/build/Chart.BoxPlot.mjs
1156:16-23 Can't import the named export 'helpers' from non EcmaScript module (only default export is available)

ERROR in ./node_modules/chartjs-chart-box-and-violin-plot/build/Chart.BoxPlot.mjs
1157:76-88 Can't import the named export 'scaleService' from non EcmaScript module (only default export is available)

ERROR in ./node_modules/chartjs-chart-box-and-violin-plot/build/Chart.BoxPlot.mjs
1158:28-40 Can't import the named export 'scaleService' from non EcmaScript module (only default export is available)

ERROR in ./node_modules/chartjs-chart-box-and-violin-plot/build/Chart.BoxPlot.mjs
1160:11-26 Can't import the named export 'LinearScaleBase' from non EcmaScript module (only default export is available)

ERROR in ./node_modules/chartjs-chart-box-and-violin-plot/build/Chart.BoxPlot.mjs
1189:0-12 Can't import the named export 'scaleService' from non EcmaScript module (only default export is available)

ERROR in ./node_modules/chartjs-chart-box-and-violin-plot/build/Chart.BoxPlot.mjs
436:35-43 Can't import the named export 'defaults' from non EcmaScript module (only default export is available)

ERROR in ./node_modules/chartjs-chart-box-and-violin-plot/build/Chart.BoxPlot.mjs
439:16-24 Can't import the named export 'defaults' from non EcmaScript module (only default export is available)

ERROR in ./node_modules/chartjs-chart-box-and-violin-plot/build/Chart.BoxPlot.mjs
443:23-31 Can't import the named export 'defaults' from non EcmaScript module (only default export is available)

ERROR in ./node_modules/chartjs-chart-box-and-violin-plot/build/Chart.BoxPlot.mjs
444:19-27 Can't import the named export 'defaults' from non EcmaScript module (only default export is available)

ERROR in ./node_modules/chartjs-chart-box-and-violin-plot/build/Chart.BoxPlot.mjs
447:23-30 Can't import the named export 'Element' from non EcmaScript module (only default export is available)

ERROR in ./node_modules/chartjs-chart-box-and-violin-plot/build/Chart.BoxPlot.mjs
467:8-21 Can't import the named export 'canvasHelpers' from non EcmaScript module (only default export is available)

ERROR in ./node_modules/chartjs-chart-box-and-violin-plot/build/Chart.BoxPlot.mjs
471:8-21 Can't import the named export 'canvasHelpers' from non EcmaScript module (only default export is available)

ERROR in ./node_modules/chartjs-chart-box-and-violin-plot/build/Chart.BoxPlot.mjs
571:0-8 Can't import the named export 'defaults' from non EcmaScript module (only default export is available)

ERROR in ./node_modules/chartjs-chart-box-and-violin-plot/build/Chart.BoxPlot.mjs
601:20-28 Can't import the named export 'elements' from non EcmaScript module (only default export is available)

ERROR in ./node_modules/chartjs-chart-box-and-violin-plot/build/Chart.BoxPlot.mjs
603:12-19 Can't import the named export 'Element' from non EcmaScript module (only default export is available)

ERROR in ./node_modules/chartjs-chart-box-and-violin-plot/build/Chart.BoxPlot.mjs
618:21-28 Can't import the named export 'helpers' from non EcmaScript module (only default export is available)

ERROR in ./node_modules/chartjs-chart-box-and-violin-plot/build/Chart.BoxPlot.mjs
790:0-8 Can't import the named export 'defaults' from non EcmaScript module (only default export is available)

ERROR in ./node_modules/chartjs-chart-box-and-violin-plot/build/Chart.BoxPlot.mjs
823:13-21 Can't import the named export 'elements' from non EcmaScript module (only default export is available)

ERROR in ./node_modules/chartjs-chart-box-and-violin-plot/build/Chart.BoxPlot.mjs
825:12-19 Can't import the named export 'Element' from non EcmaScript module (only default export is available)

ERROR in ./node_modules/chartjs-chart-box-and-violin-plot/build/Chart.BoxPlot.mjs
840:20-27 Can't import the named export 'helpers' from non EcmaScript module (only default export is available)

ERROR in ./node_modules/chartjs-chart-box-and-violin-plot/build/Chart.BoxPlot.mjs
859:4-17 Can't import the named export 'canvasHelpers' from non EcmaScript module (only default export is available)

ERROR in ./node_modules/chartjs-chart-box-and-violin-plot/build/Chart.BoxPlot.mjs
978:4-15 Can't import the named export 'controllers' from non EcmaScript module (only default export is available)

ERROR in ./node_modules/chartjs-chart-box-and-violin-plot/build/Chart.BoxPlot.mjs
980:70-77 Can't import the named export 'helpers' from non EcmaScript module (only default export is available)

i 「wdm」: Failed to compile.

Defining data structure with items

I'm trying to generate a boxplot chart with defined min, q1, median, q3, and max values, but I also want to show the jittered datapoints.

This is currently how I do it. using (technically) same data (array [1, 2, 3, 4, 5])
https://codepen.io/anon/pen/MRGavN
The problem is, the datapoints aren't showing even if I add the items. They show up if I use outliers instead but they aren't jittered which is what I want.

ERROR TypeError: Cannot read property 'minBarLength' of undefined

Since updating Chart.js and chartjs-chart-box-and-violin-plot I'm getting this error:

DadosComponent.html:37 ERROR TypeError: Cannot read property 'minBarLength' of undefined
    at ChartElement.calculateBarValuePixels (Chart.js:5042)
    at ChartElement._updateElementGeometry (Chart.js:4937)
    at ChartElement._updateElementGeometry (Chart.BoxPlot.js:1052)
    at ChartElement.updateElement (Chart.js:4922)
    at ChartElement.updateElement (Chart.BoxPlot.js:992)
    at ChartElement.update (Chart.js:4895)
    at ChartElement._update (Chart.js:3831)
    at ChartElement.reset (Chart.js:3733)
    at Chart.js:9638
    at Object.each (Chart.js:2227)

I'm using this in a Angular project. These are the versions:

  • "chart.js": "^2.9.2",
  • "chartjs-chart-box-and-violin-plot": "^2.1.0",
  • "@types/chart.js": "^2.8.11",

Is this a version compatibility problem with Chart.js? Should I downgrade for now?

improve whisker computation

in case of all data are given, improve how the whiskers are computed considered the underlying datapoints.

Error: "boxplot" is not a chart type in VUE

I am trying to use boxplot chart in my Vue.js project

I used the exact code of https://codesandbox.io/s/vy8r1x5ow5. as a model.

I have install the the following plugins:
npm install --save chart.js vue-chartjs chartjs-chart-box-and-violin-plot

It install these versions:

"chart.js": "^2.8.0",
"chartjs-chart-box-and-violin-plot": "^2.1.0",
"vue": "^2.6.10",
"vue-chartjs": "^3.4.2",

I am using vue-cli 3.5.0 default project.

First, I got the same error of issue: #32.

So, I delete the node_modules/chartjs-chart-box-and-violin-plot/build/Chart.BoxPlot.mjs file.

After that, I got the error:

Invalid prop: type check failed for prop "chartData". Expected Object, got Null

then, I change the time when the fillData() method is called from the mounted() to the beforeMount() method.:

beforeMount() { this.fillData(); },

It solve the problem of "Object, got Null", but I am now with another problem:

Error: ""boxplot" is not a chart type."
buildOrUpdateControllerswebpack-internal:///./node_modules/chart.js/dist/Chart.js:8670:12eachwebpack-internal:///./node_modules/chart.js/dist/Chart.js:1800:6buildOrUpdateControllerswebpack-internal:///./node_modules/chart.js/dist/Chart.js:8654:3updatewebpack-internal:///./node_modules/chart.js/dist/Chart.js:8725:24constructwebpack-internal:///./node_modules/chart.js/dist/Chart.js:8463:3Chartwebpack-internal:///./node_modules/chart.js/dist/Chart.js:8401:2renderChartwebpack-internal:///./node_modules/vue-chartjs/es/BaseCharts.js:74:29mountedwebpack-internal:///./src/components/studyone/BoxPlotChart.js:15:5invokeWithErrorHandlingwebpack-internal:///./node_modules/vue/dist/vue.runtime.esm.js:1853:49callHookwebpack-internal:///./node_modules/vue/dist/vue.runtime.esm.js:4207:7insertwebpack-internal:///./node_modules/vue/dist/vue.runtime.esm.js:3136:7invokeInsertHookwebpack-internal:///./node_modules/vue/dist/vue.runtime.esm.js:6330:9patchwebpack-internal:///./node_modules/vue/dist/vue.runtime.esm.js:6549:5_updatewebpack-internal:///./node_modules/vue/dist/vue.runtime.esm.js:3936:16updateComponentwebpack-internal:///./node_modules/vue/dist/vue.runtime.esm.js:4054:7getwebpack-internal:///./node_modules/vue/dist/vue.runtime.esm.js:4467:13runwebpack-internal:///./node_modules/vue/dist/vue.runtime.esm.js:4542:17flushSchedulerQueuewebpack-internal:///./node_modules/vue/dist/vue.runtime.esm.js:4298:5nextTickwebpack-internal:///./node_modules/vue/dist/vue.runtime.esm.js:1979:9flushCallbackswebpack-internal:///./node_modules/vue/dist/vue.runtime.esm.js:1905:5runwebpack-internal:///./node_modules/core-js/modules/es6.promise.js:75:22notifywebpack-internal:///./node_modules/core-js/modules/es6.promise.js:92:30flushwebpack-internal:///./node_modules/core-js/modules/_microtask.js:18:9 vue.runtime.esm.js:1888

Someone have any ideas about how to resolve this?
Thank you

Issue with Whisker Length Calculation

Most statistics books define the whisker max/min as

MAX = Q3 + IQR*1.5
MIN = Q1 - IQR*1.5

Is there a reason this library dictates it as?
image

If not can we change this to be 1.5 or have an option to default to either 1.5, 1, or use whatever value we give as the max.

Recommend Projects

  • React photo React

    A declarative, efficient, and flexible JavaScript library for building user interfaces.

  • Vue.js photo Vue.js

    🖖 Vue.js is a progressive, incrementally-adoptable JavaScript framework for building UI on the web.

  • Typescript photo Typescript

    TypeScript is a superset of JavaScript that compiles to clean JavaScript output.

  • TensorFlow photo TensorFlow

    An Open Source Machine Learning Framework for Everyone

  • Django photo Django

    The Web framework for perfectionists with deadlines.

  • D3 photo D3

    Bring data to life with SVG, Canvas and HTML. 📊📈🎉

Recommend Topics

  • javascript

    JavaScript (JS) is a lightweight interpreted programming language with first-class functions.

  • web

    Some thing interesting about web. New door for the world.

  • server

    A server is a program made to process requests and deliver data to clients.

  • Machine learning

    Machine learning is a way of modeling and interpreting data that allows a piece of software to respond intelligently.

  • Game

    Some thing interesting about game, make everyone happy.

Recommend Org

  • Facebook photo Facebook

    We are working to build community through open source technology. NB: members must have two-factor auth.

  • Microsoft photo Microsoft

    Open source projects and samples from Microsoft.

  • Google photo Google

    Google ❤️ Open Source for everyone.

  • D3 photo D3

    Data-Driven Documents codes.