Coder Social home page Coder Social logo

data2viz / data2viz Goto Github PK

View Code? Open in Web Editor NEW
400.0 11.0 29.0 16.15 MB

An Android, JavaFx, JS multiplatform datavisualization library with comprehensive DSL

Home Page: https://data2viz.io/

Kotlin 98.00% HTML 1.46% JavaScript 0.54%
kotlin data-visualization dataviz

data2viz's Introduction

Data2viz

Build Status GitHub License

Build JS Build JS Build JS Build JS

Isomorphic dataviz

Data2viz is a data visualization toolbox for Kotlin Multiplatform.

You can pick what you need in the different modules and use them independently in the following environments: Android, JavaScript(IR and Legacy), and JavaFX (iOS to come).

Your code produces the same results and rendering on each platform.

A lot of algorithms come from d3js modules.

This module exposes some basics elements like Circle, Rect, Path, and also some parts of DSL (percent, angles, etc.).

This module provides algorithms to create, modify, and convert colors through differents spaces (RGB, HCL, HSL, Lab). It also manage linear and radial color gradients. You can easily use it outside of data2viz.

Algorithms to generate paths: symbols, curves, ...

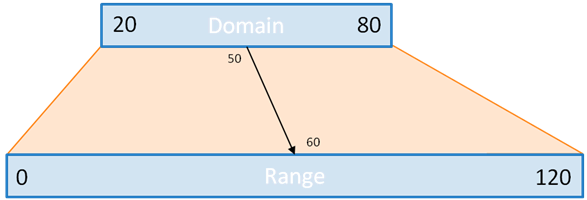
Different ways to convert data to sizes.

Functions to perform interpolation of various elements (numbers, colors, points, curves)

Algorithms to generate random data.

Helper module to create axis for charts, using scales.

This module is a high performant algorithm to compute the Voronoi diagram. You should use it in many use cases to find the closest point of interest to the pointer position.

This module contains a collection of easing functions to manage acceleration inside animations.

Minimal way of parsing CSV, TSV files using Kotlin.

Use physics to animate your visualizations.

Different ways of formating numbers and currencies.

Some multiplatform classes to manage time and dates in visualizations.

Extend formatting to time and dates.

Separation of space through the quadtree algorithm.

Fortune's algorithm implementation of the Voronoi diagram. You should probably use Delaunay instead.

A collection of mechanisms and functions to project GeoJson elements (points, lines, polygons) on a screen using different implementations of projections.

A useful way of aggregating data using hexagons. You can represent data through the fill color or the area.

A generator for sankey charts.

A generator for hierarchical charts.

An internal module used to simplify multiplatform testing with a higher DSL.

A multiplatform implementation to manage animations through shared frames.

Multiplatorm API and implementation of rendering and events management.

Data2viz allows you to develop data visualizations through a fully typed DSL. It simplifies the creation of complex visualizations via the IDE’s context-based suggestions.

Where should I start?

Documentation

All data2viz documentation is located in a distinct documentation project. You should start there and follow the first JavaFX tutorial.

Data2viz Playground

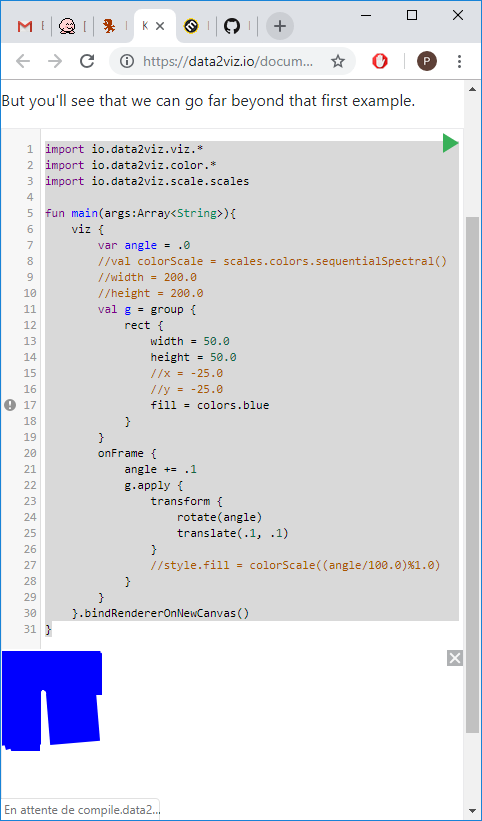
You can also play with the API without installing anything. Data2viz playground is a website where you can browse existing sample, modify them online and immediately see the result.

Using in your projects

Note that the library is experimental, and the API is subject to change.

The library is published to data2viz space repository.

Gradle

  • In multiplatform projects, add a dependency to the commonMain source set dependencies
kotlin {
    sourceSets {
        commonMain {
             dependencies {
                 implementation("io.data2viz.d2v:d2v-axis:0.10.7")
                 implementation("io.data2viz.d2v:d2v-chord:0.10.7")
                 implementation("io.data2viz.d2v:d2v-color:0.10.7")
                 implementation("io.data2viz.d2v:d2v-contour:0.10.7")
                 implementation("io.data2viz.d2v:d2v-delaunay:0.10.7")
                 implementation("io.data2viz.d2v:d2v-dsv:0.10.7")
                 implementation("io.data2viz.d2v:d2v-ease:0.10.7")
                 implementation("io.data2viz.d2v:d2v-force:0.10.7")
                 implementation("io.data2viz.d2v:d2v-format:0.10.7")
                 implementation("io.data2viz.d2v:d2v-geo:0.10.7")
                 implementation("io.data2viz.d2v:d2v-hexbin:0.10.7")
                 implementation("io.data2viz.d2v:d2v-hierarchy:0.10.7")
                 implementation("io.data2viz.d2v:d2v-quadtree:0.10.7")
                 implementation("io.data2viz.d2v:d2v-random:0.10.7")
                 implementation("io.data2viz.d2v:d2v-scale:0.10.7")
                 implementation("io.data2viz.d2v:d2v-shape:0.10.7")
                 implementation("io.data2viz.d2v:d2v-tile:0.10.7")
                 implementation("io.data2viz.d2v:d2v-time:0.10.7")
                 implementation("io.data2viz.d2v:d2v-timer:0.10.7")
                 implementation("io.data2viz.d2v:d2v-viz:0.10.7")
             }
        }
    }
}
  • To use the library in a single-platform project, add a dependency to the dependencies block.
dependencies {
    implementation("io.data2viz.d2v:d2v-axis:0.10.7")
    implementation("io.data2viz.d2v:d2v-chord:0.10.7")
    implementation("io.data2viz.d2v:d2v-color:0.10.7")
    implementation("io.data2viz.d2v:d2v-contour:0.10.7")
    implementation("io.data2viz.d2v:d2v-delaunay:0.10.7")
    implementation("io.data2viz.d2v:d2v-dsv:0.10.7")
    implementation("io.data2viz.d2v:d2v-ease:0.10.7")
    implementation("io.data2viz.d2v:d2v-force:0.10.7")
    implementation("io.data2viz.d2v:d2v-format:0.10.7")
    implementation("io.data2viz.d2v:d2v-geo:0.10.7")
    implementation("io.data2viz.d2v:d2v-hexbin:0.10.7")
    implementation("io.data2viz.d2v:d2v-hierarchy:0.10.7")
    implementation("io.data2viz.d2v:d2v-quadtree:0.10.7")
    implementation("io.data2viz.d2v:d2v-random:0.10.7")
    implementation("io.data2viz.d2v:d2v-scale:0.10.7")
    implementation("io.data2viz.d2v:d2v-shape:0.10.7")
    implementation("io.data2viz.d2v:d2v-tile:0.10.7")
    implementation("io.data2viz.d2v:d2v-time:0.10.7")
    implementation("io.data2viz.d2v:d2v-timer:0.10.7")
    implementation("io.data2viz.d2v:d2v-viz:0.10.7")
}

Current status and roadmap

APIs are mostly stabilized now, but there may still be some breaking changes before v1.0.

Inspirations

  • d3js: a lot of modules and algorithms come from d3js.
  • paperjs: another source of inspiration for viz hierarchy and simple API.
  • chromajs: smart library for managing colors easily.
  • delaunator: a really fast JavaScript library for Delaunay triangulation of 2D points.
  • kotlinx.html: isomorphic html rendering.
  • kotlintest: nice DSL for testing (partly ported in test).

data2viz's People

Contributors

azertypow avatar erikthered avatar gzoritchak avatar jolanrensen avatar louiscad avatar pmariac avatar sierisimo avatar xal avatar

Stargazers

 avatar  avatar  avatar  avatar  avatar  avatar  avatar  avatar  avatar  avatar  avatar  avatar  avatar  avatar  avatar  avatar  avatar  avatar  avatar  avatar  avatar  avatar  avatar  avatar  avatar  avatar  avatar  avatar  avatar  avatar  avatar  avatar  avatar  avatar  avatar  avatar  avatar  avatar  avatar  avatar  avatar  avatar  avatar  avatar  avatar  avatar  avatar  avatar  avatar  avatar  avatar  avatar  avatar  avatar  avatar  avatar  avatar  avatar  avatar  avatar  avatar  avatar  avatar  avatar  avatar  avatar  avatar  avatar  avatar  avatar  avatar  avatar  avatar  avatar  avatar  avatar  avatar  avatar  avatar  avatar  avatar  avatar  avatar  avatar  avatar  avatar  avatar  avatar  avatar  avatar  avatar  avatar  avatar  avatar  avatar  avatar  avatar  avatar  avatar  avatar

Watchers

 avatar  avatar  avatar  avatar  avatar  avatar  avatar  avatar  avatar  avatar  avatar

data2viz's Issues

Canvas does not clean when applying a transformation

when applying a transform (rotate+translate) the canvas is partially cleaned see this example.

image

import io.data2viz.viz.*
import io.data2viz.color.*
import io.data2viz.scale.scales

fun main(args:Array<String>){
    viz {
        var angle = .0
        val g = group {
            rect {
                width = 50.0
                height = 50.0
                fill = colors.blue
        	}
        }             
        onFrame {
            angle += .1
            g.apply {
             	transform {
                	rotate(angle)
                	translate(.1, .1)
            	}
            }
        }
    }.bindRendererOnNewCanvas()
}

Can't try this out with Gradle

I'd like to try it out, but adding

compile 'io.data2viz:d2v-axis-common:0.3.1'
to build.gradle just doesn't work.

It can't download certain pom's from bintray.com, which is solved by saving security certificate in the browser and then importing it on the Security tab of the Java Control Panel:

screen shot 2018-02-18 at 23 03 17

Then there is another authentication issue downloading d2v-axis-common-0.3.1.pom from https://maven.oracle.com, which I had created an Oracle account for and added the credentials section to the build.gradle:

    maven {
         url "https://maven.oracle.com"
         credentials {
             username "****"
             password "****"
         }
     }

And now I get:

 Could not resolve all files for configuration ':compileClasspath'.
Caused by: org.gradle.internal.resolve.ModuleVersionResolveException: Could not resolve io.data2viz:d2v-axis-common:0.3.1.
Required by:
    project :
Caused by: org.gradle.internal.resolve.ModuleVersionResolveException: Could not resolve io.data2viz:d2v-axis-common:0.3.1.
Caused by: org.gradle.api.resources.ResourceException: Could not get resource 'https://maven.oracle.com/io/data2viz/d2v-axis-common/0.3.1/d2v-axis-common-0.3.1.pom'.
Caused by: org.gradle.internal.resource.transport.http.HttpRequestException: Could not GET 'https://maven.oracle.com/io/data2viz/d2v-axis-common/0.3.1/d2v-axis-common-0.3.1.pom'.
Caused by: org.apache.http.client.ClientProtocolException: null
Caused by: org.apache.http.client.CircularRedirectException: Circular redirect to 'https://www.oracle.com/content/secure/maven/content/io/data2viz/d2v-axis-common/0.3.1/d2v-axis-common-0.3.1.pom'</i>

Am I doing something wrong?

data2viz js not working in IExplorer - (append?)

I got a graph to work in Chrome, Firefox, Edge, but not in Iexplorer. I can see the online JS examples are also not working in IExplorer.

I think it may be because IExplorer does not accept the append method on dom elements, these calls could be probably replaced with "appendChild".

Tile Module : clean tiles out of extent

there should be an option or a described code to clean tiles out of scope for example when dragging large tilemaps around (creating tiles way out of screen)

LinearGradient: complete implementation

Current implementation is more a prototype than the definitive version of it. It generate only a linear gradient using points. It should handle direction.

Also, it can be interesting to provide nice typesafe builders.

Internal logging API

In order to help the development, it is sometimes easier to have some logs (timer issues, ...).

This logging system shouldn't have any cost in terms of performance. Existing multiplatform solutions seems to be overkill.

Prerelase artifacts?

I know it's prerelaese at the moment, but is there any chance you provide public artifacts for prerelaese builds?

The project looks really promising, pls keep going😀

All scales initialization should be available through lambda

OK on linear

    var scale = scales.continuous.linear {
        domain = listOf(1.0, 200.0)
        range = listOf(0.0, 1.0)
    }

Not possible on pow:

    var scale = scales.continuous.pow(3.0) {
        domain = listOf(1.0, 200.0)
        range = listOf(0.0, 1.0)
    }

Current workaround:

    var scale = scales.continuous.pow(3.0).apply {
        domain = listOf(1.0, 200.0)
        range = listOf(0.0, 1.0)
    }

Give typed access to configuration depending on the platform

A configuration may have some generic parameters that apply on all platform and some that only make sense on a specific platform. It should be possible to provide access to these parameters using the same API but having different params depending on the platform.

viz {
    configure { // on common code
          resizable = false
    }
}
viz {
    configure { // on android
          minimumBatteryMinimumForAnimations = 40.pct
    }
}

Deploy js lib to npm

To facilitate the use of the library by client application (demo, samples, documentation) it should be available on npm.

Move RenderingTestSupport outside of main sources

This class contains the common renderings tests for js, jfx and android.

Before the creation of rendering-app, it was in test sources. But the integration of this new app to do the tests seems impossible with a dependency on test sources. As a temporairy workaround this class has been moved in main sources.

Implement all rendering tests of Path.arc

Due to the differences in arc API on each platform, all cases should be tested on all platforms with a comparison of the rendered images.

start; end; counterclocwise;
0; 0.25PI; false
0; 0.25PI; true
0; 2.0PI; true
0; 2.0PI; false
.25PI; 2.25PI; true
.25PI; 2.25PI; false
...

Deploy to JCenter and/or Maven central

Currently artefact are available by adding the url of the repo:

repositories {
    maven { url "http://dl.bintray.com/data2viz/data2viz" }
}

It would be better to just indicate jcenter or maven central.

TRANSITION: combine transitions

    rect {
        width = 10.0
        height = width
        fill = colors.grey

        transitionTo {
            x = 100.0
        } thenTransitionTo {
            y = 100.0
        } thenTransitionTo {
            x = 0.0
        } thenTransitionTo {
            y = 0.0
        }
    }

Provide default style with a parent/child mechanism

A default style should be provided and defined in a lambda:

viz {
    defaultStyle {
        fill = colors.red
        stroke = colors.black
        strokeWidth = 2.0
    }
}

Viz element should not use the style property (which should be internal) but instead access to style properties through direct getters and setters. It would allow to avoid the creation of a Style object for the element if only getters are called. The Style object would be created for the node only in case of setter calls. This convention would allow to reuse the same Paint instance for a group of elements sharing the same style.

Naming conventions

Why of all the class and singleton names these particular ones should start with a lowercase letter?

scales.continuous.linear { }

instead of

Scales.Continuous.linear { }

This strikes me as a very odd and arbitrary decision.

Angle as inline class

Angle appears to be a nice target for an inline class. It should provide a much more interesting API with some abstractions and no performance cost.

It should also simplify some algorithms like the various implementation of Path.arc.

API:
Number.deg
Number.rad
Angle.cos
Angle.sin
...
angle + angle
angle * Number
angle / Number

Transition of transformation

Allow to use transformations in transitions:

  rect {
       x = 10.0
       y = 10.0
       width = 10.0
       height = 10.0

       transition {
           transform {
               translate(x = 10.0 * index, y = 20.0)
           }
       }
   }

Integrate platform rendering tests on the project

The prototype of testing by pixel comparison should be integrated in the project.

The javascript version is the target (the API sticks to it). Each platform project should compare its image generation with target.

On JS, use of puppeeter to copy the generated image from canvas.
On Android, save the file in the emulator and the pull it with adb.

Manage visibility of nodes

Provide a simple way of rendering or not elements. The property is accessible on each node of a hierarchy, from layers to leaf nodes.

If visible is set to false the node and its children are not rendered.

Recommend Projects

  • React photo React

    A declarative, efficient, and flexible JavaScript library for building user interfaces.

  • Vue.js photo Vue.js

    🖖 Vue.js is a progressive, incrementally-adoptable JavaScript framework for building UI on the web.

  • Typescript photo Typescript

    TypeScript is a superset of JavaScript that compiles to clean JavaScript output.

  • TensorFlow photo TensorFlow

    An Open Source Machine Learning Framework for Everyone

  • Django photo Django

    The Web framework for perfectionists with deadlines.

  • D3 photo D3

    Bring data to life with SVG, Canvas and HTML. 📊📈🎉

Recommend Topics

  • javascript

    JavaScript (JS) is a lightweight interpreted programming language with first-class functions.

  • web

    Some thing interesting about web. New door for the world.

  • server

    A server is a program made to process requests and deliver data to clients.

  • Machine learning

    Machine learning is a way of modeling and interpreting data that allows a piece of software to respond intelligently.

  • Game

    Some thing interesting about game, make everyone happy.

Recommend Org

  • Facebook photo Facebook

    We are working to build community through open source technology. NB: members must have two-factor auth.

  • Microsoft photo Microsoft

    Open source projects and samples from Microsoft.

  • Google photo Google

    Google ❤️ Open Source for everyone.

  • D3 photo D3

    Data-Driven Documents codes.