Coder Social home page Coder Social logo

pymeteo's Introduction

pyMeteo

DOI

General meteorological routines, skew-T/log-p plotting and working with CM1 model data.

Online documentation available at http://cwebster2.github.io/pyMeteo/

Getting pyMeteo

The easiest way to get pymeteo is via pip

pip install pymeteo

or via anaconda

conda install -c cwebster2 pymeteo

pyMeteo is developed with python 3.7 and should work with any version of python 3 but may not work with python 2. Open an issue or send me a pull request if you want to make python 2 work but make sure any submissions do not regress against python 3.

You can obtain the most recent development version of pymeteo by cloing this repository.

git clone https://github.com/cwebster2/pyMeteo.git
cd pyMeteo
python3 setup.py install

Inlcuded scripts

cm1_geninit -- visualize analytical skewt and hodograph and write sounding file suitable for CM1 or WRF
plot-acars -- visualize aircraft sounding data, updated hourly.

[TOC]

CM1 / WRF intput sounding generation

The utility:

$ cm1_geninit

allows the previwing of analytic soundings and hodographs and writing to files suitable for initializing the CM1 or WRF weather models. The code is extensible and adding your own analytic profiles should be straightforward. Future documentation will detail this and I welcome pull requests!

#Skew-T / Ln-P diagrams

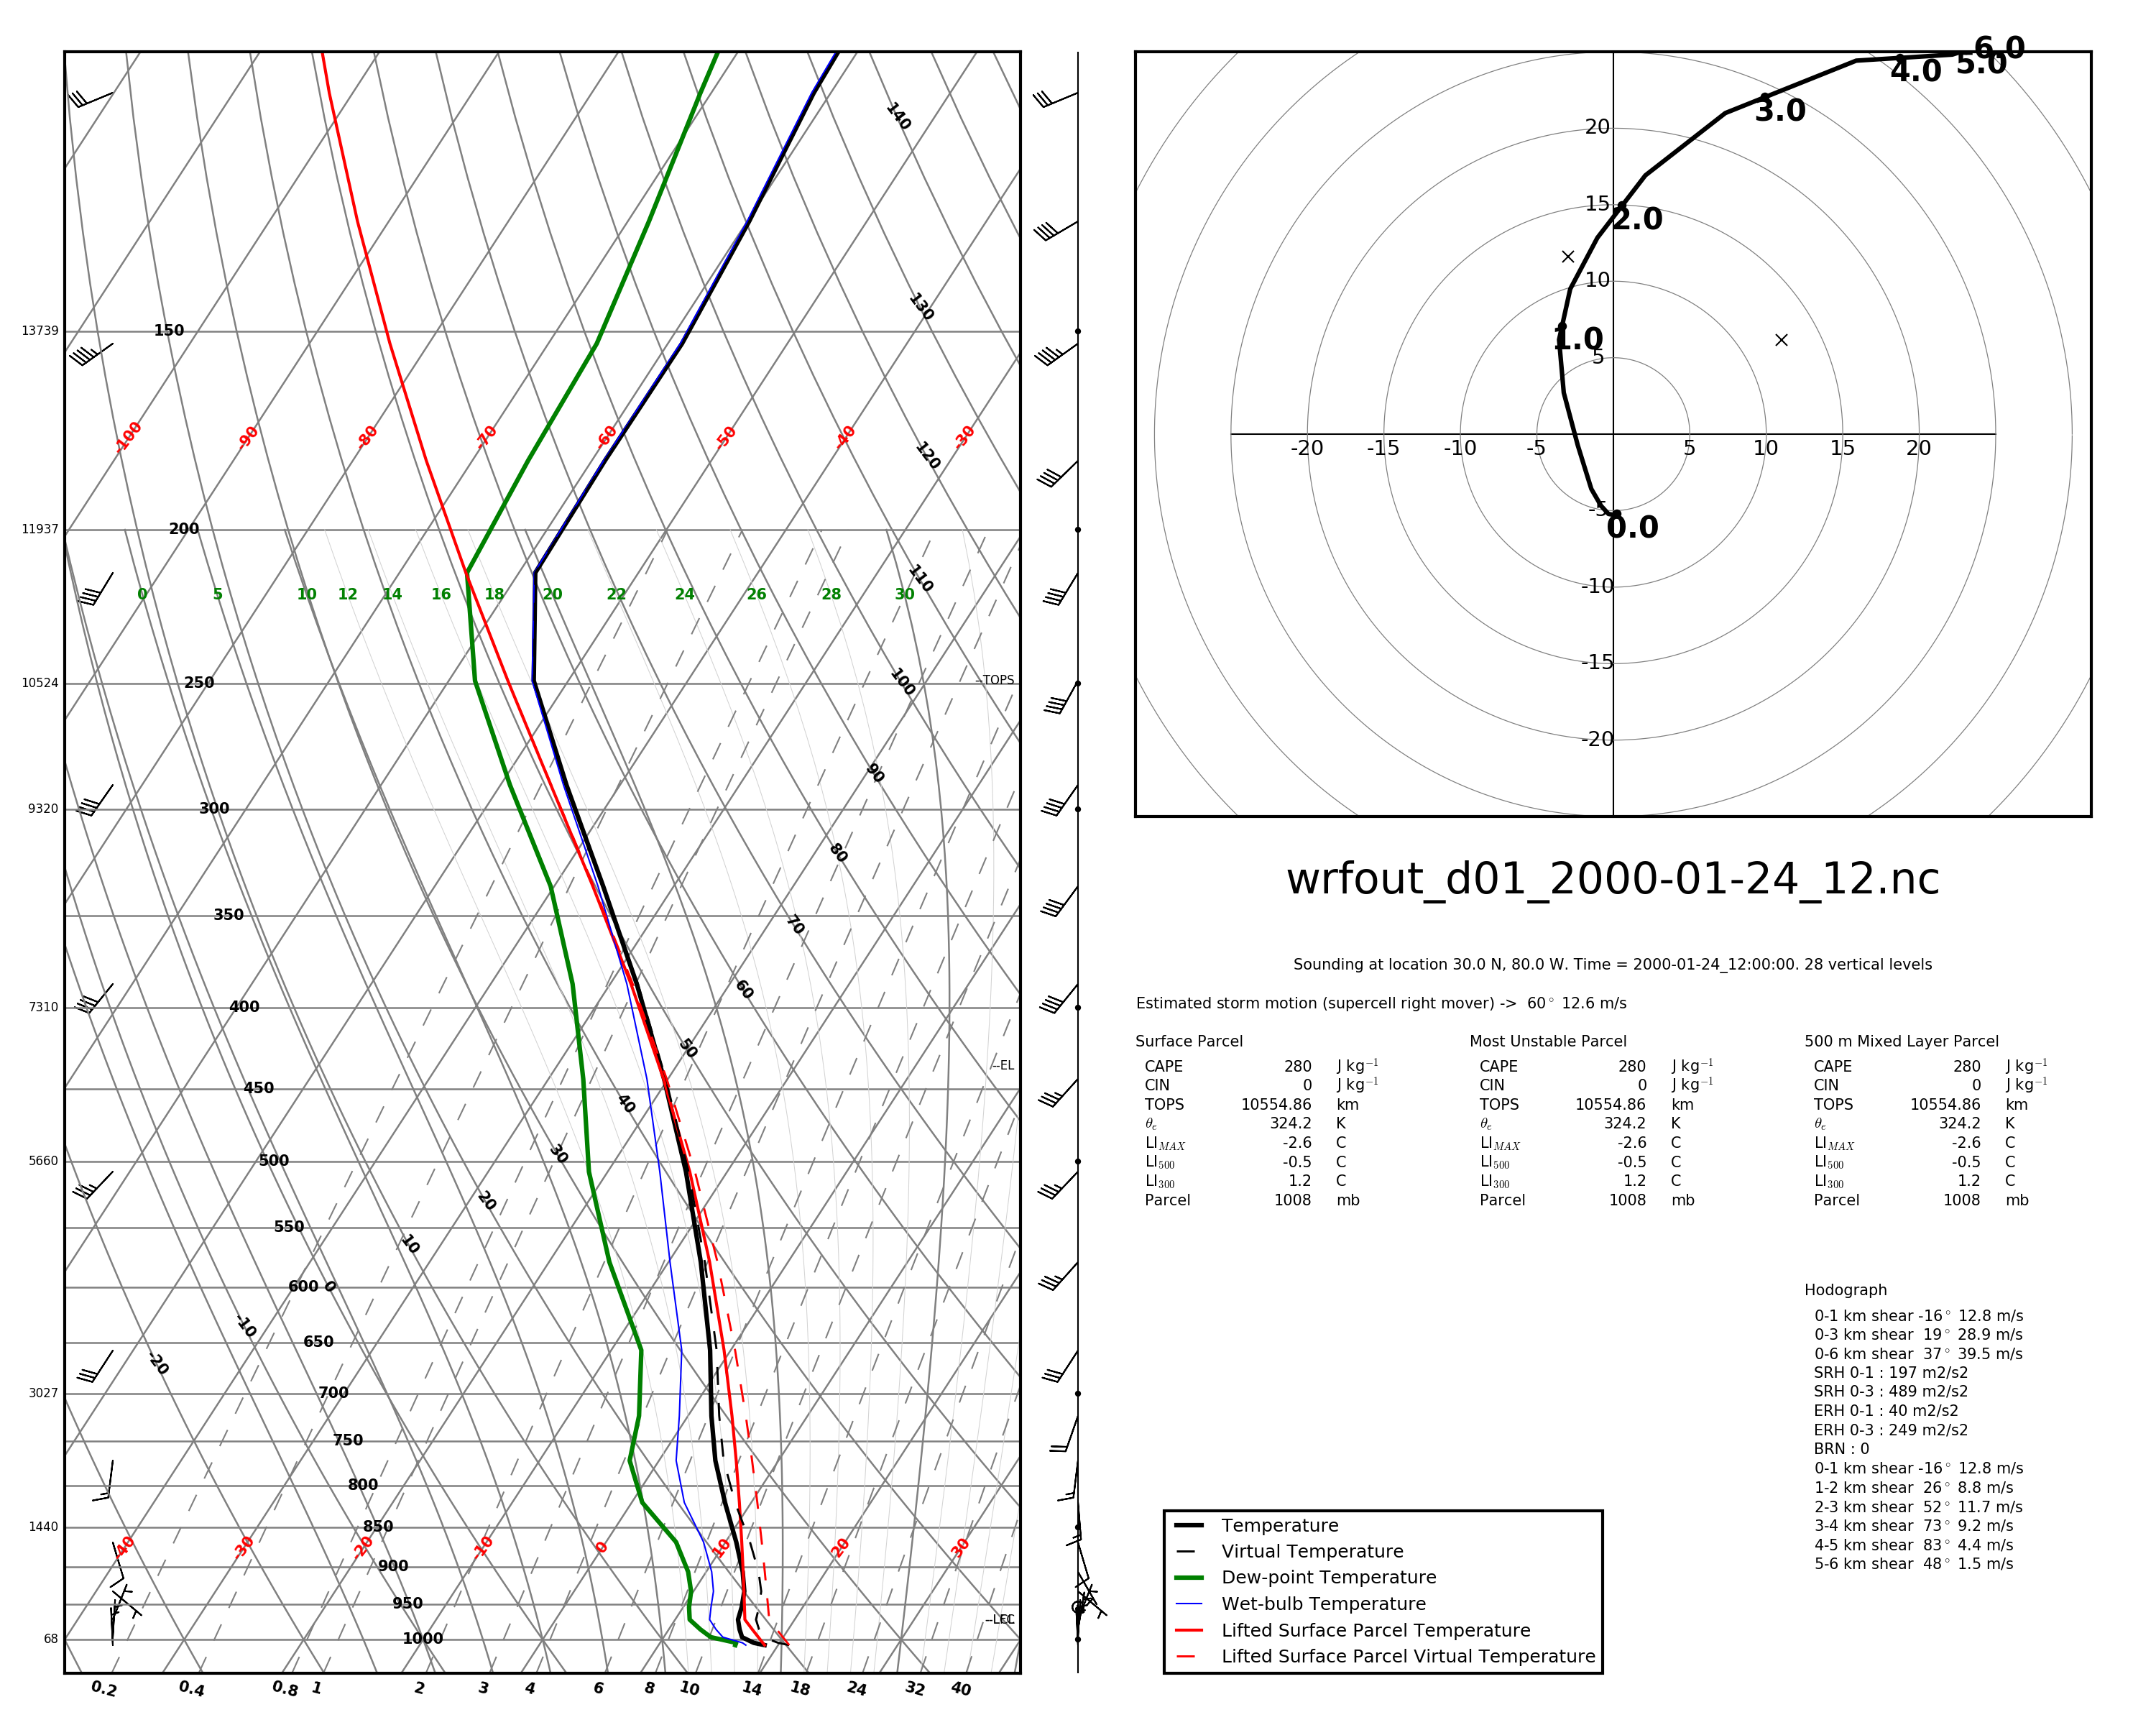
Skew-T / Ln-P plots are simply 2-D plots with a skewed temperature axis and a logarithmic pressure axes (y). Data plotted on this style of plot include temperature, dew point, and various other derived values such as the temperature of a parcel lifted from the surface. The plots produced by these scripts also have a hodograph plotted and a data block with convective storm parameters.

Example plot

skewt

Plotting from data

In all of the plotting methods, the plot output type is determined by the extension of the output file provided. You can write any type of file that the matplotlib backend can write.

Tabular

If you have tabular data suitable for WRF or CM1 model initialization, you can plot a skewt of this data with:

$ skewt tabular -f sounding.dat skewt.pdf

The format of the sounding data file is

1 line header that contains: surface pressure (mb) surface theta (K) surface qv (g/kg)

following lines are: height (m) theta (K) qv (g/kg) u (m/s) v (m/s)

See the file testdata/sounding_wrfinit.dat for an example of this file format.

CM1

For CM1 output in native GrADS format, you can plot a skewt from model output with

$ skewt cm1 -p . -d cm1out -x 0 -y 0 skewt-cm1.pdf

In this case, -p is the path to the dataset, -d is the CM1 output_basename, -x and -y are the location of the plot in km and -o is the file to output. The current version (v0.4) of this script only works for CM1 datasets that are output with one file per timestep and will plot whatever timestep the file contains.

CM1 / HDF5

For CM1 output in HDF5 format, you can plot a skewt from model output with:

$ skewt cm1hdf -f model-data.h5 -x 0 -y 0 output.pdf

This currently requires that HDF5 output be un-tiled (though it might work for tiled files, I have not checked). The options are as in the CM1 GrADS version except that there is no -p and -f references a specific HDF5 file. This also assumes one file per timestep and will plot whatever timestep the file contains.

WRF

For WRF output in NetCDF format, you can plot a skewt from model output with:

$ skewt wrf -f wrfou.nc --lat 30 --lon -80 -t 0 skewt.pdf

In this case, -f references a WRF output file, --lat and --lon reference a location within the WRF domain, -t reference a timestep within the WRF output and -o specifies an output files.

University of Wyoming sounding data

From a file:

$ skewt uwyo -f uwyo-data.dat skewt.pdf

From the website for the most recent sounding from a station:

$ skewt uwyoweb --station 72251 skewt.pdf

From Numpy arrays

import numpy as np
import pymeteo.skewt as skewt

# prepare 1D arrays height (z), pressure (p), potential temperature (th), 
# water vapor mixing ratio (qv), winds (u and v) all of the same length.

skewt.plot(None, z, th, p, qv, u, v, 'output,pdf')

You can also choose to plot just the sounding, just the hodograph or plot each on on axes that you define. For details see the implementation of pymeteo.skewt.plot() and the pyMeteo documentation.

pymeteo's People

Contributors

cwebster2 avatar dependabot-preview[bot] avatar marcelooyaneder avatar scollis avatar yvzheng avatar

Stargazers

 avatar  avatar  avatar  avatar  avatar  avatar  avatar  avatar  avatar  avatar  avatar  avatar  avatar  avatar  avatar  avatar  avatar  avatar  avatar  avatar  avatar  avatar  avatar  avatar  avatar  avatar  avatar  avatar  avatar  avatar  avatar  avatar  avatar  avatar  avatar  avatar  avatar  avatar  avatar  avatar  avatar  avatar  avatar  avatar  avatar  avatar  avatar  avatar  avatar  avatar  avatar  avatar  avatar  avatar  avatar  avatar  avatar  avatar  avatar  avatar  avatar  avatar  avatar  avatar  avatar  avatar  avatar  avatar  avatar  avatar  avatar  avatar  avatar  avatar  avatar

Watchers

 avatar  avatar  avatar  avatar  avatar  avatar  avatar  avatar  avatar  avatar

pymeteo's Issues

Replacing quit() with raising an Exception

I'm using pymeteo for 5000+ measurements. Unfortunately there are sometimes calculation, where I'm receiving 'Error: lack of convergence, stopping iteration' and because of the 'quit()' in the next line the programm stops running because of one wrong calculation.
I would appreciate a Replacement of quit() with the raising an Exception, which my programm can catch and continue the calculation.

line 401 of thermo.py

if i > 100:
    print('Error: lack of convergence, stopping iteration')
    quit()

WRF sounding plot

Hi! I'm new to python, repositories and all this world.

I've managed to setup anaconda perfectly, but there are some problems after this repository install.

First, every command window I open prompts this message:

Traceback (most recent call last):
File "", line 3, in
ImportError: No module named conda

Anyway, I can run the command perfectly, but this happens:

Error calculating sounding stats, storm motion marker not plotted
Error calculating storm motion

The sounding is plotted, and almost everythin is OK, excep for SRH: no SRH is shown.

Any ideas?

Thanks!

upside down sounding

Sounding is plotting upside down for me.
version 1.0.1
skewt uwyo -f testdata/uwyo-sounding.dat skewt.png
skewt

Travis CI

Once tests are written, setup CI for building / testing on various python versions.

full circle hodograph

It would be appreciated if you could spend some time providing a full circle hodograph with the WK82 analytic sounding. Thanks in advance.

SKEWT Error; "ImportError: No module named h5py"

Hello,
I installed the pyMeteo and upgraded my python. the h5py exist in my system. however the skews command can not be run as it can not find the h5py. I paste the message bellow. Please advise me how to resolve the issue.

Traceback (most recent call last):
File "/Library/Frameworks/Python.framework/Versions/2.7/bin/skewt", line 11, in
from pymeteo import skewt
File "/Library/Frameworks/Python.framework/Versions/2.7/lib/python2.7/site-packages/pymeteo/skewt.py", line 128, in
import h5py
ImportError: No module named h5py

Thanks
Atoossa

Latest commit breaking compatability with python2 (2.7)

I have been trying your code for every feature you include. The latest commit (download from net and plot skewt) breaks the comparability with the python version 2. All bugs I have reported are based on the test conducted on python 2 only.

I have found that it is due to the spiting of urllib package in python3. The same package was urllib2 in python 2. To overcome this issue I included these lines for import urllib.request as request:-

import urllib2
from urllib2 import Request

This time script run scussesfully but again struck at skewt.py script . Here is the terminal output for review:-

skewt uwyoweb skewt.pdf --station 72251           
Traceback (most recent call last):
  File "/usr/bin/skewt", line 159, in <module>
    main()
  File "/usr/bin/skewt", line 128, in main
    skewt.plot_sounding_data_uwyo(None, args.output, stationID=args.station)
  File "/usr/lib/python2.7/site-packages/pymeteo/skewt.py", line 482, in plot_sounding_data_uwyo
    date = datetime.datetime.now(datetime.timezone.utc)
AttributeError: 'module' object has no attribute 'timezone'

I don't know what causes the problem. You may look into this issue as most of the scientific communities are conservative and not likely to use python 3 for everything.

Probably you can use the try statement for those missing/ depreciated modules which are not present in python 2 and print message to use python 3. That way other features are not affected by it.

On a side note, I really appreciate the kind of dedication you show it to this package.

Missing Title and legend

  1. I have attached the latest skewt diagram prepared after latest commit. It is actually missing the title (either lat & lon or the location name).
  2. There is also no legend in the diagram for the curves (temps). How does one know that red is dry bulb and green is something else?
  3. The overall diagram looks good but lot of space wasted in the margin itself. Therefore, please reduce the side, bottom and top margin if possible.
  4. My suggestion is that title can come in top, legend can come where presently hodograph text is present and hodograph text can be moved right (below most usable parcel column or 500 m mixed layer parcel).

test

Include sample sounding data file.

I have mentioned in one of my earlier issue. I think you must include a sample sounding data file explicitly. So that user does not end up with error log. I have tested your package with freely available actual upper air data from http://weather.uwyo.edu/upperair/sounding.html. Sample data for 72318 RNK Blacksburg is attached below (changed the extension as github did not allow the '.dat' file extension):-
sounding.txt

Then I applied your sample command listed in Readme file and I received an error message. Log is here:-

$ skewt -f docs/data/sounding.dat -o skewt.pdf
Traceback (most recent call last):
  File "/usr/bin/skewt", line 35, in <module>
    skewt.plot_sounding_data(options.fname, out)
  File "/usr/lib/python2.7/site-packages/pymeteo/skewt.py", line 418, in plot_sounding_data
    p0, th0, qv0 = surface.split()
ValueError: need more than 1 value to unpack

Error producing pdf skewt plot from WRF output

As reported by wxguy in #6 the following error was produced while trying to produce a PDF skewt plot:

$ skewt-wrf -d ../old_wrf_plotting_scripts-master/wrfout_.nc --lat 9.6 --lon 76 -t 1 -o test.pdf
2015-10-13_01:00:00
('lats/lons dims: ', (60, 102))
('LAT ', 9.6, ': ', 28, ': ', 9.6010742)
('LON ', 76.0, ': ', 33, ': ', 75.992729)
(0, 0, 0.0, 1, 301.15186, 0.27468511, -1.4772046, 101136.3, 0.018818898)
[ 101136.3046875   100797.53125      99971.3984375    98852.7265625
   97445.40625      95696.921875     93512.765625     90892.9765625
   87042.9609375    82160.171875     77285.2421875    72418.78125
   65817.609375     57898.98046875   50776.41796875   44379.95703125
   38650.20703125   33528.41015625   28959.16796875   24892.08789062
   21281.29101562   18085.21289062   15265.07910156   12785.54492188
   10613.87304688    8720.015625      7076.27685547    5656.82861328]
[     0.             30.11538696    103.48806763    203.42379761
    330.5630188     490.24029541    693.01287842    941.31762695
   1318.57165527   1814.96191406   2335.54150391   2883.32788086
   3686.47680664   4731.38720703   5778.36328125   6828.95898438
   7882.62792969   8936.20800781   9988.45214844  11039.34277344
  12088.88476562  13136.5234375   14182.37109375  15231.70117188
  16300.1171875   17422.47265625  18644.11523438  19990.46679688]
[ 301.15185547  301.07305908  301.06292725  301.06689453  301.07958984
  301.44128418  302.18136597  303.00375366  304.48361206  306.68695068
  309.28460693  311.88391113  315.49234009  320.8661499   325.97399902
  331.90634155  336.73202515  340.33770752  343.7522583   346.53143311
  349.15374756  350.74981689  352.4848938   356.46813965  367.31921387
  392.98141479  431.60040283  469.5869751 ]
[ 0.27468511  0.2141853   0.22274287  0.23309466  0.23982641 -0.01485114
 -0.97769964 -2.35944128 -4.14654589 -5.00909996 -4.40022182 -2.62400174
 -0.22619     0.33385721 -1.4100827  -2.03568912 -2.70660758 -5.46401072
 -9.2687645  -8.66651917 -7.31954575 -6.34951162 -6.35857153 -8.59183216
 -8.30127144 -2.01154876  6.34280682  8.49809265]
[-1.47720456 -1.48186922 -1.46820331 -1.43099642 -1.36923695 -1.0809679
 -0.28034401  0.72824627  1.52775264  1.48237514  1.11611152  0.87334806
 -0.24181348 -1.43732142 -1.36976671 -1.13704371 -1.53739798 -1.06609881
 -0.69038689 -3.56384349 -3.63325047 -1.63354123  0.41438103 -0.34079829
 -1.45487368 -0.09732136  2.0640626   0.21578003]
[ 101136.3046875   100797.53125      99971.3984375    98852.7265625
   97445.40625      95696.921875     93512.765625     90892.9765625
   87042.9609375    82160.171875     77285.2421875    72418.78125
   65817.609375     57898.98046875   50776.41796875   44379.95703125
   38650.20703125   33528.41015625   28959.16796875   24892.08789062
   21281.29101562   18085.21289062   15265.07910156   12785.54492188
   10613.87304688    8720.015625      7076.27685547    5656.82861328]
[  1.88188981e-02   1.77619401e-02   1.75294727e-02   1.73988324e-02
   1.72312222e-02   1.64061189e-02   1.58520155e-02   1.56307649e-02
   1.46574536e-02   1.29882134e-02   1.11317541e-02   9.67478659e-03
   8.42783041e-03   6.21006219e-03   5.10617020e-03   3.67291085e-03
   2.33886018e-03   1.26966520e-03   6.03648543e-04   3.04679823e-04
   1.29808279e-04   4.62024655e-05   1.36182225e-05   4.43334011e-06
   2.71074146e-06   3.43757733e-06   1.51017355e-06   9.97768666e-07]
Traceback (most recent call last):
  File "/usr/bin/skewt-wrf", line 27, in <module>
    skewt.plot_wrf(base,lat,lon,time,out)
  File "/usr/lib/python2.7/site-packages/pymeteo/skewt.py", line 327, in plot_wrf
    plot(0. ,0. ,z, t, th, p, qv, u, v, filename, output)
  File "/usr/lib/python2.7/site-packages/pymeteo/skewt.py", line 580, in plot
    plt.savefig(output, dpi=300,bbox_inches=0)
  File "/usr/lib/python2.7/site-packages/matplotlib/pyplot.py", line 688, in savefig
    res = fig.savefig(*args, **kwargs)
  File "/usr/lib/python2.7/site-packages/matplotlib/figure.py", line 1539, in savefig
    self.canvas.print_figure(*args, **kwargs)
  File "/usr/lib/python2.7/site-packages/matplotlib/backends/backend_qt5agg.py", line 196, in print_figure
    FigureCanvasAgg.print_figure(self, *args, **kwargs)
  File "/usr/lib/python2.7/site-packages/matplotlib/backend_bases.py", line 2230, in print_figure
    **kwargs)
  File "/usr/lib/python2.7/site-packages/matplotlib/backends/backend_pdf.py", line 2536, in print_pdf
    self.figure.draw(renderer)
  File "/usr/lib/python2.7/site-packages/matplotlib/artist.py", line 61, in draw_wrapper
    draw(artist, renderer, *args, **kwargs)
  File "/usr/lib/python2.7/site-packages/matplotlib/figure.py", line 1133, in draw
    func(*args)
  File "/usr/lib/python2.7/site-packages/matplotlib/artist.py", line 61, in draw_wrapper
    draw(artist, renderer, *args, **kwargs)
  File "/usr/lib/python2.7/site-packages/matplotlib/axes/_base.py", line 2304, in draw
    a.draw(renderer)
  File "/usr/lib/python2.7/site-packages/matplotlib/artist.py", line 61, in draw_wrapper
    draw(artist, renderer, *args, **kwargs)
  File "/usr/lib/python2.7/site-packages/matplotlib/text.py", line 796, in draw
    ismath=ismath, mtext=mtext)
  File "/usr/lib/python2.7/site-packages/matplotlib/backends/backend_pdf.py", line 2077, in draw_text
    return draw_text_simple()
  File "/usr/lib/python2.7/site-packages/matplotlib/backends/backend_pdf.py", line 2006, in draw_text_simple
    self._setup_textpos(x, y, angle)
  File "/usr/lib/python2.7/site-packages/matplotlib/backends/backend_pdf.py", line 1770, in _setup_textpos
    self.file.output(x - oldx, y - oldy, Op.textpos)
  File "/usr/lib/python2.7/site-packages/matplotlib/backends/backend_pdf.py", line 589, in output
    self.write(fill([pdfRepr(x) for x in data]))
  File "/usr/lib/python2.7/site-packages/matplotlib/backends/backend_pdf.py", line 149, in pdfRepr
    raise ValueError("Can only output finite numbers in PDF")
ValueError: Can only output finite numbers in PDF

unit testing

Write tests for the dynamics / thermo functions. Write image comparison tests for skewt, hodograph, etc.

pyMeteo: Error calculating sounding stats, datablock omitted....

Command:

skewt uwyoweb --station 10618 skewt.jpg

pyMeteo throws an error:

2019 4 25 0 10618
//anaconda2/envs/pytroll/lib/python3.6/site-packages/matplotlib/cbook/init.py:424: MatplotlibDeprecationWarning:
Passing one of 'on', 'true', 'off', 'false' as a boolean is deprecated; use an actual boolean (True/False) instead.
warn_deprecated("2.2", "Passing one of 'on', 'true', 'off', 'false' as a "
Error calcualting sounding stats, datablock omitted
posx and posy should be finite values

But file is made...just for info.

Index error

Traceback (most recent call last):
File "/usr/local/bin/skewt", line 4, in
import('pkg_resources').run_script('pymeteo==1.0.1', 'skewt')
File "/usr/lib/python3/dist-packages/pkg_resources/init.py", line 658, in run_script
self.require(requires)[0].run_script(script_name, ns)
File "/usr/lib/python3/dist-packages/pkg_resources/init.py", line 1438, in run_script
exec(code, namespace, namespace)
File "/usr/local/lib/python3.6/dist-packages/pymeteo-1.0.1-py3.6.egg/EGG-INFO/scripts/skewt", line 160, in
main()
File "/usr/local/lib/python3.6/dist-packages/pymeteo-1.0.1-py3.6.egg/EGG-INFO/scripts/skewt", line 99, in main
skewt.plot_wrf(args.f, args.lat, args.lon, args.t, args.output)
File "/usr/local/lib/python3.6/dist-packages/pymeteo-1.0.1-py3.6.egg/pymeteo/skewt.py", line 366, in plot_wrf
p_surface = f.variables['PSFC'][time,j,i]
File "netCDF4/_netCDF4.pyx", line 3961, in netCDF4._netCDF4.Variable.getitem
File "netCDF4/_netCDF4.pyx", line 4796, in netCDF4._netCDF4.Variable._get
IndexError

Cythonize where possible

For the pure math functions and in particular the CAPE calculation, transition to cython for speed enhancements.

Plot SkewT directly from WRF output file.

Is it possible to include a feature to plot SkewT diagram directly from WRF output file? This can be something like provide lat, long and wrfout.nc to get SkewT plot.

If implemented, this would be a great feature.

Unify skewt plotting and update plotting functions

Unify all CLI skew-t plotting into a single script rather than the growing number of scripts per input data type. Update plotting functions in pymeteo.skewt to use the new plot() function instead of the old one and update the plot titles to only use file basename as was done in the WRF plot.

  • Add CLI option for title to specify a custom title rather than data filename
  • Add WRF capability into unified skewt script
  • Add CM1 capability into unified skewt script
  • Add CM1/HDF5 capability into unified skewt script
  • Add uwyo capability into unified skewt script
  • Add CSV capability into unified skewt script
  • Update CSV plotting to new plot routine
  • Update CM1 plotting to new plot routine
  • Update CM1/HDF5 plotting to new plot routine
  • Update CM1/WRF init data plotting to new plot routine

Invalid syntax

I am facing a error invalid syntax when running pymeteo with wrf out put:
skewt-wrf -d /home/sarr/wrfout_.nc --lat 14 --lon -17 -t 1 -o test.pdf
^
SyntaxError: invalid syntax

it looks pointing to the lat value, how ftix?

Another question, is it possible to only output the extracted sounding data only?

raise AttributeError('Unknown property %s' % k)

Can't get past this error [whatever it means], regardless of the matplotlib version used. Any ideas on how to fix this?. Thanks!

pyMeteo(1234)>bin/skewt wrf wrf-skewt.pdf --lat 17.0 --lon -17.0 -f ./wrfout_d02_2017-08-28_03:00:00
17.0 N, 17.0 W 0.0 2017-08-28_03:00:00 300.3474 -0.15690103 -3.7380385 101148.8 0.020877775
Traceback (most recent call last):
File "bin/skewt", line 4, in
import('pkg_resources').run_script('pymeteo==1.0.3', 'skewt')
File "/lustre01/vol0/1163ow/pyMeteo/lib/python3.5/site-packages/pkg_resources/init.py", line 650, in run_script
self.require(requires)[0].run_script(script_name, ns)
File "/lustre01/vol0/1163ow/pyMeteo/lib/python3.5/site-packages/pkg_resources/init.py", line 1446, in run_script
exec(code, namespace, namespace)
File "/lustre01/vol0/1163ow/pyMeteo/lib/python3.5/site-packages/pymeteo-1.0.3-py3.5.egg/EGG-INFO/scripts/skewt", line 160, in
main()
File "/lustre01/vol0/1163ow/pyMeteo/lib/python3.5/site-packages/pymeteo-1.0.3-py3.5.egg/EGG-INFO/scripts/skewt", line 99, in main
skewt.plot_wrf(args.f, args.lat, args.lon, args.t, args.output)
File "/lustre01/vol0/1163ow/pyMeteo/lib/python3.5/site-packages/pymeteo-1.0.3-py3.5.egg/pymeteo/skewt.py", line 404, in plot_wrf
plot(x, z, th, p, qv, u, v, output, t, title)
File "/lustre01/vol0/1163ow/pyMeteo/lib/python3.5/site-packages/pymeteo-1.0.3-py3.5.egg/pymeteo/skewt.py", line 690, in plot
plot_sounding_axes(ax1)
File "/lustre01/vol0/1163ow/pyMeteo/lib/python3.5/site-packages/pymeteo-1.0.3-py3.5.egg/pymeteo/skewt.py", line 726, in plot_sounding_axes
draw_isotherms(axes)
File "/lustre01/vol0/1163ow/pyMeteo/lib/python3.5/site-packages/pymeteo-1.0.3-py3.5.egg/pymeteo/skewt.py", line 1142, in draw_isotherms
axes.semilogy(T + skew(plevs_plot), plevs_plot, base=math.e, color = lc_major, linewidth= lw_major)
File "/lustre01/vol0/1163ow/pyMeteo/lib/python3.5/site-packages/matplotlib/axes/_axes.py", line 1844, in semilogy
l = self.plot(*args, **kwargs)
File "/lustre01/vol0/1163ow/pyMeteo/lib/python3.5/site-packages/matplotlib/init.py", line 1810, in inner
return func(ax, *args, **kwargs)
File "/lustre01/vol0/1163ow/pyMeteo/lib/python3.5/site-packages/matplotlib/axes/_axes.py", line 1611, in plot
for line in self._get_lines(*args, **kwargs):
File "/lustre01/vol0/1163ow/pyMeteo/lib/python3.5/site-packages/matplotlib/axes/_base.py", line 393, in _grab_next_args
yield from self._plot_args(this, kwargs)
File "/lustre01/vol0/1163ow/pyMeteo/lib/python3.5/site-packages/matplotlib/axes/_base.py", line 383, in _plot_args
seg = func(x[:, j % ncx], y[:, j % ncy], kw, kwargs)
File "/lustre01/vol0/1163ow/pyMeteo/lib/python3.5/site-packages/matplotlib/axes/_base.py", line 288, in _makeline
seg = mlines.Line2D(x, y, **kw)
File "/lustre01/vol0/1163ow/pyMeteo/lib/python3.5/site-packages/matplotlib/lines.py", line 410, in init
self.update(kwargs)
File "/lustre01/vol0/1163ow/pyMeteo/lib/python3.5/site-packages/matplotlib/artist.py", line 916, in update
ret = [_update_property(self, k, v) for k, v in props.items()]
File "/lustre01/vol0/1163ow/pyMeteo/lib/python3.5/site-packages/matplotlib/artist.py", line 916, in
ret = [_update_property(self, k, v) for k, v in props.items()]
File "/lustre01/vol0/1163ow/pyMeteo/lib/python3.5/site-packages/matplotlib/artist.py", line 912, in _update_property
raise AttributeError('Unknown property %s' % k)
AttributeError: Unknown property base

Add automated tests

Testing is manual on my part currently. This project needs unit and acceptance tests. Help out!

Recommend Projects

  • React photo React

    A declarative, efficient, and flexible JavaScript library for building user interfaces.

  • Vue.js photo Vue.js

    ๐Ÿ–– Vue.js is a progressive, incrementally-adoptable JavaScript framework for building UI on the web.

  • Typescript photo Typescript

    TypeScript is a superset of JavaScript that compiles to clean JavaScript output.

  • TensorFlow photo TensorFlow

    An Open Source Machine Learning Framework for Everyone

  • Django photo Django

    The Web framework for perfectionists with deadlines.

  • D3 photo D3

    Bring data to life with SVG, Canvas and HTML. ๐Ÿ“Š๐Ÿ“ˆ๐ŸŽ‰

Recommend Topics

  • javascript

    JavaScript (JS) is a lightweight interpreted programming language with first-class functions.

  • web

    Some thing interesting about web. New door for the world.

  • server

    A server is a program made to process requests and deliver data to clients.

  • Machine learning

    Machine learning is a way of modeling and interpreting data that allows a piece of software to respond intelligently.

  • Game

    Some thing interesting about game, make everyone happy.

Recommend Org

  • Facebook photo Facebook

    We are working to build community through open source technology. NB: members must have two-factor auth.

  • Microsoft photo Microsoft

    Open source projects and samples from Microsoft.

  • Google photo Google

    Google โค๏ธ Open Source for everyone.

  • D3 photo D3

    Data-Driven Documents codes.