cp4cds / cmip6_range_check_old Goto Github PK
View Code? Open in Web Editor NEWCMIP6 Data Range Check: extract and evaluate information about range of data values in CMIP6 datasets.
CMIP6 Data Range Check: extract and evaluate information about range of data values in CMIP6 datasets.


These files have area fractions in the range 0-1 ... it should be 0-100%.
sftlf_fx_E3SM-1-0_piControl_r1i1p1f1_gr.nc
sftlf_fx_E3SM-1-1-ECA_piControl_r1i1p1f1_gr.nc
sftlf_fx_E3SM-1-1_piControl_r1i1p1f1_gr.nc
Contact: Dave Bader ([email protected]).
The use of land_area_fraction for "Percentage of the grid cell occupied by land (including lakes)" can cause confusion, but this should be a percentage.
@qzhu-lbl : is this an issue that you could look at?
There are extreme high values (9.999e+30) of uo and vo in these datasets:
hdl:21.14100/14e98efa-a5ee-35db-b448-852b634a41c8
CMIP6.CMIP.NASA-GISS.GISS-E2-1-H.historical.r1i1p1f1.Omon.uo.gr.v20190403
hdl:21.14100/b41584e7-2cfe-3d23-b5ca-f7301c2a7325
CMIP6.CMIP.NASA-GISS.GISS-E2-1-H.historical.r1i1p1f1.Omon.vo.gr.v20190403
Contact: Kenneth Lo ([email protected])
The following cell methods are referenced in the WG1 priority variables:
Weighted Time Mean on Ice Sheet::area: time: mean where ice_sheet
Daily Maximum::area: mean time: maximum within days time: mean over days
Partial Mean over Ice-free sea::area: mean where ice_free_sea over sea time: mean
Fixed Area Mean::area: mean
Weighted Time Mean in over Snow and Ice covered Land::area: time: mean where snow (comment: mask=snc)
Point-Instantaneous::area: point time: point
Basin Zonal Mean on Model Grid::time: mean grid_longitude: mean
Area Mean Instantaneous::area: mean time: point
Fixed Area Sum::area: sum
Time Mean over Land::area: mean where land time: mean
Time Maximum::area: mean time: maximum
Weighted Time Mean on Sea-ice::area: time: mean where sea_ice (comment: mask=siconc)
Mean Diurnal Cycle::area: mean time: mean within days time: mean over days
Annual Climatology::area: mean time: mean within years time: mean over years
Snow Mass Weighted::area: mean where land time: mean (with samples weighted by snow mass)
Time Mean::time: mean
Instantaneous::time: point
Area and Time Mean::area: time: mean
Time Mean contribution from Land::area: mean where land over all_area_types time: mean
Time Mean of Area Sum::area: sum where sea time: mean
Area Mean over Sea::area: mean where sea
Time Mean over Sea::area: mean where sea time: mean
Basin Zig-Zag Zonal Sum::longitude: sum (comment: basin sum [along zig-zag grid path]) depth: sum time: mean
Zonal Time Mean::longitude: mean time: mean
Instantaneous over Sea::area: mean where sea time: point
Temporal Minimum::area: mean time: minimum
Fixed Area Mean::area: mean where land
Weighted Time Mean on Landuse Tiles::area: time: mean where sector
Instantaneous Mean over Land::area: mean where land time: point
Daily Minimum::area: mean time: minimum within days time: mean over days
7 orography files from CMCC have orography set to missing over ocean, rather than height of the surface.
contact = "T. Lovato"
/badc/cmip6/data/CMIP6/CMIP/CMCC/CMCC-CM2-HR4/historical/r1i1p1f1/fx/orog/gn/v20200904/orog_fx_CMCC-CM2-HR4_historical_r1i1p1f1_gn.nc
/badc/cmip6/data/CMIP6/CMIP/CMCC/CMCC-CM2-SR5/historical/r1i1p1f1/fx/orog/gn/v20200616/orog_fx_CMCC-CM2-SR5_historical_r1i1p1f1_gn.nc
/badc/cmip6/data/CMIP6/ScenarioMIP/CMCC/CMCC-CM2-SR5/ssp126/r1i1p1f1/fx/orog/gn/v20200717/orog_fx_CMCC-CM2-SR5_ssp126_r1i1p1f1_gn.nc
/badc/cmip6/data/CMIP6/ScenarioMIP/CMCC/CMCC-CM2-SR5/ssp245/r1i1p1f1/fx/orog/gn/v20200617/orog_fx_CMCC-CM2-SR5_ssp245_r1i1p1f1_gn.nc
/badc/cmip6/data/CMIP6/ScenarioMIP/CMCC/CMCC-CM2-SR5/ssp370/r1i1p1f1/fx/orog/gn/v20200622/orog_fx_CMCC-CM2-SR5_ssp370_r1i1p1f1_gn.nc
/badc/cmip6/data/CMIP6/ScenarioMIP/CMCC/CMCC-CM2-SR5/ssp585/r1i1p1f1/fx/orog/gn/v20200622/orog_fx_CMCC-CM2-SR5_ssp585_r1i1p1f1_gn.nc
/badc/cmip6/data/CMIP6/CMIP/CMCC/CMCC-ESM2/historical/r1i1p1f1/fx/orog/gn/v20210114/orog_fx_CMCC-ESM2_historical_r1i1p1f1_gn.nc
There are surprisingly large thicknesses in the dataset below ... up to 4300m. Is this really the case?
hdl:21.14100/1d1e1702-57fd-318a-922f-a92a9ce94200
CMIP6.CMIP.NCC.NorESM2-MM.historical.r1i1p1f1.Omon.thkcello.gn.v20191108
Contact: [email protected]
The CMIP6 models have very low variability in the troposphere ... this field essentially contains information for the stratosphere only. Validity testing should be geared to this.
https://errata.es-doc.org/static/view.html?uid=84695016-705e-9ac7-a585-e3d158e38004
AS-RCEC_TaiESM1_historical :: Dr. Wei-Liang Lee ([email protected])
Min: 154.134765625 -- 160.0
CMIP6.CMIP.AS-RCEC.TaiESM1.historical.r1i1p1f1.day.tasmin.gn.v20200218 -- hdl:21.14100/54762152-1793-316d-acbb-1374298d9152
There is a newer version of this file published on June 26th .. Check was run on old data (before June 26).
The data has large areas set to 9.969209968386869e+36 which should probably be missing data where pressure surfaces intersect the Earth's surface. This applies to:
Most models fall within a clear range of 170K to 333K (see overview table and whiskers plot) which is broadly consistent with the extremes of observed temperature (56.7 deg C for WMO verified measurements, but up to 70 deg C for satellite measurements).
One model, MIROC6, has a significantly higher maximum at 349.7K -- this model starts to stand out from others at the 99th percentile of the temperature frequency distribution.
One model, SAM0-UNICON, has a significantly lower minimum at 141K, substantially below the coldest recorded temperatures (-90 deg C at Vostok)
The expected range of values for some variables may depend on the coordinates. E.g. ocean cell thickness may be very large in isopycnal models (#26).
Building such dependencies into the specification of ranges is not easy.
Could be done if we have checks which apply to: (1) the physical variable (e.g. sftlf ), (2) the CMOR variable request (e.g. tas.Amon) and (3) an output variable (e.g. thkcello.Omon.[isopycnal,....] -- but we don't have a vocabulary to refer to the latter.
The hfds_Omon_MRI-ESM2-0_historical_r1i1p1f1_gn_185001-201412.nc file in v20191205 is full of NaN values.
hdl:21.14100/564cce55-e3c1-4241-8c17-3489c6612be1
Version: v20191205
Contact: [email protected]
Automated creation of a template.
esgf_ds_id, pid, contact, known = metam[m]
                pid_link = "[%s](http://hdl.handle.net/%s)" % (pid,pid[4:])
                oo.write( '%s :: %s\n' % (m,contact) )
Max: 358.6103515625 -- 350.0
CMIP6.CMIP.MOHC.HadGEM3-GC31-LL.historical.r1i1p1f3.day.tasmax.gn.v20190624 --
MOHC_HadGEM3-GC31-MM_historical :: None
Max: 359.964599609375 -- 350.0
CMIP6.CMIP.MOHC.HadGEM3-GC31-MM.historical.r1i1p1f3.day.tasmax.gn.v20191207 --
MOHC_UKESM1-0-LL_historical :: None
Max: 366.17529296875 -- 350.0
CMIP6.CMIP.MOHC.UKESM1-0-LL.historical.r10i1p1f2.day.tasmax.gn.v20191213 --
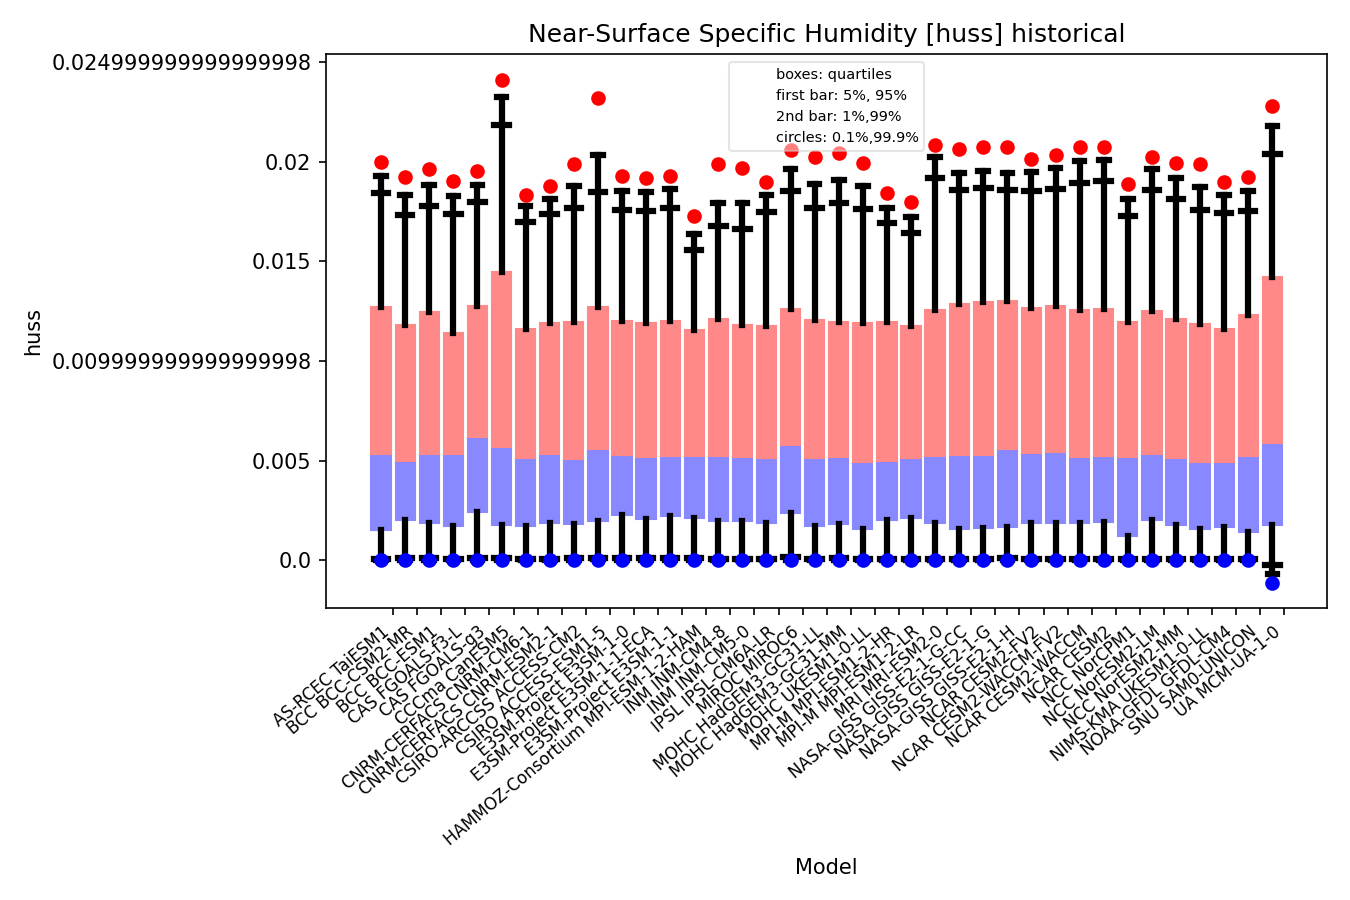
The multi-model ensemble for specific humidity has both unrealistic high values (up to 134 g/kg which would be saturated at around 65 degrees Celsius) and negative values (down to -9 g/kg). The majority of models have maxima between 28 g/kg and 38 g/kg (corresponding roughly to saturation at temperatures of 30 to 35 deg C. The rest are at 48, 51, 61, 77 and 131 g kg-1.
The BCC-CSM2-MR model which has the highest recorded specific humidity also has a maximum surface temperature of 327K (54 deg C) ... this is consistent with observed local maximum desert temperatures of around 57 deg C .. but should be in a dry area.
There is a sign error in this dataset, giving the flux negative values rather than the expected positive values.
Multiple cases of data be submitted with values as fraction rather than percentage
Datasets from 3 instistitutions with factor 100 in scaling. https://docs.google.com/spreadsheets/d/1NKuZuIVHTkSl1Z3Gwz2iOxfPQbdh91xB_ZKkDh3_qZI/edit#gid=921885671
SNU_SAM0-UNICON_historical :: Sungsu Park ([email protected]), Jihoon Shin ([email protected])
Min: 139.2387237548828 -- 140.0
CMIP6.CMIP.SNU.SAM0-UNICON.historical.r1i1p1f1.day.tasmin.gn.v20190323 -- hdl:21.14100/838c237a-beb5-3a95-9552-71b03a51ec45
The model has an unstructured grid ... this currently breaks the range checking software because there is a single dimension for latitude and longitude combined. Fix needed in the code ....
Also, a C3S issue ...
The software needs to use appropriate logging.
Approach
A class defined in the local_utilities module can be used to generate the required logs using the logging module with a set of standard settings.
Capture of numpy warnings: trying to do this via logging.captureWarnings().
These datasets have a range 0-1, it should be 0-100%
Part of #41 ; no errata
Datasets are all "replica only" .. no master copy.
(1) CAS_FGOALS-f3-L_historical :: Yongqiang Yu ([email protected]);Bian He([email protected])
This dataset has at least one field with constant zero values in the lowest level.
Min: 0.0 -- 200.0; MA Min: 0.0 -- 194.3
CMIP6.CMIP.CAS.FGOALS-f3-L.historical.r1i1p1f1.Amon.ta.gr.v20190927 -- hdl:21.14100/f2ed1509-1161-3e5f-836a-96559bbf5948
No errata report.
(2) E3SM-Project_E3SM-1-0_historical :: Dave Bader ([email protected])
Around 1% of grid points have values less than 13K.
Min: 6.34468014968159e-23 -- 200.0
CMIP6.CMIP.E3SM-Project.E3SM-1-0.historical.r2i1p1f1.Amon.ta.gr.v20190729 -- hdl:21.14100/f2ed1509-1161-3e5f-836a-96559bbf5948
(3) E3SM-Project_E3SM-1-1_historical :: Dave Bader ([email protected])
Many grid points set to 9.969209968386869e+36 in lowest level, and some in next level.
Max: 9.969209968386869e+36 -- 350.0
CMIP6.CMIP.E3SM-Project.E3SM-1-1.historical.r1i1p1f1.Amon.ta.gr.v20191211 -- hdl:21.14100/f2ed1509-1161-3e5f-836a-96559bbf5948
The Amon.sbl data switches from (time, j, i) to (time, lat,'lon).
/badc/cmip6/data/CMIP6/CMIP/EC-Earth-Consortium/EC-Earth3/historical/r2i1p1f1/Amon/sbl/gr/latest -> v20190408
hdl:21.14100/5eb7e19f-6cca-4d39-85b6-ac5b43652b15
e.g. data for 2007, hdl:21.14100/5eb7e19f-6cca-4d39-85b6-ac5b43652b15 has j, i form and and data for 1868, hdl:21.14100/5e2dcc64-5102-49c4-ac7a-f07500557c71, has the lat, lon form. It appears that some data has not been interpolated.
There are extreme values of monthly mean Sea Surface Height Above Geoid (zos) in these datasets:
hdl:21.14100/83911cb0-126c-3e5e-9b4c-7c40ee6981e6 CMIP6.CMIP.MIROC.MIROC6.historical.r1i1p1f1.Omon.zos.gn.v20181212
hdl:21.14100/a34c4040-1e94-32bf-a651-ea7a95c4498d
CMIP6.CMIP.NCC.NorCPM1.historical.r1i1p1f1.Omon.zos.gn.v20190914
Data go down to -15m in the MIROC6 data, and up to 10m in the NorCPM1 data. Other models in the CMIP6 ensemble give data values in the range -2.5m to 2.5m.
Errata: https://errata.es-doc.org/static/view.html?uid=ad9e4213-f254-e930-a143-030a4b0f8a32 deals with the duration of NCC.NorCPM1.historical, but does not deal with data values.
Contacts: miroc-errata@jamstec, [email protected]
The variable is positive by construction, it is the component of the longwave radiation which is propagating downwards, and measured positive in a downwards direction. Negative values are found in four EC-Earth datasets identified by ESGF id and handles below:
CMIP6.CMIP.EC-Earth-Consortium.EC-Earth3-AerChem.historical.r1i1p1f1.Amon.rlds.gr.v20200624: hdl:21.14100/1820eb8e-15b2-349b-a97b-effd99dd6f60
CMIP6.CMIP.EC-Earth-Consortium.EC-Earth3-Veg-LR.historical.r1i1p1f1.Amon.rlds.gr.v20200217: hdl:21.14100/f9117c34-6764-345d-9c5c-0c5f185b0c4e
CMIP6.ScenarioMIP.EC-Earth-Consortium.EC-Earth3.ssp434.r101i1p1f1.Amon.rlds.gr.v20200412: hdl:21.14100/8eb94b78-b44e-3d99-94c1-f715a935c013
CMIP6.ScenarioMIP.EC-Earth-Consortium.EC-Earth3.ssp534-over.r101i1p1f1.Amon.rlds.gr.v20200412: hdl:21.14100/1560865c-a150-3f46-b11c-e8445cff6aa1
Contact: from file: [email protected] ; from citation :
-- "van Noije", "[email protected]"
-- Veg: "Klaus Wyser", "[email protected]",
The percentage cloud cover (Amon.clt) for the FGOALS-f3-L historical simulation is provided as a fraction ranging from 0 to 1, rather than 0 to 100%.
No errata registered in ES-DOC
Yongqiang Yu ([email protected]); Bian He([email protected])
The datasets below have suspicious maximum values for Omon.fgco2: 16891 and 16194 W m-2 respectively, compared to maxima up to 360 W m-2 in the rest of the multi-model ensemble.
The two datasets showing this problem are:
hdl:21.14100/8d14b9ed-0c8a-3665-b0c9-5f2c21ed6e53
CMIP6.CMIP.NOAA-GFDL.GFDL-CM4.historical.r1i1p1f1.Omon.hfds.gn.v20180701
hdl:21.14100/d3025031-164f-3280-98f5-76c216b5aeb5
CMIP6.CMIP.NOAA-GFDL.GFDL-CM4.historical.r1i1p1f1.Omon.hfds.gr.v20180701
These datasets have data in the range 0-1, it should be 0-100%.
[Yongqiang Yu ([email protected]);Bian He([email protected])],
Bian He([email protected])]ac.cn)]
Part of #41 ; no errata.
See also #6
These data have Amon.clt in range 0-1: the variables is defined as a percentage and should be in range 0-100%.
CMIP6.CMIP.THU.CIESM.historical.r1i1p1f1.Amon.clt.gr.v20200417: hdl:21.14100/0c5d90ca-f3ef-3c51-9e3e-8138066b803d
CMIP6.ScenarioMIP.THU.CIESM.ssp126.r1i1p1f1.Amon.clt.gr.v20200417: hdl:21.14100/5f14ff96-90ae-3f13-8852-e8745ed95ee8
CMIP6.ScenarioMIP.THU.CIESM.ssp245.r1i1p1f1.Amon.clt.gr.v20200417: hdl:21.14100/0513a01f-7df3-3926-ae35-8675b81a54da
CMIP6.ScenarioMIP.THU.CIESM.ssp585.r1i1p1f1.Amon.clt.gr.v20200605: hdl:21.14100/adee640a-7af3-319f-8d83-ff93cd8cc230
Contact: [email protected],
[email protected]
Part of #41 ; no errata
Extreme values of near surface salinity, above 150, are found in the Gulf of Maracaibo (see img)
CMIP6.CMIP.CMCC.CMCC-CM2-HR4.historical.r1i1p1f1.Omon.sos.gn.v20200904: hdl:21.14100/59f427e2-c321-319a-a8dd-b416e41ef470 [T. Lovato]
Enrico Scoccimarro, [email protected], Alessio Bellucci, [email protected]
SImass (#36) : isolated points in the HadGEM3-GC31-MM data have extreme seaice thickness (above 1km in some cases). aised as an errata, but won't be fixed: https://errata.es-doc.org/static/view.html?uid=a6ccf92b-4fcf-bd5b-82db-65b227473569
The following variables from the E3SM-1-1-ECA historical simulation, r1i1p1f1, have at least one time slice with constant zero values (as shown in minimum mean absolute value = 0 ).
also: tauu
CMIP6/CMIP/E3SM-Project/E3SM-1-1-ECA/historical/r1i1p1f1/Amon/pr/gr/latest -> v20200127
For pr the file is pr_Amon_E3SM-1-1-ECA_historical_r1i1p1f1_gr_200001-200912.nc and the constant zero value is the first time slice in the file (January 2001).
Contact: Dave Bader ([email protected])
Tracking id: hdl:21.14100/9ba74950-c4bf-490f-9532-6d4316fcab2b
The pH range in the GFDL-CM4 historical simulation is 5.36 to 10.48, compared to a range of 6.15 to 9.00 across the whole of the remainder of the multi-model ensemble.
hdl:21.14100/b0aebf32-d7b2-3014-8152-a9a6f4e81bd5
CMIP6.CMIP.NOAA-GFDL.GFDL-CM4.historical.r1i1p1f1.Omon.ph.gr.v20180701
This dataset is mainly negative, with a small range of positive values. All other datasets are mainly positive with a small range of negative values.
Orography: all in range; CMCC models have oceanographic portion of field set to missing values.
[todo -- need to recreate json from shelve because one file has been corrupted while debugging jpprep_ranges.py]
There are negative values of salinity (so) and surface salinity (sos) in the two datasets listed below, in both cases the values go down to -0.1317 parts per thousand.
hdl:21.14100/6d2aaf83-ef2a-3639-81c4-6dbbe2e6340d
CMIP6.CMIP.MPI-M.MPI-ESM1-2-HR.historical.r1i1p1f1.Omon.sos.gn.v20190710
hdl:21.14100/f9486881-27e8-382c-957a-2b1deb82603f
CMIP6.CMIP.MPI-M.MPI-ESM1-2-HR.historical.r1i1p1f1.Omon.so.gn.v20190710
Hi @matthew-mizielinski -- there is some extreme simass, up to 1,079,022 kg m-2, in the following file:
simass_SImon_HadGEM3-GC31-MM_historical_r1i1p1f3_gn_195001-196912.nc
This corresponds to roughly 1 km of ice, which is way over typical sea-ice thicknesses.
In the field where this occurs (time index 12) the top 10 values are:
1079022.375, 373581.0,
137635.71875,
19360.947265625,
20775.708984375,
19298.5390625,
22692.072265625,
18134.05859375,
18045.474609375,
17616.9140625
It looks as though there is one extreme point, with a few other very high values. Something similar also occurs in at least one other time step (maximum 1022628 kg m-2 and time step 228).
This value is also extreme relative to the other CMIP6 models. There is one model that gets up to 100,000 kg m-2 and several over 30,000 kg m-2, but most have a maximum below 10,000 kg m-2.
A regular grid is not by the use of gr: actual grid for uo_Omon_NorESM2-LM_historical_r1i1p1f1_gr_185001-185912.nc is tripolar.
	double latitude(j, i) ;
		latitude:standard_name = "latitude" ;
		latitude:long_name = "latitude" ;
		latitude:units = "degrees_north" ;
		latitude:missing_value = 1.e+20 ;
		latitude:_FillValue = 1.e+20 ;
		latitude:bounds = "vertices_latitude" ;
	double longitude(j, i) ;
		longitude:standard_name = "longitude" ;
		longitude:long_name = "longitude" ;
		longitude:units = "degrees_east" ;
		longitude:missing_value = 1.e+20 ;
		longitude:_FillValue = 1.e+20 ;
		longitude:bounds = "vertices_longitude" ;
	double vertices_latitude(j, i, vertices) ;
		vertices_latitude:units = "degrees_north" ;
		vertices_latitude:missing_value = 1.e+20 ;
		vertices_latitude:_FillValue = 1.e+20 ;
	double vertices_longitude(j, i, vertices) ;
		vertices_longitude:units = "degrees_east" ;
		vertices_longitude:missing_value = 1.e+20 ;
		vertices_longitude:_FillValue = 1.e+20 ;
	float uo(time, lev, j, i) ;
		uo:standard_name = "sea_water_x_velocity" ;
The ssp126, ssp245 and ssp585 simulations from CIESM have negative surface salinity (Omon.sos). In the extreme case (time index 232 in v20200220/sos_Omon_CIESM_ssp126_r1i1p1f1_gn_206501-210012.nc, the values go down to -11. In this case they are concentrated around the Amazon delta (image).
CMIP6.ScenarioMIP.THU.CIESM.ssp126.r1i1p1f1.Omon.sos.gn.v20200220: hdl:21.14100/e1acb0df-4ed4-3fee-9a4b-fe7036a4fa43
CMIP6.ScenarioMIP.THU.CIESM.ssp245.r1i1p1f1.Omon.sos.gn.v20200220: hdl:21.14100/11cd6924-5288-31e7-b2e1-57a40cd59762
CMIP6.ScenarioMIP.THU.CIESM.ssp585.r1i1p1f1.Omon.sos.gn.v20200220: hdl:21.14100/cab42a0d-5741-3be2-9816-b3b138769690
Contacts: [email protected]; Huang, Wenyu, [email protected].
hdl:21.14100/e628495d-11db-388b-b8c6-7dc8e5e12aec
CMIP6.CMIP.NOAA-GFDL.GFDL-CM4.historical.r1i1p1f1.Omon.fgco2.gr.v20180701
Minimum value: -9.87e-8 kg m-2 s-1, compared to minimum of -9e-9 in the rest of the multi-model ensemble.
See also #21
The daily near surface relative humidity data (hurs) archived for CMIP6 contains many unrealistic data values, with most of the models having 5% of grid points recording relative humidity above 100%.
This problem in CMIP5 files was discussed by [Ruosteenoja et al (https://agupubs.onlinelibrary.wiley.com/doi/full/10.1002/2017JD026909).
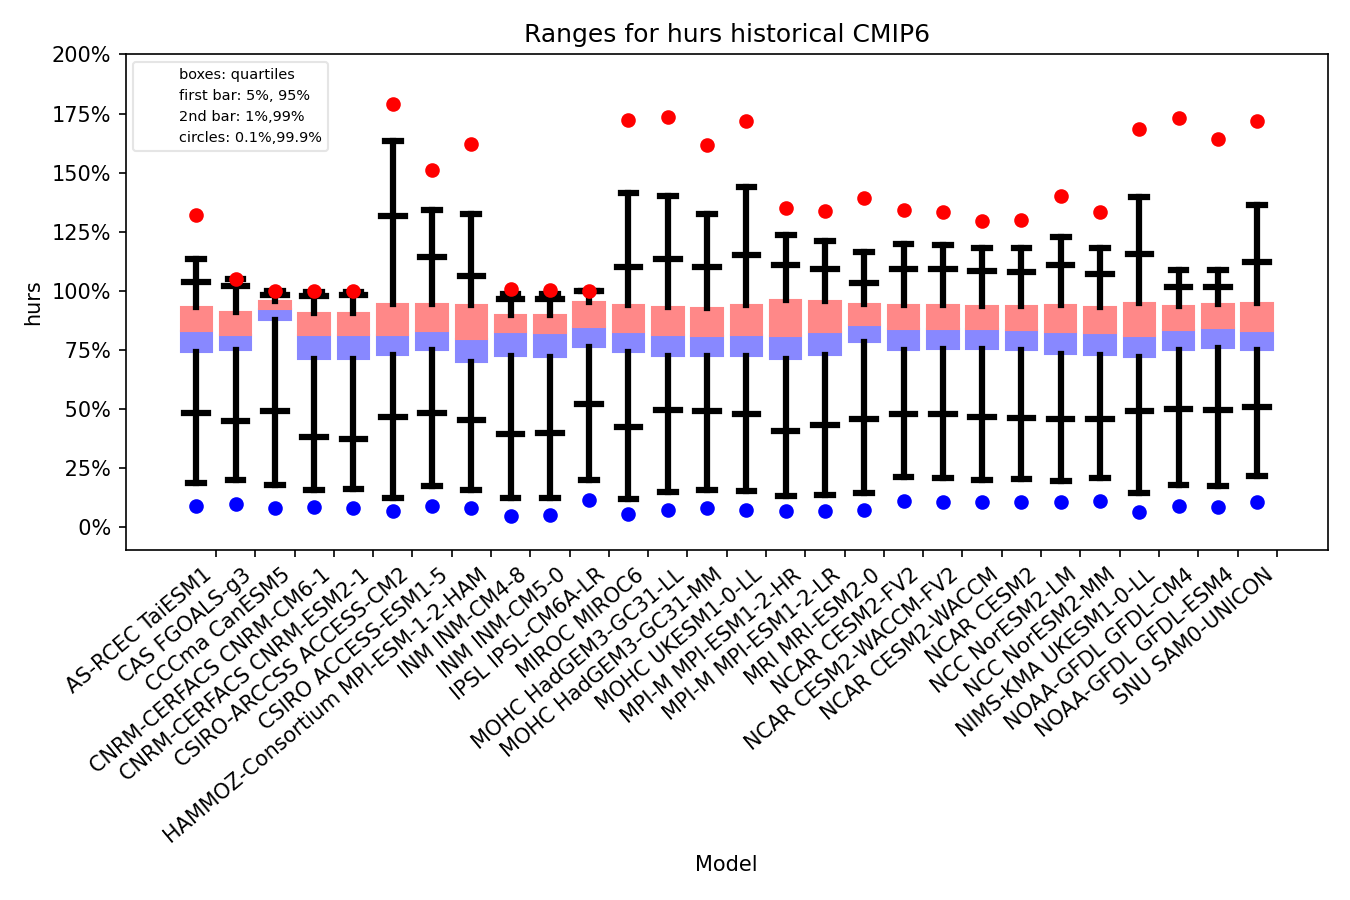
It is not clear whether this data has any scientific value.
What is the intended use of the data?
Values as low as -6.08 mol m-3 are found in the data set specified below:
hdl:21.14100/613b0278-bb37-3f7d-b026-8a5e674e5abe
CMIP6.CMIP.NOAA-GFDL.GFDL-CM4.historical.r1i1p1f1.Omon.o2.gr.v20180701
Unusual results from mask checking ... review with care (is it software or the data?)
The E3SM-1-0 historical simulation has very low near surface salinity, down to 5 over a significant region of the Baltic (image).
The data over land has been mainly set to 1.0, with a few values (white rectangles in the image) masked (i..e set to the missing_value in the NetCDF file).
CMIP6.CMIP.E3SM-Project.E3SM-1-0.historical.r1i1p1f1.Omon.sos.gr.v20190826: hdl:21.14100/e94787c1-a49d-3f59-947b-6971bb41afef
Contacts: Dave Bader, [email protected], Ruby Leung, [email protected].
#21, #22, #23, #24 : GFDL-CM4 - Waiting for first response.
#25: Negative salinity MPI-ESM1-2-HR: very small values ; resolved as warning;
#26: Large thkcello values -- resolved as warning;
#27 Giss-E2-1-H - Waiting for first response
#28 large zos range: MIROC and NorESM teams investigating.
#31 NaN in MRI data: NaN used instead of missing_value for land points .. errata published (set at medium).
#41: negative salinity in CIESM (down to -11).
#49: Very low values, and masking with 1 (E3SM-1-0).
The MCM-UA-1-0 model has negative values in the historial simulation.
Dataset: /badc/cmip6/data/CMIP6/CMIP/UA/MCM-UA-1-0/historical/r1i1p1f1/Amon/huss/gn/latest -> v20190731
ESGF Dataset ID: CMIP6.CMIP.UA.MCM-UA-1-0.historical.r1i1p1f1.Amon.huss.gn.v20190731
Tracking ID: hdl:21.14100/67f32955-f630-34c9-8869-0a2d100d5a88
"percentiles": [
0.02281672972440721,
0.022166316700167953,
0.02179357067681849,
0.020401031104847787,
0.019194150902330877,
0.014243128942325711,
0.0059056992176920176,
0.001804835585062392,
0.00016913018771447247,
-0.00021870806012884713,
-0.0006591687008040025,
-0.0008552453796437476,
-0.001117487338546198
]
The last 4 values above are 5th, 1st, 0.5 and 0.1 percentiles.
This is not currently recorded in the errata system.
Contact: [email protected]
BCC_BCC-CSM2-MR_historical :: Dr. Tongwen Wu([email protected])
Max: 459.50518798828125 -- 100.0
CMIP6.CMIP.BCC.BCC-CSM2-MR.historical.r1i1p1f1.day.va.gn.v20181129 -- hdl:21.14100/9d6fb952-57ee-325a-b525-40d2bbb10ebf
CSIRO_ACCESS-ESM1-5_historical :: None
Max: 128.78921508789062 -- 100.0; Min: -148.763916015625 -- -100.0
CMIP6.CMIP.CSIRO.ACCESS-ESM1-5.historical.r1i1p1f1.day.va.gn.v20191115 -- hdl:21.14100/9d6fb952-57ee-325a-b525-40d2bbb10ebf
BCC_BCC-CSM2-MR_historical :: Dr. Tongwen Wu([email protected])
Max: 9.999999616903162e+35 -- 100.0
CMIP6.CMIP.BCC.BCC-CSM2-MR.historical.r1i1p1f1.day.ua.gn.v20181129 -- hdl:21.14100/f9bfcb4b-c006-3d41-a1a6-3a3631c059c6
CSIRO_ACCESS-ESM1-5_historical :: None
Max: 160.27963256835938 -- 100.0; Min: -119.71839141845703 -- -100.0
CMIP6.CMIP.CSIRO.ACCESS-ESM1-5.historical.r1i1p1f1.day.ua.gn.v20191115 -- hdl:21.14100/f9bfcb4b-c006-3d41-a1a6-3a3631c059c6
A declarative, efficient, and flexible JavaScript library for building user interfaces.
🖖 Vue.js is a progressive, incrementally-adoptable JavaScript framework for building UI on the web.
TypeScript is a superset of JavaScript that compiles to clean JavaScript output.
An Open Source Machine Learning Framework for Everyone
The Web framework for perfectionists with deadlines.
A PHP framework for web artisans
Bring data to life with SVG, Canvas and HTML. 📊📈🎉
JavaScript (JS) is a lightweight interpreted programming language with first-class functions.
Some thing interesting about web. New door for the world.
A server is a program made to process requests and deliver data to clients.
Machine learning is a way of modeling and interpreting data that allows a piece of software to respond intelligently.
Some thing interesting about visualization, use data art
Some thing interesting about game, make everyone happy.
We are working to build community through open source technology. NB: members must have two-factor auth.
Open source projects and samples from Microsoft.
Google ❤️ Open Source for everyone.
Alibaba Open Source for everyone
Data-Driven Documents codes.
China tencent open source team.