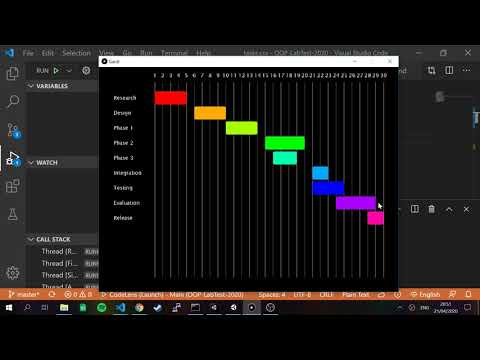
A Gantt chart is a horizontal bar chart that visually represents a project plan over time. On the vertical axis are the list of tasks that make up the project. On the horizontal axis are bars that show when each task begins and ends. In today's test you will be writing a Java program to display a Gantt chart from tasks stored in a csv file and writing code that allows a user to edit the start and end day of each task by dragging the mouse.
Here is a video of what your finished project should look like:
There is one file in the data folder of the repository. The file tasks.csv looks like this:
Task,Start,End
Research,1,5
Design,6,10
Phase 1,11,13
Phase 2,12,16
Phase 3,16,19
Integration,21,23
Testing,21,25
Evaluation,24,28
Release,28,30
Each task is stored on a separate line in the file. There are three columns. The task, the start day and the end day. The range of days is between 1 and 30.
- Fork this repository to get the starter project. Clone the forked repo to your computer and check the upstream and origin remotes are set correctly
- If you are using the shell scripts to compile, don't forget to make the bin folder. You should not need to do this if you are compiling through Visual Studio Code.
- Make a class called Task that encapsulates the columns from a single row from the tasks.csv file. Make private fields and public accessor methods. Make a constructor that takes initial values and assigns them to the fields. Make a constructor that takes a Processing TableRow field as a parameter and make an appropriate toString method.
- In Gantt.java:
- Declare an ArrayList to hold instances of the Task class
- Write a method called loadTasks that populates the ArrayList from the file tasks.csv
- Write a method printTasks that prints the elements of the ArrayList.
- Call these methods from setup()
- Write a method called displayTasks() that displays the tasks as in the video. Each task should have a separate colour. You can use HSB colour mode to achieve this. To get full marks you should use the Processing map function in your solution
- Write code that allows a user to alter the start day and end day of a task by clicking and dragging on the start or end of a task with the mouse (20 pixels after the start or 20 pixels before the end of the rectangle. The user should not be able to set the start or end of the task beyond the range 1-30 and also should not be able to set the duration to be less than 1. You can use the methods mousePressed and mouseDragged to implement this functionality. The map function will be useful here too. It is not necessary to save the tasks back to the file.
- Be sure to make regular commits with messages about what changes are contained in the commit on your repository throughout the time you are working on the test. This will help me to verify that your work is your own
- No collaboration is permitted. Any students found to have collaborated or posted in social media etc. about the test before the submission time will receive a fail grade.
| Description | Marks |
|---|---|
| Creating the Task class | 15 marks |
| Loading and printing the tasks | 15 marks |
| Displaying the tasks | 30 marks |
| Altering the start and end of tasks | 30 marks |
| Use of git | 10 marks |
Submit the URL to your solution before 12 midnight tonight through this link.
