D3 Components for React
Let React have complete control over the DOM even when using D3. This way we can benefit from Reacts Virtual DOM.

npm install react-d3-components
In order to compile the code, from the repository folder, type in your terminal
npm install & npm run build:js
This will install the dependencies required and run the build:js. At the end of the process the compiled .js and min.js will be available in the dist folder. Examples are available in the folder example. From the root folder type
python -m SimpleHTTPServer 8000
to start a webserver, and navigate to http://localhost:8000/example in order to visualize the new example page. Note that the example page directly points to the dist folder.
Ideally the library should be usable with minimum configuration. Just put the data in and see the charts. I try to provide sensible defaults, but since for most use-cases we need to customize D3's parameters they will be made accessible to the user. Most Charts will turn into their stacked variant when given an array as input.
If you like the project please consider starring and a pull request. I am open for any additions.
Documentation is in the Wiki. For quick testing the examples might be enough.
- Brushes
- Tooltips
- Custom accessors to support any data format
- Negative axes
- CSS classes to allow styling
- Bar Chart
- Stacked Bar Chart
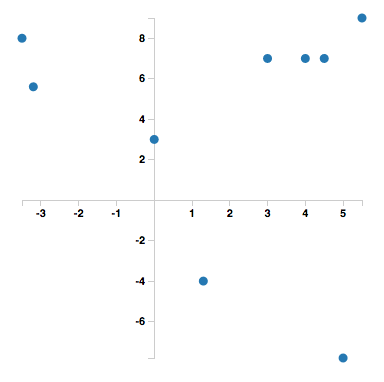
- Scatter Plot
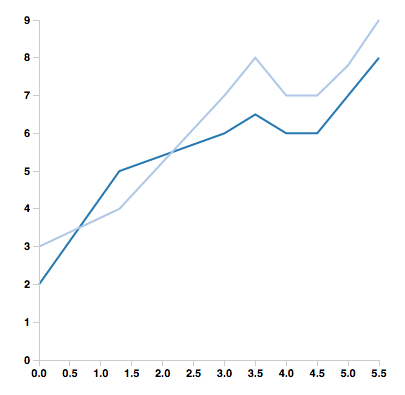
- Line Chart
- Area Chart
- Stacked Area Chart
- Pie Plot
- More Charts
- Animations
- Legend
- Documentation
- Tests
- 0.6.6: Fix ticks rendering over bar chart
- 0.6.5:
- Add tickDirection property to Axis
- Add hideLabels property to PieChart
- Add yOrientation property to AreaChart
- Fix Line Chart rendering
- 0.6.4: Fixed react dependency version (was 0.15.0 instead of 15.0.0)
- 0.6.3: Changed react dependency version to >=0.14.0 to allow react 0.15.
- 0.6.2: Fixed build system. Added colorByLabel property to BarChart.
- 0.6.1: Fixed 'BarChart.getDOMNode(...) is deprecated.'
- 0.6.0: Added Waveform Chart. Moved to React 0.14.
- 0.5.2: Fixed default scale for dates
- 0.5.1: Fixed new props not being used by DefaultScalesMixin
- 0.5.0:
- Improved tooltip. (see example below)
- Tooltip now has different modes.
- AreaChart tooltip now contains x-value argument.
- Support for grouped bar charts. (see example below)
- Support to include child elements inside charts.
- Several bug fixes including recent pull requests.
- React is now a peer dependency
- Improved tooltip. (see example below)
- 0.4.8: Fixed bug were graphs don't resize correctly.
- 0.4.7: Moved to React 0.13.1
- 0.4.6:
- Added sort property to PieChart, same usage as d3.Pie.sort().
- Added support for strokeWidth, strokeDasharray, strokeLinecap to LineChart, can be string or function.
- Small bug fixes.
- 0.4.5: Fixed tooltip not showing when mouse is over tooltip symbol. Tooltip will soon be revamped to allow custom components.
- 0.4.4: Fixed tooltip position inside relative layout containers. Moved to webpack.
- 0.4.3: Fixed tooltip not showing in Safari.
- 0.4.2: Improved LineChart tooltip to show d3.svg.symbol() on nearest data point. Can be customized with shape and shapeColor props. LineChart toolip callback is callback(label, value) now where the format of value depends on your data format, default is {x: x, y: y}.
- 0.4.1: Fixed compatibility issues with Safari and possible other browsers not supporting Number.isFinite().
- 0.4.0: Added X-Axis Brush. Functioning but might change to improve ease of usage etc. Fixed Axis tickFormat not being set correctly.
- 0.3.6: Fixed not correctly requiring D3.
- 0.3.5: Fixed npm packaging.
- 0.3.4: Charts now render correctly when included in another component. Line chart default axes now meet at 0.
- 0.3.0: Added tooltips and made axis properties accessible.
- 0.2.2: Fixed accessors not being used everywhere
- 0.2.1: Excluded external libraries from build and make it usable as a browser include
- 0.2.0: Custom accessors, stacked charts, default scales
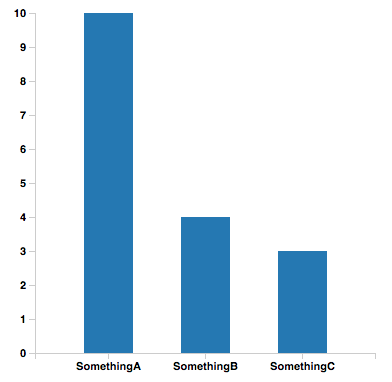
Check out example/index.html found here.
var BarChart = ReactD3.BarChart;

var data = [{
    label: 'somethingA',
    values: [{x: 'SomethingA', y: 10}, {x: 'SomethingB', y: 4}, {x: 'SomethingC', y: 3}]
}];

React.render(
    <BarChart
        data={data}
        width={400}
        height={400}
        margin={{top: 10, bottom: 50, left: 50, right: 10}}/>,
    document.getElementById('location')
);
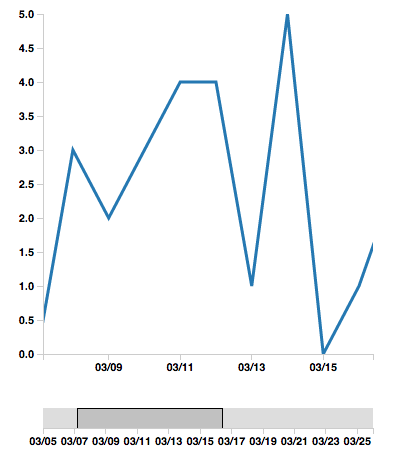
With Brushes we can build interactive Graphs. My personal use-case is to select date ranges as shown below and in the example. The Brush feature is still incomplete, for now only offering a x-Axis Brush but y-Axis will follow soon as well as refactoring. For now the Brush is rendered in its own SVG, this allows flexible use but might change in the future, or become optional. Also there is no Brush support for the built-in default Scales.
.brush .extent {
  stroke: #000;
  fill-opacity: .125;
  shape-rendering: crispEdges;
}

.brush .background {
  fill: #ddd;
}
var LineChart = ReactD3.LineChart;
var Brush = ReactD3.Brush;
var SomeComponent = React.createClass({
getInitialState: function() {
return {
data: {label: '', values: [
{x: new Date(2015, 2, 5), y: 1},
{x: new Date(2015, 2, 6), y: 2},
{x: new Date(2015, 2, 7), y: 0},
{x: new Date(2015, 2, 8), y: 3},
{x: new Date(2015, 2, 9), y: 2},
{x: new Date(2015, 2, 10), y: 3},
{x: new Date(2015, 2, 11), y: 4},
{x: new Date(2015, 2, 12), y: 4},
{x: new Date(2015, 2, 13), y: 1},
{x: new Date(2015, 2, 14), y: 5},
{x: new Date(2015, 2, 15), y: 0},
{x: new Date(2015, 2, 16), y: 1},
{x: new Date(2015, 2, 16), y: 1},
{x: new Date(2015, 2, 18), y: 4},
{x: new Date(2015, 2, 19), y: 4},
{x: new Date(2015, 2, 20), y: 5},
{x: new Date(2015, 2, 21), y: 5},
{x: new Date(2015, 2, 22), y: 5},
{x: new Date(2015, 2, 23), y: 1},
{x: new Date(2015, 2, 24), y: 0},
{x: new Date(2015, 2, 25), y: 1},
{x: new Date(2015, 2, 26), y: 1}
]},
xScale: d3.time.scale().domain([new Date(2015, 2, 5), new Date(2015, 2, 26)]).range([0, 400 - 70]),
xScaleBrush: d3.time.scale().domain([new Date(2015, 2, 5), new Date(2015, 2, 26)]).range([0, 400 - 70])
};
},
render: function() {
return (
<div>
<LineChart
data={this.state.data}
width={400}
height={400}
margin={{top: 10, bottom: 50, left: 50, right: 20}}
xScale={this.state.xScale}
xAxis={{tickValues: this.state.xScale.ticks(d3.time.day, 2), tickFormat: d3.time.format("%m/%d")}}
/>
<div className="brush" style={{float: 'none'}}>
<Brush
width={400}
height={50}
margin={{top: 0, bottom: 30, left: 50, right: 20}}
xScale={this.state.xScaleBrush}
extent={[new Date(2015, 2, 10), new Date(2015, 2, 12)]}
onChange={this._onChange}
xAxis={{tickValues: this.state.xScaleBrush.ticks(d3.time.day, 2), tickFormat: d3.time.format("%m/%d")}}
/>
</div>
</div>
);
},
_onChange: function(extent) {
this.setState({xScale: d3.time.scale().domain([extent[0], extent[1]]).range([0, 400 - 70])});
}
});
You can provide a callback to every chart that will return html for the tooltip. Depending on the type of chart the callback will receive different parameters that are useful.
- Bar Chart: label is the first parameter. y0, y of the hovered bar and the total bar height in case of a stacked bar chart.
- Scatter Plot: x, y of the hovered point.
- Pie Chart: label is the first parameter. y of the hovered wedge.
- Area Chart: closest y value to the cursor of the area under the mouse and the cumulative y value in case of a stacked area chart. x value is the third parameter. label is the fourth parameter.
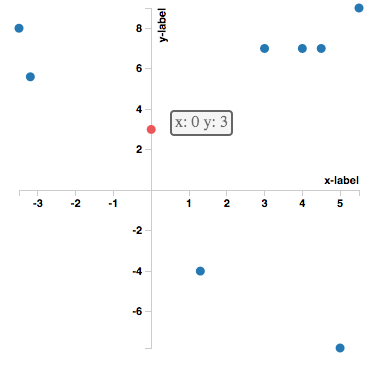
Example Scatter Plot:
var tooltipScatter = function(x, y) {
    return "x: " + x + " y: " + y;
};

React.render(<ScatterPlot
                data={data}
                width={400}
                height={400}
                margin={{top: 10, bottom: 50, left: 50, right: 10}}
                tooltipHtml={tooltipScatter}
                xAxis={{label: "x-label"}}
                yAxis={{label: "y-label"}}/>,
            document.getElementById('scatterplot')
);
Tooltip positioning is influenced by tooltipOffset tooltipContained and tooltipMode, which has 3 options mouse, fixed, element.
mouseis the default behavior and just follows the mousefixedusestooltipOffsetas an offset from the top left corner of the svgelementputs the tooltip on top of data points for line/area/scatter charts and on top of bars for the barchart
tooltipOffset is an object with top and left keys i.e. {top: 10, left: 10}
If tooltipContained is true the tooltip will try to stay inside the svg by using css-transform.
All D3 axis parameters can optionally be provided to the chart. For detailed explanation please check the documentation.
React.render(<LineChart
                    data={data}
                    width={400}
                    height={400}
                    margin={{top: 10, bottom: 50, left: 50, right: 10}}
                    tooltipHtml={tooltipLine}

                    xAxis={{innerTickSize: 10, label: "x-label"}}
                    yAxis={{label: "y-label"}}/>,
            document.getElementById('linechart'));
The following are the default values.
{
tickArguments: [10],
tickValues: null,
tickFormat: x => { return x; },
innerTickSize: 6,
tickPadding: 3,
outerTickSize: 6,
className: "axis",
zero: 0,
label: ""
}data = [{
customLabel: 'somethingA',
customValues: [[0, 3], [1.3, -4], [3, 7], [-3.5, 8], [4, 7], [4.5, 7], [5, -7.8]]
}];
var labelAccessor = function(stack) { return stack.customLabel; };
var valuesAccessor = function(stack) { return stack.customValues; };
var xAccessor = function(element) { return element[0]; };
var yAccessor = function(element) { return element[1]; };
React.render(<ScatterPlot
data={data}
width={400}
height={400}
margin={{top: 10, bottom: 50, left: 50, right: 10}}
label={labelAccessor}
x={xAccessor}
y={yAccessor}
values={valuesAccessor}/>,
document.getElementById('location'));All Charts provide defaults for scales, colors, etc... If you want to use your own scale just pass it to the charts constructor.
The scales are normal D3 objects, their documentation can be found here and here.
There are more parameters like barPadding, strokeWidth, fill, opacity, etc. please check the documentation for details.
var xScale = d3.scale.ordinal(); //... + set it up appropriately
var yScale = d3.scale.linear();
var colorScale = d3.scale.category20();

<BarChart xScale={xScale}
      yScale={yScale}
      colorScale={colorScale}
      barPadding={0.3}
      data={data}
      width={400}
      height={400}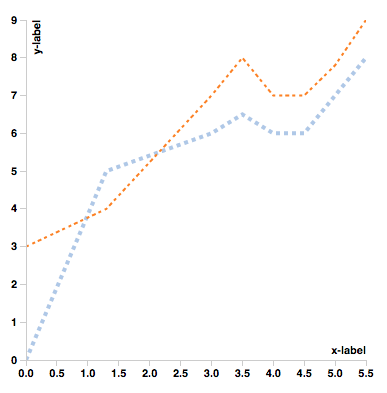
margin={{top: 10, bottom: 50, left: 50, right: 10}}/>You can customize the line style of LineCharts with CSS or if you want to have more control over how each line in your dataset gets rendered you can use the stroke property of LineChart as follows. Note that you do not have to set all the properties in the object.
    var dashFunc = function(label) {
        if (label == "somethingA") {
            return "4 4 4";
        }
        if (label == "somethingB") {
            return "3 4 3";
        }
    }

    var widthFunc = function(label) {
        if (label == "somethingA") {
            return "4";
        }
        if (label == "somethingB") {
            return "2";
        }
    }

    var linecapFunc = function(label) {
        if (label == "somethingA") {
            return "round";
        }
    }

    React.render(<LineChart
                    data={data}
                    width={400}
                    height={400}
                    margin={{top: 10, bottom: 50, left: 50, right: 10}}
                    tooltipHtml={tooltipLine}
                    xAxis={{innerTickSize: 6, label: "x-label"}}
                    yAxis={{label: "y-label"}}
                    shapeColor={"red"}
                    stroke={{strokeDasharray: dashFunc, strokeWidth: widthFunc, strokeLinecap: linecapFunc}}
                    />,
    document.getElementById('linechart')
    );
var BarChart = ReactD3.BarChart;

data = [
    {
    label: 'somethingA',
    values: [{x: 'SomethingA', y: 10}, {x: 'SomethingB', y: 4}, {x: 'SomethingC', y: 3}]
    },
    {
    label: 'somethingB',
    values: [{x: 'SomethingA', y: 6}, {x: 'SomethingB', y: 8}, {x: 'SomethingC', y: 5}]
    },
    {
    label: 'somethingC',
    values: [{x: 'SomethingA', y: 6}, {x: 'SomethingB', y: 8}, {x: 'SomethingC', y: 5}]
    }
];

React.render(<BarChart
                data={data}
                width={400}
                height={400}
                margin={{top: 10, bottom: 50, left: 50, right: 10}}/>,
            document.getElementById('location'));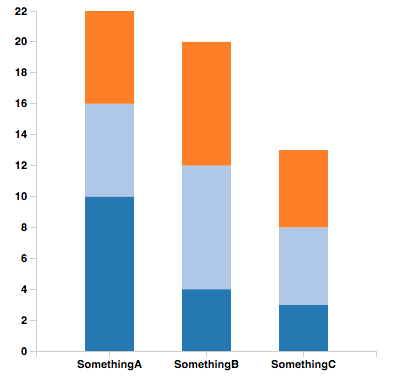
var BarChart = ReactD3.BarChart;

data = [
    {
    label: 'somethingA',
    values: [{x: 'SomethingA', y: 10}, {x: 'SomethingB', y: 4}, {x: 'SomethingC', y: 3}]
    },
    {
    label: 'somethingB',
    values: [{x: 'SomethingA', y: 6}, {x: 'SomethingB', y: 8}, {x: 'SomethingC', y: 5}]
    },
    {
    label: 'somethingC',
    values: [{x: 'SomethingA', y: 6}, {x: 'SomethingB', y: 8}, {x: 'SomethingC', y: 5}]
    }
];

React.render(<BarChart
                groupedBars
                data={data}
                width={400}
                height={400}
                margin={{top: 10, bottom: 50, left: 50, right: 10}}/>,
            document.getElementById('location'));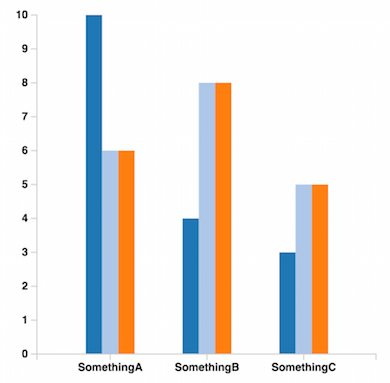
var ScatterPlot = ReactD3.ScatterPlot;
var LineChart = ReactD3.LineChart;
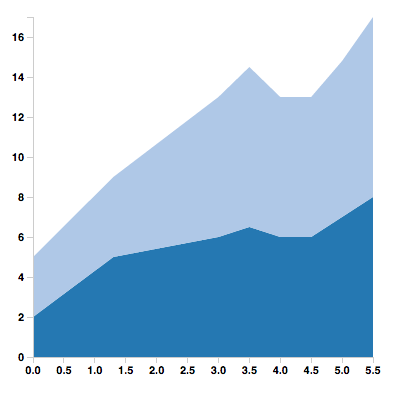
var AreaChart = ReactD3.AreaChart;
data = [
{
label: 'somethingA',
values: [{x: 0, y: 2}, {x: 1.3, y: 5}, {x: 3, y: 6}, {x: 3.5, y: 6.5}, {x: 4, y: 6}, {x: 4.5, y: 6}, {x: 5, y: 7}, {x: 5.5, y: 8}]
},
{
label: 'somethingB',
values: [{x: 0, y: 3}, {x: 1.3, y: 4}, {x: 3, y: 7}, {x: 3.5, y: 8}, {x: 4, y: 7}, {x: 4.5, y: 7}, {x: 5, y: 7.8}, {x: 5.5, y: 9}]
}
];
React.render(<ScatterPlot
data={data}
width={400}
height={400}
margin={{top: 10, bottom: 50, left: 50, right: 10}}/>,
document.getElementById('location'));
React.render(<LineChart
data={data}
width={400}
height={400}
margin={{top: 10, bottom: 50, left: 50, right: 10}}/>,
document.getElementById('location')
);
React.render(<AreaChart
data={data}
width={400}
height={400}
yOrientation='right' // if you do not provide right default left orientation for yAxis will be used
margin={{top: 10, bottom: 50, left: 50, right: 10}}/>,
document.getElementById('location')
);
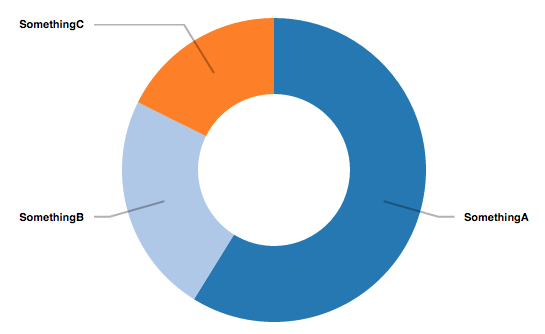
By default d3 sorts the PieChart but you can use the sort property to pass a custom comparator or null to disable sorting.
var PieChart = ReactD3.PieChart;

var data = {
        label: 'somethingA',
        values: [{x: 'SomethingA', y: 10}, {x: 'SomethingB', y: 4}, {x: 'SomethingC', y: 3}]
};

var sort = null; // d3.ascending, d3.descending, func(a,b) { return a - b; }, etc...

React.render(<PieChart
                data={data}
                width={600}
                height={400}
                margin={{top: 10, bottom: 10, left: 100, right: 100}}
                sort={sort}
                />,
            document.getElementById('location')
);
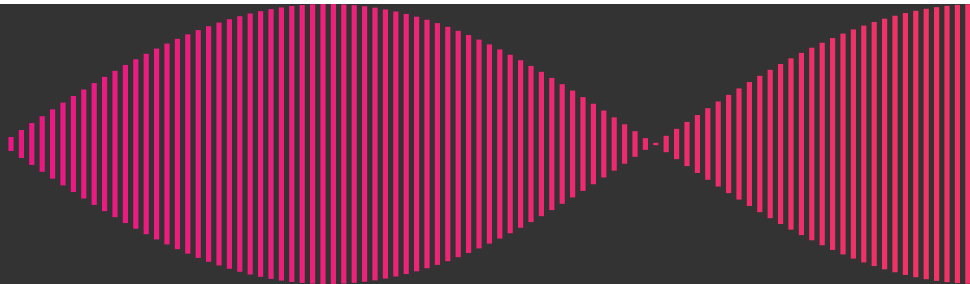
The waveform chart displays a sequence of values as if they were part of an audio waveform. The values are centered on the horizontal axis and reflected along the horizontal origin. For now only values in the range [0,1] are supported.
The graph can accept a colorScale parameter, that is an array of values in the range [0,width], where width is the width of the graph. Following an example of gradient from white to black for a waveform of width 200.
colorScale={ d3.scale.linear()
                    .domain([0,200])
                    .range(['#fff','#000'])}
The graph is responsive and adopts a viewBox strategy to resize the graph maintaining its proportions. We also adopt subSampling in order to maintain the graph rapresentation of the waveform. As it is now each bar needs to have a minimum width of 1px, as well as 1px space between to adjacent bars. In order to allow this, we subsample the input data in order to have exactly a maximum of width/2 elements.
It is therefore a good strategy to select the width of the graph to be twice the length of the dataset. The viewBox responsiveness will then resize the graph to the width of the container. If the samples are less than half of the space available we just display them with a width >1px. Space between bars is increased in width as well.
This library uses parts of D3.js.