Coder Social home page Coder Social logo

chengshiwen / influxdb-cluster Goto Github PK

View Code? Open in Web Editor NEW
820.0 36.0 139.0 2.3 MB

InfluxDB Cluster - Open Source Alternative to InfluxDB Enterprise

Home Page: https://github.com/chengshiwen/influxdb-cluster/wiki

License: MIT License

Shell 1.03% Dockerfile 0.05% Go 98.05% Python 0.74% Ruby 0.07% HCL 0.05% Makefile 0.01%
influxdb clustering high-availability influxdb-enterprise influxdb-cluster

influxdb-cluster's Introduction

InfluxDB Cluster

CN doc EN doc LICENSE Releases GitHub stars Docker pulls

InfluxDB Cluster - An Open-Source Distributed Time Series Database, Open Source Alternative to InfluxDB Enterprise

An Open-Source, Distributed, Time Series Database

InfluxDB Cluster is an open source time series database with no external dependencies. It's useful for recording metrics, events, and performing analytics.

InfluxDB Cluster is inspired by InfluxDB Enterprise, InfluxDB v1.8.10 and InfluxDB v0.11.1, aiming to replace InfluxDB Enterprise.

InfluxDB Cluster is easy to maintain, and can be updated in real time with upstream InfluxDB 1.x.

Features

  • Built-in HTTP API so you don't have to write any server side code to get up and running.
  • Data can be tagged, allowing very flexible querying.
  • SQL-like query language.
  • Clustering is supported out of the box, so that you can scale horizontally to handle your data. Clustering is currently in production state.
  • Simple to install and manage, and fast to get data in and out.
  • It aims to answer queries in real-time. That means every data point is indexed as it comes in and is immediately available in queries that should return in < 100ms.

Clustering

Note: The clustering of InfluxDB Cluster is exactly the same as that of InfluxDB Enterprise.

Please see: Clustering in InfluxDB Enterprise

Architectural overview:
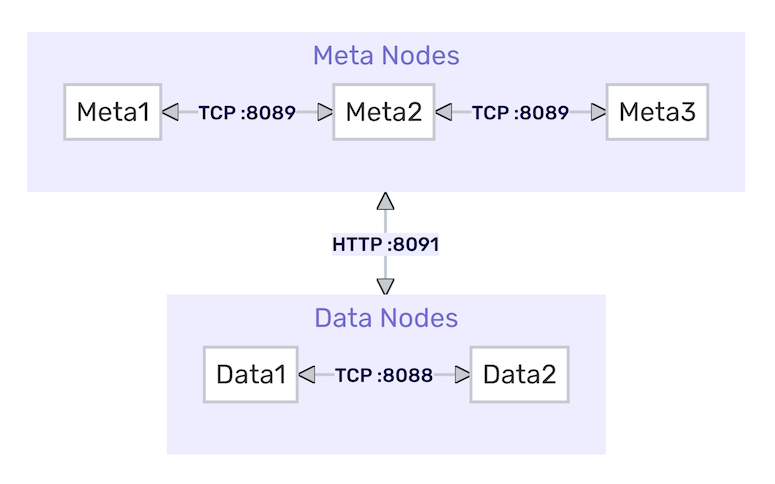
architecture.png

Network overview:

network-architecture

Installation

We recommend installing InfluxDB Cluster using one of the pre-built releases.

Complete the following steps to install an InfluxDB Cluster in your own environment:

  1. Install InfluxDB Cluster meta nodes
  2. Install InfluxDB Cluster data nodes

Note: The installation of InfluxDB Cluster is exactly the same as that of InfluxDB Enterprise.

Docker Quickstart

Download docker-compose.yml, then start 3 meta nodes and 2 data nodes by docker-compose:

docker-compose up -d
docker exec -it influxdb-meta-01 bash
influxd-ctl add-meta influxdb-meta-01:8091
influxd-ctl add-meta influxdb-meta-02:8091
influxd-ctl add-meta influxdb-meta-03:8091
influxd-ctl add-data influxdb-data-01:8088
influxd-ctl add-data influxdb-data-02:8088
influxd-ctl show

Stop and remove them when they are no longer in use:

docker-compose down -v

Getting Started

Create your first database

curl -XPOST "http://influxdb-data-01:8086/query" --data-urlencode "q=CREATE DATABASE mydb WITH REPLICATION 2"

Insert some data

curl -XPOST "http://influxdb-data-01:8086/write?db=mydb" \
-d 'cpu,host=server01,region=uswest load=42 1434055562000000000'

curl -XPOST "http://influxdb-data-02:8086/write?db=mydb&consistency=all" \
-d 'cpu,host=server02,region=uswest load=78 1434055562000000000'

curl -XPOST "http://influxdb-data-02:8086/write?db=mydb&consistency=quorum" \
-d 'cpu,host=server03,region=useast load=15.4 1434055562000000000'

Note: consistency=[any,one,quorum,all] sets the write consistency for the point. consistency is one if you do not specify consistency. See the Insert some data / Write consistency for detailed descriptions of each consistency option.

Query for the data

curl -G "http://influxdb-data-02:8086/query?pretty=true" --data-urlencode "db=mydb" \
--data-urlencode "q=SELECT * FROM cpu WHERE host='server01' AND time < now() - 1d"

Analyze the data

curl -G "http://influxdb-data-02:8086/query?pretty=true" --data-urlencode "db=mydb" \
--data-urlencode "q=SELECT mean(load) FROM cpu WHERE region='uswest'"

Documentation

Contributing

If you're feeling adventurous and want to contribute to InfluxDB Cluster, see our CONTRIBUTING.md for info on how to make feature requests, build from source, and run tests.

Licensing

See LICENSE and DEPENDENCIES.md.

Looking for Support?

influxdb-cluster's People

Contributors

chengshiwen avatar

Stargazers

 avatar  avatar  avatar  avatar  avatar  avatar  avatar  avatar  avatar  avatar  avatar  avatar  avatar  avatar  avatar  avatar  avatar  avatar  avatar  avatar  avatar  avatar  avatar  avatar  avatar  avatar  avatar  avatar  avatar  avatar  avatar  avatar  avatar  avatar  avatar  avatar  avatar  avatar  avatar  avatar  avatar  avatar  avatar  avatar  avatar  avatar  avatar  avatar  avatar  avatar  avatar  avatar  avatar  avatar  avatar  avatar  avatar  avatar  avatar  avatar  avatar  avatar  avatar  avatar  avatar  avatar  avatar  avatar  avatar  avatar  avatar  avatar  avatar  avatar  avatar  avatar  avatar  avatar  avatar  avatar  avatar  avatar  avatar  avatar  avatar  avatar  avatar  avatar  avatar  avatar  avatar  avatar  avatar  avatar  avatar  avatar  avatar  avatar  avatar  avatar

Watchers

 avatar  avatar  avatar  avatar  avatar  avatar  avatar  avatar  avatar  avatar  avatar  avatar  avatar  avatar  avatar  avatar  avatar  avatar  avatar  avatar  avatar  avatar  avatar  avatar  avatar  avatar  avatar  avatar  avatar  avatar  avatar  avatar  avatar  avatar  avatar  avatar

influxdb-cluster's Issues

How to restore influx data

System info:
influxdb version: v1.8.10-c1.1.2
OS: Linux influxdb-cluster-data-0 5.4.0-1108-azure #114~18.04.1-Ubuntu SMP Tue Apr 25 19:10:30 UTC 2023 x86_64 GNU/Linux
Docker Image: chengshiwen/influxdb:1.8.10-c1.1.2-data

Steps to reproduce:

  1. helm install influxdb-cluster ./influxdb-cluster --set "fullnameOverride=influxdb-cluster"
  2. add data and meta nodes in meta-0 pod
  3. go inside one of the data node kubectl exec -it influxdb-cluster-data-0 -- bash
  4. run influxd restore -portable <path>

Expected behavior:
the backed-up data should be restored

Actual behavior:
It is showing unknown command "restore"

Additional info:
As I can see there are no cases of the 'restore' command in the switch statement. So I tried to build in my local with the restore command and tried to restore the dump. It is showing restored and there are no data present in all the measurements.

This dump was created from Influxdb OSS.

I tried to restore using the OSS influxd binary as well, getting the same issue.

Influxdb_data shutting down unexpectedly

System info: [Docker image - chengshiwen/influxdb:1.8.10-c1.1.2-data , Using cluster https://github.com/influxtsdb/helm-charts/tree/master/charts/influxdb-cluster]

Steps to reproduce:

  1. Execute count query for around 2500 datapoints
  2. dial tcp: i/o timeout error occurs
  3. On influx logs
    ts=2023-02-17T10:14:40.059826Z lvl=info msg="Write failed" log_id=0g3gswpl000 service=write node_id=5 shard_id=35 error="hinted handoff queue not empty" ts=2023-02-17T10:14:40.061210Z lvl=info msg="failed to store statistics" log_id=0g3gswpl000 service=monitor error="write failed" ts=2023-02-17T10:14:41.003336Z lvl=info msg=" Signal received, initializing clean shutdown..." log_id=0g3gswpl000 ts=2023-02-17T10:14:41.003369Z lvl=info msg=" Waiting for clean shutdown..." log_id=0g3gswpl000 ts=2023-02-17T10:14:43.857946Z lvl=info msg=" Closing announcer service" log_id=0g3gswpl000 service=announcer ts=2023-02-17T10:14:43.859061Z lvl=info msg=" Closing retention policy enforcement service" log_id=0g3gswpl000 service=retention ts=2023-02-17T10:14:43.860097Z lvl=info msg=" Shutting down hinted handoff service" log_id=0g3gswpl000 service=handoff ts=2023-02-17T10:14:43.971888Z lvl=info msg="Closed service" log_id=0g3gswpl000 service=subscriber ts=2023-02-17T10:14:43.971943Z lvl=info msg=" Server shutdown completed" log_id=0g3gswpl000

__Expected behavior: Should not shutdown

__Actual behavior: Server shutting down

__Additional info:ts=2023-02-17T10:14:40.059826Z lvl=info msg="Write failed" log_id=0g3gswpl000 service=write node_id=5 shard_id=35 error="hinted handoff queue not empty" ts=2023-02-17T10:14:40.061210Z lvl=info msg="failed to store statistics" log_id=0g3gswpl000 service=monitor error="write failed" ts=2023-02-17T10:14:41.003336Z lvl=info msg=" Signal received, initializing clean shutdown..." log_id=0g3gswpl000 ts=2023-02-17T10:14:41.003369Z lvl=info msg=" Waiting for clean shutdown..." log_id=0g3gswpl000 ts=2023-02-17T10:14:43.857946Z lvl=info msg=" Closing announcer service" log_id=0g3gswpl000 service=announcer ts=2023-02-17T10:14:43.859061Z lvl=info msg=" Closing retention policy enforcement service" log_id=0g3gswpl000 service=retention ts=2023-02-17T10:14:43.860097Z lvl=info msg=" Shutting down hinted handoff service" log_id=0g3gswpl000 service=handoff ts=2023-02-17T10:14:43.971888Z lvl=info msg="Closed service" log_id=0g3gswpl000 service=subscriber ts=2023-02-17T10:14:43.971943Z lvl=info msg=" Server shutdown completed" log_id=0g3gswpl000

Roadmap for Version 1.10

Hi Shiwen, your project is amazing.

I wonder if you have an estimated date for the adaptation of version 1.10.

Thank you and congratulations again for the project

I can not pull the Image with portainer - i get "Failure - no such image" - is there a typo?

I tried the links from your docker-compose.yml, i changed them to :latest, i tried chengshiwen/influxdb-cluster instead of chengshiwen/influxdb ... but i always get the same error

Portainer is running on a raspberry pi4 - is this maybe the problem - not supporting hardware?

I would like to run 2 Pis redundant - the second one as backup, if the first one breaks.

thanks alot!

Unexpected write: status 500 , body: {"error":"timeout"}, when 16 million total points written per second

System info: [Include InfluxDB version, operating system name, and other relevant details]

Steps to reproduce:

  1. [First Step]
  2. [Second Step]
  3. [and so on...]

Expected behavior: [What you expected to happen]

Actual behavior: [What actually happened]

Additional info: [Include gist of relevant config, logs, etc.]

If this is an issue of for performance, locking, etc the following commands are useful to create debug information for the team.

curl -o profiles.tar.gz "http://localhost:8086/debug/pprof/all?cpu=true"

curl -o vars.txt "http://localhost:8086/debug/vars"
iostat -xd 1 30 > iostat.txt

Please note It will take at least 30 seconds for the first cURL command above to return a response.
This is because it will run a CPU profile as part of its information gathering, which takes 30 seconds to collect.
Ideally you should run these commands when you're experiencing problems, so we can capture the state of the system at that time.

If you're concerned about running a CPU profile (which only has a small, temporary impact on performance), then you can set ?cpu=false or omit ?cpu=true altogether.

Please run those if possible and link them from a gist or simply attach them as a comment to the issue.

Please note, the quickest way to fix a bug is to open a Pull Request.

Highly available setup of influxdb cluster

System info:
influxdb version: v1.8.10-c1.1.2
OS: Linux influxdb-cluster-data-0 5.4.0-1108-azure #114~18.04.1-Ubuntu SMP Tue Apr 25 19:10:30 UTC 2023 x86_64 GNU/Linux
Docker Image: chengshiwen/influxdb:1.8.10-c1.1.2-data

I want a highly available setup, is it possible to do that using this? Right now I am facing issues while querying or writing data when one of the data pod is not running.

Steps to reproduce:

  1. Run helm install influxdb-cluster ./influxdb-cluster --set "fullnameOverride=influxdb-cluster"
  2. add data and meta nodes in meta-0 pod
  3. stop one of the VM where one of the data pod is running
  4. Now all the query and write apis are failing

Expected behavior:
All the query and write functionalities should work as expected.

Actual behavior:
all the query and write APIs are failing with timeout error

[httpd] 10.42.6.73 [31/Aug/2023:09:09:53 +0000] "POST /api/v2/write?org=quartic&bucket=quartic&precision=ns HTTP/1.1" 500 25 "-" "influxdb-client-java/0.1.0-SNAPSHOT" 25985edc-47de-11ee-a5f2-0e3e75d11849 26307
ts=2023-08-31T09:09:53.438196Z lvl=error msg="[500] - \"write failed\"" log_id=0jvfgjøW000 service=httpd
ts=2023-08-31T09:09:53.454397Z lvl-info msg="Write failed" log_id=ØjvfgjøW000 service=write node_id=4 shard_id=46_error="hinted handoff queue not empty"
ts=2023-08-31T09:09:53.454404Z lvl-info msg="Write failed" log_id=0jvfgjøW000 service=write node_id=4 shard_id=47 error="hinted handoff queue not empty"
[httpd] 10.42.6.73 [31/Aug/2023:09:09:53 +0000] "POST /api/v2/write?org=quartic&bucket=quartic&precision=ns HTTP/1.1" 500 25 "-" "influxdb-client-java/0.1.0-SNAPSHOT" 259b96cf-47de-11ee-a5f3-0e3e75d11849 21548
ts=2023-08-31T09:09:53.454520Z lvl-error msg="[500] \"write failed\"" log_id=0jvfgjøW000 service=httpd
ts=2023-08-31T09:09:53.477233Z lvl-info msg="Write failed" log_id=0jvfgjøW000 service=write node_id=4 shard_id=46 error="hinted handoff queue not empty"
ts=2023-08-31T09:09:53.477249Z lvl-info msg="Write failed" log_id=ØjvfgjøW000 service=write node_id=4 shard_id=47_error="hinted handoff queue not empty"
[httpd] 10.42.6.73
[31/Aug/2023:09:09:53 +0000] "POST /api/v2/write?org-quartic&bucket=quartic&precision=ns HTTP/1.1 500 25 "-" "influxdb-client-java/0.1.0-SNAPSHOT" 259dce85-47de-11ee-a5f4-0e3e75d11849 29861
ts=2023-08-31T09:09:53.477389Z lvl-error_msg="[500] \"write failed\"" log_id=0jvfgjøW000 service=httpd
[httpd] 10.42.7.108 quartic_influx_read_write [31/Aug/2023:09:09:47 +0000] "POST /api/v2/query HTTP/1.1 500 51 "Python/3.9 aiohttp/3.8.1" 222784e5-47de-11ee-a5e5-0e3e75d11849 10012524
ts=2023-08-31T09:09:57.651665Z lvl=error msg="[500] - \"dial tcp 10.42.3.113:8088: i/o timeout\'
\"" log_id=0jvfgj0W000 service=httpd
[httpd] 10.42.7.108 - quartic_influx_read_write [31/Aug/2023:09:09:47 +0000] "POST /api/v2/query HTTP/1.1 500 51 "-" "Python/3.9 aiohttp/3.8.1" 222865e6-47de-11ee-a5e6-0e3e75d11849 10011211
ts=2023-08-31T09:09:57.656105Z lvl=error msg="[500] - \"dial tcp 10.42.3.113:8088: i/o timeout\" log_id=0jvfgj0W000 service=httpd
[httpd] 10.42.4.1 [31/Aug/2023:09:09:57 +0000] "GET /ping HTTP/1.1" 204 0 "kube-probe/1.27" 282e4d72-47de-11ee-a5f5-0e3e75d11849 48
[httpd] 10.42.4.1 [31/Aug/2023:09:09:57 +0000] "GET /ping HTTP/1.1" 204 0 -" "kube-probe/1.27" 282e4f1f-47de-11ee-a5f6-0e3e75d11849 35

influxd-ctl show在两个meta节点上查询差异

版本信息: [1.8.10-c1.1.0/influxdb-cluster_1.8.10-c1.1.0_static_linux_amd64.tar.gz]

问题现象:

  1. 三个meta节点存在于两个服务器上
  2. 在其中一个服务器上influxd-ctl show正常,另一个服务器上查询异常
  3. 如下图所示:
    服务器1:
    image
    服务器2:
    image

Please run those if possible and link them from a gist or simply attach them as a comment to the issue.

Please note, the quickest way to fix a bug is to open a Pull Request.

How can I automate the process of adding the data and meta nodes?

Currently, I add the data and meta node by executing the commands as provided in the documentation

docker exec -it influxdb-meta-01 bash
influxd-ctl add-meta influxdb-meta-01:8091
influxd-ctl add-meta influxdb-meta-02:8091
influxd-ctl add-meta influxdb-meta-03:8091
influxd-ctl add-data influxdb-data-01:8088
influxd-ctl add-data influxdb-data-02:8088

How can I automate this process on the initialization of the cluster and also on the addition of new data and meta nodes?

How to mount correctly?

System info: [Include InfluxDB version, operating system name, and other relevant details]
Operating System: Ubuntu 22.04.3 LTS
Docker Version: 24.0.6
Meta Image: 1.8.10-c1.1.2-meta
Data Image: 1.8.10-c1.1.2-data
Architecture: x86_64
Steps to reproduce:
docker-compoose.yml

version: "3.5"

services:
  influxdb-meta-01:
    image: chengshiwen/influxdb:1.8.10-c1.1.2-meta
    container_name: influxdb-meta-01
    restart: unless-stopped
    networks:
      - influxdb-cluster
    volumes:
      - ./configs/influxdb-meta.conf/:/etc/influxdb/influxdb-meta.conf
      - ./influxdb-meta-01/etc/influxdb/:/etc/influxdb/
      - ./influxdb-meta-01/var/lib/influxdb/:/var/lib/influxdb

  influxdb-meta-02:
    image: chengshiwen/influxdb:1.8.10-c1.1.2-meta
    container_name: influxdb-meta-02
    restart: unless-stopped
    networks:
      - influxdb-cluster
    volumes:
      - ./configs/influxdb-meta.conf/:/etc/influxdb/influxdb-meta.conf
      - ./influxdb-meta-02/etc/influxdb/:/etc/influxdb/
      - ./influxdb-meta-02/var/lib/influxdb/:/var/lib/influxdb

  influxdb-meta-03:
    image: chengshiwen/influxdb:1.8.10-c1.1.2-meta
    container_name: influxdb-meta-03
    restart: unless-stopped
    networks:
      - influxdb-cluster
    volumes:
      - ./configs/influxdb-meta.conf/:/etc/influxdb/influxdb-meta.conf
      - ./influxdb-meta-03/etc/influxdb/:/etc/influxdb/
      - ./influxdb-meta-03/var/lib/influxdb/:/var/lib/influxdb

  influxdb-data-01:
    image: chengshiwen/influxdb:1.8.10-c1.1.2-data
    container_name: influxdb-data-01
    ports:
      - 8186:8086
    restart: unless-stopped
    networks:
      - influxdb-cluster
    volumes:
      - ./configs/influxdb.conf/:/etc/influxdb/influxdb.conf
      - ./influxdb-data-01/etc/influxdb/:/etc/influxdb/
      - ./influxdb-data-01/var/lib/influxdb:/var/lib/influxdb

  influxdb-data-02:
    image: chengshiwen/influxdb:1.8.10-c1.1.2-data
    container_name: influxdb-data-02
    ports:
      - 8286:8086
    restart: unless-stopped
    networks:
      - influxdb-cluster
    volumes:
      - ./configs/influxdb.conf/:/etc/influxdb/influxdb.conf
      - ./influxdb-data-02/etc/influxdb/:/etc/influxdb/
      - ./influxdb-data-02/var/lib/influxdb:/var/lib/influxdb
  1. [First Step]
docker compose up -d
docker exec -it influxdb-meta-01 bash
influxd-ctl add-meta influxdb-meta-01:8091
influxd-ctl add-meta influxdb-meta-02:8091
influxd-ctl add-meta influxdb-meta-03:8091
influxd-ctl add-data influxdb-data-01:8088
influxd-ctl add-data influxdb-data-02:8088
  1. [Second Step]
docker compose down
  1. [and so on...]
    Compose up with previus data.
docker compose up -d

Expected behavior: [What you expected to happen]

Influxdb cluster will working perfectly without error.

Actual behavior: [What actually happened]

In container influxdb-meta-01
influxd-ctl show

Data Nodes
==========
ID	TCP Address	Version

Meta Nodes
==========
ID	TCP Address	Version

It should show like below

Data Nodes
==========
ID	TCP Address		Version
4	38b2aebcf853:8088	1.8.10-c1.1.2
5	279134311c56:8088	1.8.10-c1.1.2

Meta Nodes
==========
ID	TCP Address		Version
1	8b656632025b:8091	1.8.10-c1.1.2
2	377db1e4b5e7:8091	1.8.10-c1.1.2
3	5fca8e422d66:8091	1.8.10-c1.1.2

Then I try to add node again, the error message appear.

add-meta: operation exited with error: dangled meta node at "localhost:8091" already has state present, cannot add another meta node

Maybe my method of mount /var is incorrect?
Thank your reply!

分布式data node写入性能提高不明显

理论上将data node部署在不同的服务器上可以并发写入,提高写入的效率,但是实践中我发现写入性能并没有提高。
我使用了两台服务器作为两个data node,复制因子设置为1,检查内存发现确实每个服务器上只写入了一半的数据。但是我在向influx-cluster写入380w条数据时用时需要20s(全部请求发送给一个node),我在向一个普通的influxdb写入相同数据时用时也是20s。
请问influx-cluster是不支持多个data node并发写入吗,还是因为我的写入操作问题呢?

next version support backup&restore cmd

Hi chengshiwen
em, im curious about that, the next version plan,when could cluster instance support backup&restore command?its really useful to migrate the oss node to cluster node,about the export&import cmd,im afraid it would last huge time, whatever, im trying to test this way, hope this cmd would release soon in the future,thanks for your greatest contribution for opensource.

集群性能测试

1、如何对集群性能进行测试?我使用influx-stress、influxdb-comparisons进行了读写测试,相比于单节点并没有性能的提升,有没有其他专业工具进行测试?
2、没有发现集群内部使用了负载均衡,是需要在上层使用负载均衡提升性能吗?

Different results with same query when 16 million total points written per second

System info: [Include InfluxDB version, operating system name, and other relevant details]

Steps to reproduce:

> select * from ctr where "some"='tag-6000' and time=1678798961952865493 limit 1;
name: ctr
time                n some
----                - ----
1678798961952865493 0 tag-6000

  1. [First Step]
  2. [Second Step]
  3. [and so on...]

Expected behavior: [What you expected to happen]

Actual behavior: [What actually happened]

Additional info: [Include gist of relevant config, logs, etc.]

If this is an issue of for performance, locking, etc the following commands are useful to create debug information for the team.

curl -o profiles.tar.gz "http://localhost:8086/debug/pprof/all?cpu=true"

curl -o vars.txt "http://localhost:8086/debug/vars"
iostat -xd 1 30 > iostat.txt

Please note It will take at least 30 seconds for the first cURL command above to return a response.
This is because it will run a CPU profile as part of its information gathering, which takes 30 seconds to collect.
Ideally you should run these commands when you're experiencing problems, so we can capture the state of the system at that time.

If you're concerned about running a CPU profile (which only has a small, temporary impact on performance), then you can set ?cpu=false or omit ?cpu=true altogether.

Please run those if possible and link them from a gist or simply attach them as a comment to the issue.

Please note, the quickest way to fix a bug is to open a Pull Request.

是否支持数据分节点存储

之前有遇到单机influxdb,大量数据时,会导致查询慢,启动慢(2h)等问题。influx-cluster有没有方案可以将数据分别存储在不同的数据节点,提升influxdb极限性能。

how to install in k8s

Proposal: [Description of the feature]

Current behavior: [What currently happens]

Desired behavior: [What you would like to happen]

Use case: [Why is this important (helps with prioritizing requests)]

Requests may be closed if we're not actively planning to work on them.

remove-data 后如何重新加入集群

请假 2个问题:
假设 replication-factor = 2, consistency=one

  1. 模拟 1 datanode 故障,正常的节点会暂存 hinted handoff, 内部有健康检查机制吗,当故障节点恢复时,会继续写入,健康检查间隔是怎样的?
  2. 模拟 1 datanode 故障,如果执行了 remove-data 之后,想重新加入集群 add-data,influx-meta 还是无法感知到数据恢复
    在日志里看到 lvl=error msg="Failed to determine if node is active" log_id=0anK~crG000 service=handoff node=6 error="node not found", 实际 node 已经变成了10
    update-data 提示前后相同,也无效

The Influxd is crashed when the hinted handoff queue is blocked

System info: [Include InfluxDB version, operating system name, and other relevant details]

Steps to reproduce:

  1. [First Step]
  2. [Second Step]
  3. [and so on...]

Expected behavior: [What you expected to happen]

Actual behavior: [What actually happened]

Additional info: [Include gist of relevant config, logs, etc.]

lvl=warn msg="Write shard failed with hinted handoff" log_id=0gYb_pSl000 service=write node_id=5 shard_id=7 error="queue is blocked"

If this is an issue of for performance, locking, etc the following commands are useful to create debug information for the team.

curl -o profiles.tar.gz "http://localhost:8086/debug/pprof/all?cpu=true"
  % Total    % Received % Xferd  Average Speed   Time    Time     Time  Current
                                 Dload  Upload   Total   Spent    Left  Speed
  0     0    0     0    0     0      0      0 --:--:-- --:--:-- --:--:--     0curl: (7) Failed connect to localhost:8086; Connection refused


curl -o vars.txt "http://localhost:8086/debug/vars"
  % Total    % Received % Xferd  Average Speed   Time    Time     Time  Current
                                 Dload  Upload   Total   Spent    Left  Speed
  0     0    0     0    0     0      0      0 --:--:-- --:--:-- --:--:--     0curl: (7) Failed connect to localhost:8086; Connection refused

iostat -xd 1 30 > iostat.txt

Please note It will take at least 30 seconds for the first cURL command above to return a response.
This is because it will run a CPU profile as part of its information gathering, which takes 30 seconds to collect.
Ideally you should run these commands when you're experiencing problems, so we can capture the state of the system at that time.

If you're concerned about running a CPU profile (which only has a small, temporary impact on performance), then you can set ?cpu=false or omit ?cpu=true altogether.

Please run those if possible and link them from a gist or simply attach them as a comment to the issue.

Please note, the quickest way to fix a bug is to open a Pull Request.

模拟故障1节点时查询其它节点必crash

3 meta-node, 4 data-node,写入设置--replication-factor=2

此时 stop 1 个 influxd,在其它节点查询时 节点会一个个全 crash 掉,必现

panic: runtime error: invalid memory address or nil pointer dereference
[signal SIGSEGV: segmentation violation code=0x1 addr=0x18 pc=0x9a1650]

goroutine 25225082 [running]:
github.com/influxdata/influxdb/query.Iterators.Close(0xc05c47e7c0, 0x1, 0x2, 0xc004348a00, 0x2531498)
        /root/influxdb/query/iterator.go:48 +0x50
github.com/influxdata/influxdb/coordinator.(*ClusterShardMapping).CreateIterator(0xc0043489b0, 0x253aee0, 0xc047f69290, 0xc004348a00, 0x2531498, 0xc047f694a0, 0x0, 0x0, 0x0, 0x0, ...)
        /root/influxdb/coordinator/shard_mapper.go:469 +0x445
github.com/influxdata/influxdb/query.(*exprIteratorBuilder).callIterator.func1(0xc0064ad940, 0x253aee0, 0xc047f69290, 0xc0064abc48, 0xc0064abc00, 0xc047f694a0, 0x7f, 0x1279e25)
        /root/influxdb/query/select.go:583 +0x535
github.com/influxdata/influxdb/query.(*exprIteratorBuilder).callIterator(0xc00059d940, 0x253aee0, 0xc047f69290, 0xc047f694a0, 0x2531498, 0xc047f694a0, 0x0, 0x0, 0x0, 0x0, ...)
        /root/influxdb/query/select.go:608 +0xe5
github.com/influxdata/influxdb/query.(*exprIteratorBuilder).buildCallIterator.func1(0xc047f694a0, 0x253aee0, 0xc047f69290, 0xc00059d940, 0xc00059cd20, 0xc00cdb3860, 0x250da80, 0x250da60, 0xc036229aa0)
        /root/influxdb/query/select.go:515 +0xe5
github.com/influxdata/influxdb/query.(*exprIteratorBuilder).buildCallIterator(0xc0064ad940, 0x253aee0, 0xc047f69290, 0xc047f694a0, 0x7f07a5581338, 0xc00d2df9c0, 0x866349, 0xc04593cd50)
        /root/influxdb/query/select.go:559 +0x745
github.com/influxdata/influxdb/query.buildExprIterator(0x253aee0, 0xc047f69290, 0x2531498, 0xc047f694a0, 0x7f08202f3848, 0xc0043489b0, 0xc015582d10, 0x1, 0x1, 0x2531498, ...)
        /root/influxdb/query/select.go:156 +0x285
github.com/influxdata/influxdb/query.buildFieldIterator(0x253aee0, 0xc047f69290, 0x2531498, 0xc047f694a0, 0x7f08202f3848, 0xc0043489b0, 0xc015582d10, 0x1, 0x1, 0x0, ...)
        /root/influxdb/query/select.go:870 +0x4b6
github.com/influxdata/influxdb/query.buildCursor.func1(0x0, 0x0)
        /root/influxdb/query/select.go:744 +0x12b
golang.org/x/sync/errgroup.(*Group).Go.func1(0xc047f694d0, 0xc003ac0af0)
        /root/go/pkg/mod/golang.org/x/[email protected]/errgroup/errgroup.go:57 +0x59
created by golang.org/x/sync/errgroup.(*Group).Go
        /root/go/pkg/mod/golang.org/x/[email protected]/errgroup/errgroup.go:54 +0x66
panic: runtime error: invalid memory address or nil pointer dereference
[signal SIGSEGV: segmentation violation code=0x1 addr=0x18 pc=0x9a1650]

InfluxDB Cluster PVC[meta and data], Can be created in AWS EFS / NFS storage framework !!

InfluxDB Cluster PVC, Can be created in AWS EFS / NFS storage framework !!

I can see in AWS GP2 storage class is recommended, but for the High Availability of the storage , just checking the alternative storage like NFS OR AWS EFS

Would the current cluster helm charts/manifest support the NFS/ EFS ?? or extra changes to be made in manifest? to get worked

influx cluster helm charts - https://github.com/influxtsdb/helm-charts/tree/master/charts/influxdb-cluster
Already NFS discussions - influxdata/influxdb#9047

How to modify Desired Replicas?and need Cluster config docs readme in China

Proposal: [Description of the feature]
cluster config docs readme in china
Current behavior: [What currently happens]

Desired behavior: [What you would like to happen]

Use case: [Why is this important (helps with prioritizing requests)]

influxd-ctl show-shards
Shards
==========
ID  Database   Retention Policy  Desired Replicas  Shard Group  Start                 End                   Expires               Owners
12  stress     autogen           3                 8            2023-03-13T00:00:00Z  2023-03-20T00:00:00Z  2023-03-20T00:00:00Z  [{ID:5 TCPAddr:10.90.3.94:8088} {ID:6 TCPAddr:10.90.3.95:8088} {ID:7 TCPAddr:10.90.3.96:8088}]
13  stress     autogen           3                 8            2023-03-13T00:00:00Z  2023-03-20T00:00:00Z  2023-03-20T00:00:00Z  [{ID:4 TCPAddr:10.90.3.93:8088} {ID:5 TCPAddr:10.90.3.94:8088} {ID:6 TCPAddr:10.90.3.95:8088}]
14  stress     autogen           3                 8            2023-03-13T00:00:00Z  2023-03-20T00:00:00Z  2023-03-20T00:00:00Z  [{ID:7 TCPAddr:10.90.3.96:8088} {ID:4 TCPAddr:10.90.3.93:8088} {ID:5 TCPAddr:10.90.3.94:8088}]
15  stress     autogen           3                 8            2023-03-13T00:00:00Z  2023-03-20T00:00:00Z  2023-03-20T00:00:00Z  [{ID:6 TCPAddr:10.90.3.95:8088} {ID:7 TCPAddr:10.90.3.96:8088} {ID:4 TCPAddr:10.90.3.93:8088}]

How to modify Desired Replicas?

Requests may be closed if we're not actively planning to work on them.

[occurs error] use `influx import` line protocol data file

System info: [V1.8.10-c1.1.2]

Steps to reproduce:
tip:when export data,i use the -lponly command to ignore database and rp,only keep the line data, and the file also present as desired, howerver when i execute the import command,something wrong, i think it may be some issue in bin file (influx)

  1. influx_inspect export -lponly ...
  2. influx import -database xxx ...

Expected behavior: [import success]

below is the output file screenshot and it coud meet the influx 'Line Protocol format' requirement ~
image

Actual behavior: [error occurs]
image

节点不同步问题

1、当初始化集群加入data-node节点后,数据库自带的_internal库并非同步的,是正常的吗?
2、当删除某个节点的库或表后,其他节点的表和库有时并未删除,导致节点不同步?
3、删除操作必须使用接口操作吗?能使用控制台或可视化客户端输入sql语句进行删除?
4、当节点状态不同步后,如何进行再同步?

dangled meta node

System info: [Include InfluxDB version, operating system name, and other relevant details]

Steps to reproduce:

  1. remove-meta $node
  2. add-meta $node
  3. .....
add-meta: operation exited with error: dangled meta node at "localhost:8091" already has state present,
 cannot add another meta node
  1. [First Step]
  2. [Second Step]
  3. [and so on...]

Expected behavior: [What you expected to happen]

Actual behavior: [What actually happened]

Additional info: [Include gist of relevant config, logs, etc.]

If this is an issue of for performance, locking, etc the following commands are useful to create debug information for the team.

curl -o profiles.tar.gz "http://localhost:8086/debug/pprof/all?cpu=true"

curl -o vars.txt "http://localhost:8086/debug/vars"
iostat -xd 1 30 > iostat.txt

Please note It will take at least 30 seconds for the first cURL command above to return a response.
This is because it will run a CPU profile as part of its information gathering, which takes 30 seconds to collect.
Ideally you should run these commands when you're experiencing problems, so we can capture the state of the system at that time.

If you're concerned about running a CPU profile (which only has a small, temporary impact on performance), then you can set ?cpu=false or omit ?cpu=true altogether.

Please run those if possible and link them from a gist or simply attach them as a comment to the issue.

Please note, the quickest way to fix a bug is to open a Pull Request.

consistency-level can not be configured

System info: [Include InfluxDB version, operating system name, and other relevant details]
consistency-level can not be configured

Reference:
https://docs.influxdata.com/enterprise_influxdb/v1.6/concepts/clustering/#write-consistency

Steps to reproduce:

  1. [First Step]
  2. [Second Step]
  3. [and so on...]

Expected behavior: [What you expected to happen]

Actual behavior: [What actually happened]

Additional info: [Include gist of relevant config, logs, etc.]

If this is an issue of for performance, locking, etc the following commands are useful to create debug information for the team.

curl -o profiles.tar.gz "http://localhost:8086/debug/pprof/all?cpu=true"

curl -o vars.txt "http://localhost:8086/debug/vars"
iostat -xd 1 30 > iostat.txt

Please note It will take at least 30 seconds for the first cURL command above to return a response.
This is because it will run a CPU profile as part of its information gathering, which takes 30 seconds to collect.
Ideally you should run these commands when you're experiencing problems, so we can capture the state of the system at that time.

If you're concerned about running a CPU profile (which only has a small, temporary impact on performance), then you can set ?cpu=false or omit ?cpu=true altogether.

Please run those if possible and link them from a gist or simply attach them as a comment to the issue.

Please note, the quickest way to fix a bug is to open a Pull Request.

8个datanode 同样sql多次查询结果不一致

大佬好,我这边部署完使用过程中发现同一条sql查询,会出现某些datanode返回空的情况。

部署概况:
版本1.8.10-c1.1.2
meta node 3台
data node 8台
表是 2副本,4分片
查询sql是 select sum("tps") from "domain_metric" where time >= now() - 30m and time < now() and "host" = 'abc.com' and "http_code" = '500' group by time(60s) fill(0)

使用负载均衡轮询查询8台节点,连续查询100次,会有10%的概率出现。
循环逐台查询,每台100次,有3台会20次以上为空,有2台不会出现为空,还有3台会出现10次以内为空。
多次测试发现返回空情况跟哪台datanode 没有特殊绑定关系。

这个情况和 #16 类似么?

meta node can not add data node

When I use influxd-ctl add-data influxdb-data-02:8088 in meta-01. I get these:

root@influxdb-meta-01:~/go/bin# influxd-ctl add-data influxdb-data-02:8088
add-data: operation exited with error: Get "http://localhost:8091/status": dial tcp 127.0.0.1:8091: connect: connection refused

It seems that the meta-01 can not visit data-02 http://localhost:8091.

And here is the output in data-02.
2022-08-01T09:28:30.028071Z info Failed to create storage {"log_id": "0c2B_9Xl000", "service": "monitor", "db_instance": "_internal", "error": "Post "http://localhost:8091/execute\": dial tcp 127.0.0.1:8091: connect: connection refused"}
2022-08-01T09:28:30.029493Z info failed to store statistics {"log_id": "0c2B_9Xl000", "service": "monitor", "error": "database not found: _internal"}
2022-08-01T09:28:36.979346Z info Failure getting snapshot {"log_id": "0c2B_9Xl000", "service": "metaclient", "server": "localhost:8091", "error": "Get "http://localhost:8091?index=0\": dial tcp 127.0.0.1:8091: connect: connection refused"}

How can i solve this error? and add data02?

Failure to add new data node to cluster

System info: [Include InfluxDB version, operating system name, and other relevant details]
influx version: 1.8.10-c1.1.2, EC2-ami ubuntu/images/hvm-ssd/ubuntu-jammy-22.04-amd64-server-20221201

Steps to reproduce:

  1. [First Step] Followed documentation of creating influxdb cluster using prebuilts. Setup was one meta node and trying to attach 1 data node. Started meta node as single server.
sudo /home/ubuntu/influxdb-cluster-1.8.10-c1.1.2-1/usr/bin/influxd-meta -config /home/ubuntu/influxdb-cluster-1.8.10-c1.1.2-1/etc/influxdb/influxdb.conf -single-server &

Server was up.
Started data node on different ubuntu box with changes to hostname in the influxdb config file as specified in docs.

sudo /home/ubuntu/influxdb-cluster-1.8.10-c1.1.2-1/usr/bin/influxd -config /home/ubuntu/influxdb-cluster-1.8.10-c1.1.2-1/etc/influxdb/influxdb.conf
ubuntu@ip-172-16-1-144:~/influxdb-cluster-1.8.10-c1.1.2-1/usr/bin$ /home/ubuntu/influxdb-cluster-1.8.10-c1.1.2-1/usr/bin/influxd-ctl show
Data Nodes
==========
ID	TCP Address	Version

Meta Nodes
==========
ID	TCP Address	Version
1	localhost:8091	1.8.10-c1.1.2
  1. Tried to attach data node with below command by running below command from meta-01
/home/ubuntu/influxdb-cluster-1.8.10-c1.1.2-1/usr/bin/influxd-ctl add-data influxdb-data-03:8088
add-data: operation exited with error: read message size: EOF

Below Error on datanode influx server

panic: runtime error: invalid memory address or nil pointer dereference
[signal SIGSEGV: segmentation violation code=0x1 addr=0x0 pc=0xf5a79d]

goroutine 45 [running]:
github.com/influxdata/influxdb/coordinator.(*JoinClusterResponse).MarshalBinary(0xc000290678, 0x1, 0x1, 0x0, 0x0, 0xc000290678)
	/root/influxdb/**coordinator/rpc.go:1330 +0x5d**
github.com/influxdata/influxdb/coordinator.EncodeLV(0x2562e00, 0xc000010fc0, 0x255f560, 0xc000290678, 0x0, 0x2562e00)
	/root/influxdb/coordinator/service.go:1594 +0x35
github.com/influxdata/influxdb/coordinator.EncodeTLV(0x2562e00, 0xc000010fc0, 0xc000010f28, 0x255f560, 0xc000290678, 0x1, 0x8)
	/root/influxdb/coordinator/service.go:1586 +0x85
github.com/influxdata/influxdb/coordinator.(*Service).processJoinClusterRequest(0xc000106d80, 0x259fb80, 0xc000010fc0)
	/root/influxdb/coordinator/service.go:1366 +0x2ab
github.com/influxdata/influxdb/coordinator.(*Service).handleConn(0xc000106d80, 0x259fb80, 0xc000010fc0)
	/root/influxdb/coordinator/service.go:422 +0x1466
github.com/influxdata/influxdb/coordinator.(*Service).serve.func1(0xc000106d80, 0x259fb80, 0xc000010fc0)
	/root/influxdb/coordinator/service.go:284 +0x6f
created by github.com/influxdata/influxdb/coordinator.(*Service).serve
	/root/influxdb/coordinator/service.go:282 +0x13f

Checking source code looks like node_id is not being passed or is null. Please help to find a fix.

add-data: operation exited with error: read message size: EOF

3台主机,每个主机的角色都 Data +Meta, 为了统一主机和配置的名称,

3台主机

序号 IP 角色 Hostname
1 192.168.3.4 Data、Meta influxdb-01
2 192.168.3.5 Data、Meta influxdb-02
3 192.168.3.6 Data、Meta influxdb-03

修改各个主机hostname

主机 - 01

$ cat > /etc/hostname<<'EOF'
influxdb-01
EOF

主机 - 02

$ cat > /etc/hostname<<'EOF'
influxdb-02
EOF

主机 - 03

$ cat > /etc/hostname<<'EOF'
influxdb-03
EOF

添加集群节点,成功!

influxd-ctl add-meta influxdb-01:8091;
influxd-ctl add-meta influxdb-02:8091;
influxd-ctl add-meta influxdb-03:8091;

添加数据节点,在各自主机分别执行与其相关命令

influxd-ctl add-data influxdb-01:8088
influxd-ctl add-data influxdb-02:8088
influxd-ctl add-data influxdb-03:8088
[root@influxdb-02 meta]# influxd-ctl add-data influxdb-02:8088
add-data: operation exited with error: read message size: EOF

部署过程记录:https://wiki.hiwepy.com/docs/tigk/tigk-1egc8ffhceisu

生产环境,着急,还望能能早点给答复!

All nodes in the cluster are crashed when multiple writing stress testing and 16 million total points written per second

System info: [Include InfluxDB version, operating system name, and other relevant details]

Steps to reproduce:

  1. [First Step]
  2. [Second Step]
  3. [and so on...]

Expected behavior: [What you expected to happen]

Actual behavior: [What actually happened]

Additional info: [Include gist of relevant config, logs, etc.]

# influxd-ctl show
all Nodes
Data Nodes
==========
ID	TCP Address		Version
4	10.90.3.93:8088
5	10.90.3.94:8088
6	10.90.3.95:8088
7	10.90.3.96:8088

Meta Nodes
==========
ID	TCP Address		Version
1	10.90.3.84:8091		unknown
2	10.90.3.85:8091		unknown
3	10.90.3.86:8091		unknown

client node return err:

[2023-03-14 14:51:20] Error sending write: dial tcp4 10.90.3.94:8086: connect: connection refused
[2023-03-14 14:51:20] Error sending write: dial tcp4 10.90.3.94:8086: connect: connection refused
[2023-03-14 14:51:20] Error sending write: dial tcp4 10.90.3.94:8086: connect: connection refused
[2023-03-14 14:51:20] Error sending write: dial tcp4 10.90.3.94:8086: connect: connection refused
[2023-03-14 14:51:20] Error sending write: dial tcp4 10.90.3.94:8086: connect: connection refused
[2023-03-14 14:51:20] Error sending write: dial tcp4 10.90.3.94:8086: connect: connection refused
[2023-03-14 14:51:20] Error sending write: dial tcp4 10.90.3.94:8086: connect: connection refused
[2023-03-14 14:51:20] Error sending write: dial tcp4 10.90.3.94:8086: connect: connection refused
[2023-03-14 14:51:20] Error sending write: dial tcp4 10.90.3.94:8086: connect: connection refused
[2023-03-14 14:51:20] Error sending write: dial tcp4 10.90.3.94:8086: connect: connection refused
[2023-03-14 14:51:20] Error sending write: dial tcp4 10.90.3.94:8086: connect: connection refused
[2023-03-14 14:51:20] Error sending write: dial tcp4 10.90.3.94:8086: connect: connection refused

data node logs:

[httpd] 10.90.3.86 - - [14/Mar/2023:14:48:31 +0800] "POST /write?db=stress HTTP/1.1 " 204 0 "-" "fasthttp" 3bf17226-c234-11ed-99ec-fa2020293404 681727
[httpd] 10.90.3.97 - - [14/Mar/2023:14:48:31 +0800] "POST /write?db=stress HTTP/1.1 " 204 0 "-" "fasthttp" 3bf9f1b6-c234-11ed-99f5-fa2020293404 626060
[httpd] 10.90.3.97 - - [14/Mar/2023:14:48:31 +0800] "POST /write?db=stress HTTP/1.1 " 204 0 "-" "fasthttp" 3c01058a-c234-11ed-9a07-fa2020293404 579819
[httpd] 10.90.3.98 - - [14/Mar/2023:14:48:31 +0800] "POST /write?db=stress HTTP/1.1 " 204 0 "-" "fasthttp" 3bdb65c6-c234-11ed-99c4-fa2020293404 868305

If this is an issue of for performance, locking, etc the following commands are useful to create debug information for the team.

curl -o profiles.tar.gz "http://localhost:8086/debug/pprof/all?cpu=true"

curl -o vars.txt "http://localhost:8086/debug/vars"
iostat -xd 1 30 > iostat.txt

Please note It will take at least 30 seconds for the first cURL command above to return a response.
This is because it will run a CPU profile as part of its information gathering, which takes 30 seconds to collect.
Ideally you should run these commands when you're experiencing problems, so we can capture the state of the system at that time.

If you're concerned about running a CPU profile (which only has a small, temporary impact on performance), then you can set ?cpu=false or omit ?cpu=true altogether.

Please run those if possible and link them from a gist or simply attach them as a comment to the issue.

Please note, the quickest way to fix a bug is to open a Pull Request.

【求助】influxd-ctl copy-shard occurs error

当我在Meta节点1执行A节点复制分片至B节点时,抛出异常:copy-shard: operation exited with error: read tcp 172.25.38.119:46704->172.25.38.127:8088: i/o timeout,如何解决呀,虚心求助?

Recommend Projects

  • React photo React

    A declarative, efficient, and flexible JavaScript library for building user interfaces.

  • Vue.js photo Vue.js

    🖖 Vue.js is a progressive, incrementally-adoptable JavaScript framework for building UI on the web.

  • Typescript photo Typescript

    TypeScript is a superset of JavaScript that compiles to clean JavaScript output.

  • TensorFlow photo TensorFlow

    An Open Source Machine Learning Framework for Everyone

  • Django photo Django

    The Web framework for perfectionists with deadlines.

  • D3 photo D3

    Bring data to life with SVG, Canvas and HTML. 📊📈🎉

Recommend Topics

  • javascript

    JavaScript (JS) is a lightweight interpreted programming language with first-class functions.

  • web

    Some thing interesting about web. New door for the world.

  • server

    A server is a program made to process requests and deliver data to clients.

  • Machine learning

    Machine learning is a way of modeling and interpreting data that allows a piece of software to respond intelligently.

  • Game

    Some thing interesting about game, make everyone happy.

Recommend Org

  • Facebook photo Facebook

    We are working to build community through open source technology. NB: members must have two-factor auth.

  • Microsoft photo Microsoft

    Open source projects and samples from Microsoft.

  • Google photo Google

    Google ❤️ Open Source for everyone.

  • D3 photo D3

    Data-Driven Documents codes.