chartjs / chartjs-chart-financial Goto Github PK
View Code? Open in Web Editor NEWChart.js module for charting financial securities
License: MIT License
Chart.js module for charting financial securities
License: MIT License


![dependabot[bot] avatar](https://avatars.githubusercontent.com/in/29110?v=4 "dependabot[bot]")


The candlestick chart doesn't render the first and last candle well. It centers the candlestick but only draws the part of the candle that fits inside the chart.
Using the sample ( https://www.chartjs.org/chartjs-chart-financial/ ) the April 1st candle only shows from the center of the candle and to the right (cutting off the left side). The Jun 22nd candle only shows from the center of the candle and to the left (cutting off the right side).
Shouldn't there be a whitespace border to allow the full candle to be rendered?
I want to dynamically update candlestick chart.
		candlest = document.getElementById("chart3").getContext("2d");
		candlest.canvas.width = 1000;
		candlest.canvas.height = 250;
		new Chart(candlest, {
			type: 'candlestick',
			data: {
				datasets: [{
					label: [],
					data: jdata,
					fractionalDigitsCount: 6,
				}]
			},
			options: {
				legend: {display: false},
				scales: {
					yAxes: [
						{
						id: 'y-axis-0',
							  ticks: {
								//autoSkip: true,
								stacked: true
							  },
						    display: true,
							position: 'right',
							scaleLabel: {
								display: true,
								labelString: 'Price'
							  }
							},{
								display: true,
								position: 'left',
							   }
						  ],
					xAxes: [
						{
						id: 'x-axis-0',
						     display: true,
						scaleLabel: {
								display: true,
						},
						ticks: {
								autoSkip: true,
								stacked: true,
								maxTicksLimit: 10,
								//callback:(v)=>this.formatSecsAsMins(v),
								stepSize:300, //add a tick every 5 minutes
						},
						}
				  ]
				},
				tooltips: {
					position: 'nearest',
					mode: 'index',
				},
			},
		});
tried this codes to update the chart dynamically. but didn't work out .
candlest.jdata.datasets[0].data[t]={c: min2.c,h: min2.h,l: min2.l,o: min2.o,t: min2.t};
candlest.options.scales.yAxes[0].scaleLabel.labelString = cval;
candlest.update()
Tests seem to randomly fail with the following error : Some of your tests did a full page reload.
This seems to be because of the test Should have the correct min/max values in scale.financialLinear.tests.js
x1000 means the test is run 1000 times in a for loop, like this
commented means the test is commented
And then I tried to run the tests on Travis. The results seem random.
https://travis-ci.org/loicbourgois/chartjs-chart-financial/builds
For each build, node 6, 8, 9 are used.
Usually it works on one of the environment.
Most of the libraries I've seen for candlestick uses this format for the dataset (including google charts and highcharts)
[
		[1272844800000,37.69,38.27,37.55,38.05],
		[1272931200000,37.58,37.61,36.68,36.95],
		[1273017600000,36.15,36.88,35.53,36.57],
		[1273104000000,36.26,36.89,28.46,35.18],
		[1273190400000,34.82,35.22,32.17,33.69],
		[1273449600000,35.75,36.38,35.50,36.28],
		[1273536000000,35.98,37.13,35.79,36.65],
		[1273622400000,37.04,37.59,36.96,37.44],
		[1273708800000,37.60,37.86,36.63,36.91],
		[1273795200000,36.45,36.64,35.64,36.26],
		[1274054400000,36.39,36.60,35.39,36.32],
		[1274140800000,36.71,36.94,35.75,36.05],
		[1274227200000,35.64,36.13,34.98,35.48],
		[1274313600000,34.55,34.84,33.74,33.97],
		[1274400000000,33.26,34.93,33.05,34.62],
		[1274659200000,35.33,35.84,35.18,35.25],
		[1274745600000,34.19,35.25,33.88,35.03],
		[1274832000000,35.73,36.02,34.82,34.87],
		[1274918400000,35.80,36.27,35.59,36.19],
		[1275004800000,37.06,37.06,36.19,36.70]
]
which is timestamp, o, h, l, c. The way you have all rows as an objects means that most of the time the data coming from the database have to be refromated.
I just want to try this out. Could you please provide a sample that works out of the box in the samples folder?
I am looking at index.html. Chart.bundle.js could perhaps be a cdn reference? Chart.Financial.js could be prebuilt and available?
Well done!
core.js:6228 ERROR TypeError: Cannot read property 'minBarLength' of undefined
    at ChartElement.calculateBarValuePixels (Chart.js:5042)
    at ChartElement._updateElementGeometry (chartjs-chart-financial.js:146)
    at ChartElement.updateElement (chartjs-chart-financial.js:373)
    at ChartElement.update (Chart.js:4895)
    at ChartElement._update (Chart.js:3831)
    at ChartElement.reset (Chart.js:3733)
    at Chart.js:9638
    at Object.each (Chart.js:2227)
    at Chart.update (Chart.js:9637)
    at Chart.construct (Chart.js:9357)
I am trying to implement the following financial chart but without a luck and I keep getting this error.
Stack:
"chart.js": "^2.9.3",
 "chartjs-adapter-luxon": "^0.2.0",
"eva-icons": "^1.1.2",
"luxon": "^1.15.1",
"ng2-charts": "^2.3.2",
I created also this stackblitz but somehow has problems compiling: https://stackblitz.com/edit/angular-ivy-gpyjzx
The whitespace calculation at
...is unhelpful for charts that have small movements around a high value. For example, if Bitcoin has recently moved within the range 10700 to 10710, the proposed scale will be from 10165 to 11245.
Perhaps the following code would provide something closer to the intention:
me.min -= (me.max - me.min) * 0.05; me.max += (me.max - me.min) * 0.05;
Browser Google Chrome 71.0.3578.98


In MS Edge on Windows 10 the similar
full test folder in app. below::
Hi, it happens also with zoom plugin, so I disabled it to verify and it happens also without zoom.
Am I doing something wrong here? I get json very fast, then it freezes for at least 10s. For more data, it can freeze for minutes even!
            for (const candle of candleResponse.candles) {
                console.log(candle);
                const luxonDate: luxon.DateTime = luxon.DateTime.fromISO(candle.time);
                this.chartLabels.push(luxonDate.toString());
                this.chartData[0].data.push({
                    t: luxonDate.valueOf(),
                    o: candle.mid.o,
                    h: candle.mid.h,
                    l: candle.mid.l,
                    c: candle.mid.c
                });
            }
        });```
I'm using vmpowerio/chartjs-node to generate chart images serverside. I'm having a hard time finding out how to use this as an extension in such a scenario. Has anyone done this before?
I can't really find a real-life example - not some random auto-generated code.
an example with data from an API or arrays of data... got something anywhere? I mean just dropping the code - is it a private project?
I see people asking and probably using this lib but how? where are some real-life examples? what am I missing...
Is it possible to implement this extension in an project angular 4?
Hi, I have a problem. Can't change number of elements in chart. As usually, tried to change scales ticks option, but only scale labels have been changed. That's problem? Is it bug or I don't understand something? Sorry if where a lot of mistakes in my English)
Hi i have two error for working on the candlestick chart.
I have entered the time scale label and the data ({o:1, h:3, l: 1, c:2}, ) in the sample in the file to make a simple candlestick chart, but it appears to not work. no graph appears.(Please refer source 1)
Also, I have made a candlestick chart with line chart combined(please refer source2)
but, does not work.
instead, the bar+candlestick chart would appear not bad, but when pointing the mouse, the o,h,l,c
value just shows NaH.
Sorry for bothering, but someone kindly tell me what I am wrong for issue?
Thank you in advance
// source 1
var ctx = document.getElementById("chart1").getContext("2d");
ctx.canvas.width = 1000;
ctx.canvas.height = 250;
var chart1=new Chart(ctx, {
type: 'candlestick',
		data: {


			datasets: [{
				label: "CHRT - Chart.js Corporation",
				data: [
			{o:1, h:3, l: 1, c:2},
                        {o:4, h:5, l: 1, c:1}
]
				fractionalDigitsCount: 2,
			}],
labels: ['January', 'February']
		},
		options: {
			tooltips: {
				position: 'nearest',
				mode: 'index',
			},
		},
	});
//source2
<canvas id="myChart" style="padding-bottom: " >
Is there any example of a chart with Navigator or is not implemented yet?
I was looking something like this
Thanks!
Wanted to make you aware that luxon does not seem to be IE11 compatible. I also wish I did not had to support IE11 but working in an enterprise environment where this is still the default browser set by IT even in new Windows 10 machines. One of the reasons to have chosen chart.js was the stated IE11 support while still making great looking charts.
The examples in https://www.chartjs.org/chartjs-chart-financial/ throw an error in the console and don't show the chart.
luxon seems to be on the way to remove support for IE11
A similar issue to the error in luxon moment/luxon#269
Issue opened to remove support to IE11 in luxon moment/luxon#594
The error:
chartjs-chart-financial
HTML1300: Navigation occurred.
chartjs-chart-financial
HTML1527: DOCTYPE expected. Consider adding a valid HTML5 doctype: "".
chartjs-chart-financial (1,1)
SCRIPT438: Object doesn't support property or method 'assign'
[email protected] (1,28835)
SCRIPT5007: Unable to get property 'DateTime' of undefined or null reference
index.js (41,2)

I get a buggy behavior when I zoom, I want to know how to disable the zoom entirely!
Hello.
Its great that Chart.js now have a candle stick function!
I would love to use this!
By the way, I have one question for candlestick chart.
How do i input the data?
I think I need to input High, Low, Close, Open data, but i do not know how i could do this.
Sorry for bothering, but could you kindly show me some simple samples for how i could input the data?
(The uploaded samples looks to be randomized data)
Thank you.
hello,
i am using candlestick, and when i am adding scattered dots, the are being connected with line.
and when i remove the candlestick type and use only scatter, it works ok (all on the same graph of course), i have attached photo of both:
candles + scatter:

scatter only:

here is the chart conf:
new Chart(ctx, {
   type: 'candlestick',
    data: {
        datasets: [{
            label: 'BTC-ADA',
            data: candles
        },{
        label: 'Buys',
                    data: buys,
                    borderColor: "green",
                    fill: false,
                     type: 'scatter',
        },{
        label: 'Sells',
                    data: sells,
                    fill: false,
                    borderColor: "red",
                     type: 'scatter',
        }]
    },
    options: {

        tooltips: {
					position: 'nearest',
					mode: 'index',
				},						pan: {
						enabled: true,
						mode: 'xy',
						speed: 10,
						threshold: 10
					},
        			    zoom: {
						enabled: true,
						mode: 'xy',
						limits: {
							max: 10,
							min: 0.5
						}
					},

    }
		});
please advise how to fix this bug.
Hello.
Now, I am making a candlestick chart by using the data below .
{ t: 'April 01 2018', o: 70.87, h: 80.13, l: 40.94, c: 50.24 },
The problem is that the x axis doesn't display as "April 01" it says "12:00.00.000am".
Could you please help me how I can fix the time to "April 01"?
It's not clear to me why this method is needed
Hi
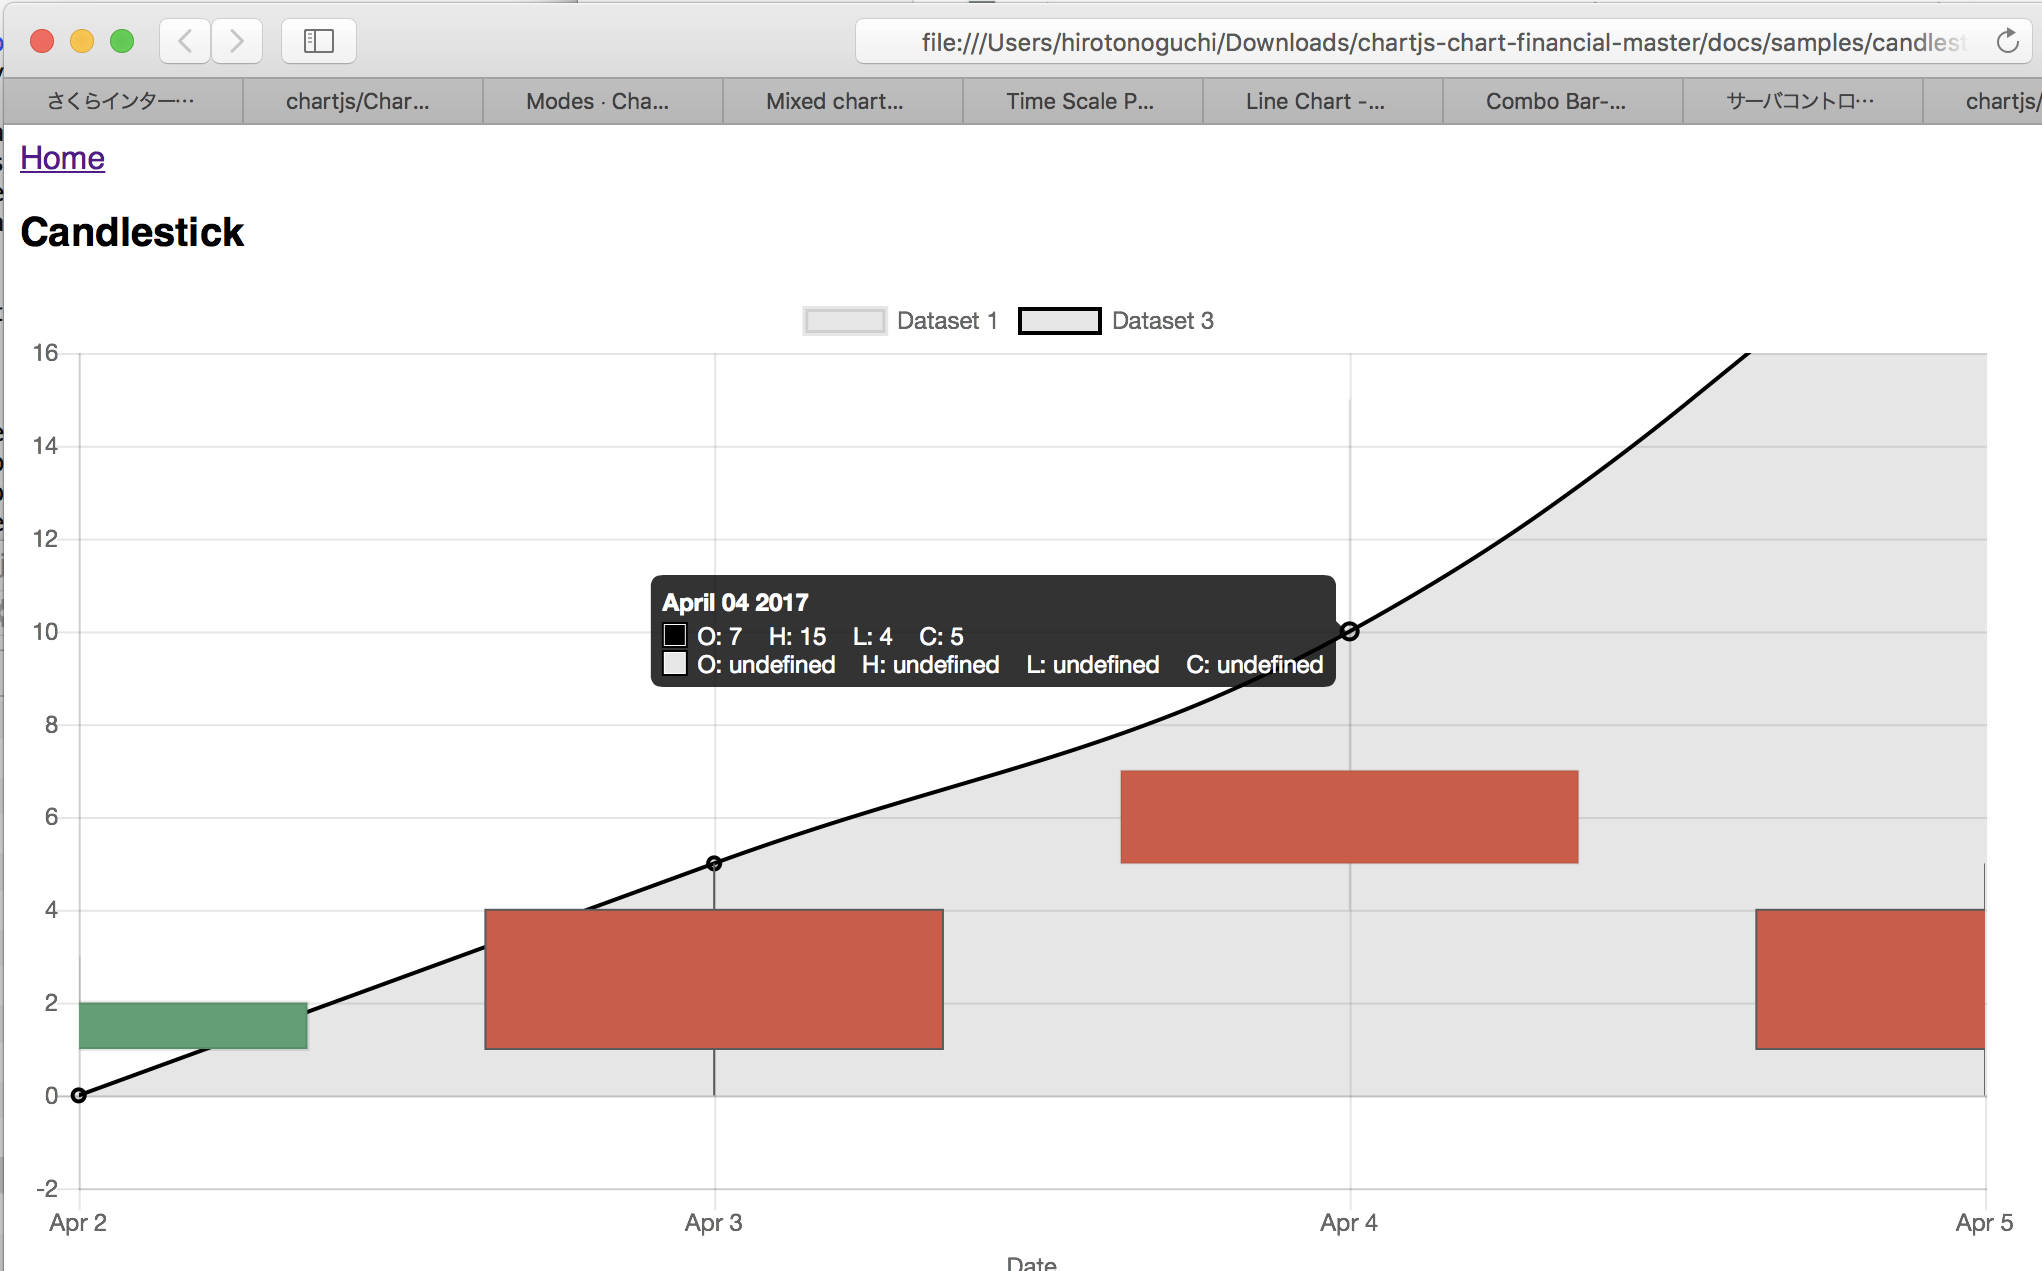
I have a trouble with candlestick + line chart mixed chart.
the tooltips does not show properly for the line chart.(the line chart tooltip shows undefined)
The code is listed below.
Could you tell me how I could solve this?
`
<a href="../index.html">Home</a>
<div class="content">
	<h2>Candlestick</h2>
	<div style="width:1000px">
		<canvas id="myChart"></canvas>
	</div>

</div>
},
]
},
options: {
tooltips: { position: 'nearest',mode: 'index', },
responsive: true,
scales: {
xAxes: [{
					type: 'time',
					display:true,
					time: {
						minUnit:'day',
					},
					scaleLabel: {
						display: true,
						labelString: 'Date'
					}
				}],

    },
}
});
</script> `Do I need to build the app, in order to get the Chart.Financial.js file?
When using the 'average' position option the tooltips are not showing, when using {intersect: false, mode: 'index', position: 'nearest'} the tooltips show at the position of the cursor.
Hi
i noticed that the zoom and financial chart is not really interacting right.
i am trying to zoom the candlestick chart as below,

but the zoomed chart looks like this, and the candlestick is getting zoomed as well.
IS there any way i could process this out??

Hi. I can't find a working code / sample to run the financial chart. The files included in sample are not available in the folder!
Also, is it out of beta now? Thanks, really waiting!
Hey. I've been toying with this all day to no avail so far. I've been using chartjs-node with no issues but I can't even load chartjs-chart-financial.
I've built the library and even used their pre-provided one, but whenever I require() the file, it throws errors such as:
These errors are on the loading of this file, not even the execution of the function.
I can't seem to figure out what's wrong and all my workarounds aren't getting anywhere. I feel like I'm missing something right in front of my face, too.
I gave the financial chart a first try today and I was surprised how well it already works! I hope this gets released soon so more people can use it :).
One issue I had: I tried to add volume bars by adding a bar chart to the financial chart. There were no errors, but the bar chart was not shown. Is this possible or would this have to be implemented in the financial chart directly? (reference how I wanted it to look: https://bittrex.com/Market/Index?MarketName=BTC-ETH)
I created the example. So I want to use my date to check it out.
This is my data:
0:{t: 1502881200000, o: 0.00001194, h: 0.0000138, l: 0.00001122, c: 0.0000128}
1:{t: 1502883000000, o: 0.0000128, h: 0.0000143, l: 0.0000128, c: 0.00001383}
2:{t: 1502884800000, o: 0.00001368, h: 0.00001369, l: 0.000013, c: 0.00001319}
3:{t: 1502886600000, o: 0.00001319, h: 0.00001323, l: 0.00001296, c: 0.00001302}
I get this error:
Chart.Financial.js:5077 Uncaught TypeError: Cannot read property 'getMonth' of undefined
at parseTime (Chart.Financial.js:5077)
at ChartElement.getPixelForTick (Chart.Financial.js:5419)
at ChartElement.calculateTickRotation (Chart.bundle.js:11905)
at ChartElement.update (Chart.bundle.js:11803)
at getMinimumBoxSize (Chart.bundle.js:11062)
at Object.helpers.each (Chart.bundle.js:9515)
at Object.update (Chart.bundle.js:11076)
at Chart.updateLayout (Chart.bundle.js:8577)
at Chart.update (Chart.bundle.js:8543)
at Chart.construct (Chart.bundle.js:8307)
and then this one:
Chart.bundle.js:10518 Uncaught TypeError: Cannot read property 'skip' of undefined
at parseVisibleItems ([SOME_DIR]/assets/charts/Chart.bundle.js:10518:23)
at getIntersectItems ([SOME_DIR]/assets/charts/Chart.bundle.js:10534:3)
at indexMode ([SOME_DIR]/assets/charts/Chart.bundle.js:10584:35)
at Chart.getElementsAtEventForMode ([SOME_DIR]/assets/charts/Chart.bundle.js:8781:12)
at Chart.handleEvent [SOME_DIR]/assets/charts/Chart.bundle.js:8994:20)
at Chart.eventHandler ([SOME_DIR]/assets/charts/Chart.bundle.js:8952:21)
at listener ([SOME_DIR]/assets/charts/Chart.bundle.js:8887:21)
at HTMLCanvasElement.proxies.(anonymous function) [SOME_DIR]/assets/charts/Chart.bundle.js:14386:5)
I don't know what I did wrong or of this is a know issue.
Hi, I have been trying to apply the border color enhancement but isn't not shown in the graph. Is necessary extra configuration?

I cant install this package, I did npm install chartjs-chart-financial --save and it returned an error
npm ERR! 404 'chartjs-chart-financial' is not in the npm registry.
On a candlestick chart, after hovering over a value, the borders disappear if the chart is configured to display a tooltip with the following parameters :
options: {
  tooltips: {
    position: 'nearest',
    mode: 'index',
  },
},


The sample example links to:
<script src="../Chart.Financial.js" type="text/javascript"></script>
Where can I find this file? Thanks.
Hi I would like to suggest a good one.
Renko chart is an amazing chart and helps a lot in analyse finance
Currently I'm using react-stockscharts to generate my charts but I noticed renko chart from them is missing the wicks like you can see on tradingview site.
And I saw your amazing chart and would like to suggest it.
I'm trying to change to vue js but until now I don't found any lib capable do that.
I was trying to format the value for xAxes using ticks callback but seems like not all chart configurations available in chart.js are available for this plugin.
Hi, one thing to tell, this is not an issue.
Its very great to hear that the chart.js 3.0 alpha have came out!
As i looked close, it was very nice, one of the best chart script i have seen before!
I know that financial is also working it out, but its highly appreciate for the migration to financial charts too.
Many people will be looking forward :)
If there is any plan or schedule for financial alpha ver, its very great to hear!
Thank you & Regards,
Rashearth
Is it possible to use non-time related data on the x-axis?
After 2.7.2 is released with fix chartjs/Chart.js#5088
Hi, this is a wonderful plugins.
I really loved using it, but i have some issues since i upgraded to 2.8.0chart.js
Sometimes the underlined error comes out,
and the plotting stops or makes huge lags.
Do you know how i could fix this?
I upgraded all the chart.js related scripts, but wont work out
chartjs-chart-financial.js:118 Uncaught TypeError: Cannot read property 'toFixed' of undefined
    at i.label (chartjs-chart-financial.js:118)
    at Chart.min.js:7
    at Object.each (Chart.min.js:7)
    at i.getBody (Chart.min.js:7)
    at i.update (Chart.min.js:7)
    at i.handleEvent (Chart.min.js:7)
    at ni.eventHandler (Chart.min.js:7)
    at i (Chart.min.js:7)
    at HTMLCanvasElement.Fe.(anonymous function) (https://cdn.jsdelivr.net/npm/[email protected]/dist/Chart.min.js:7:77594)
Trying to plot a financial chart with data from the S&P, I ran into a strange problem. The chart itself is plotted correctly. However on the x-axis only about half of the labels and the according grid lines are drawn:

I first used the sample code of the Angular 2 Charts Demo, which works perfectly. What makes the difference is the data used. Therefore I also added the data as JSON here.
Please note, there isn't a data point for each day. There are of course no quotes on weekends or holidays. When I fake the timestamp to be continuous, the x-axis labels and grid lines are drawn correctly. Also, taking a subset of the unaltered data, works just fine.
The code is pretty straight forward:
HTML:
<div class="chart">
  <canvas
    height="500"
    baseChart
    [datasets]="chartData"
    [labels]="chartLabels"
    [options]="chartOptions"
    [colors]="chartColors"
    [legend]="false"
    chartType="candlestick"
    [plugins]="chartPlugins">
  </canvas>
</div>
The angular component:
import { Component, OnInit, ViewChild } from '@angular/core';
import 'lib/chartjs-chart-financial/chartjs-chart-financial.js';
import * as luxon from 'luxon';
import 'chartjs-adapter-luxon';
import { ChartDataSets, ChartOptions } from 'chart.js';
import { BaseChartDirective, Color, Label } from 'ng2-charts';
import { dailyQuotes } from '../models/quote-info';

@Component({
  selector: 'app-fin-chart',
  templateUrl: './fin-chart.component.html',
  styleUrls: ['./fin-chart.component.css']
})
export class FinChartComponent implements OnInit {

  public chartData: ChartDataSets[] = [ { data: [] } ];
  public chartLabels: Label[] = [];
  public chartOptions: ChartOptions = {
    responsive: true,
    maintainAspectRatio: false
  };
  public chartColors: Color[] = [
    {
      borderColor: 'black',
      backgroundColor: 'rgba(255,0,0,0.3)',
    },
  ];
  public chartPlugins = [];

  @ViewChild(BaseChartDirective, { static: true }) chart: BaseChartDirective;

  constructor() { }

  ngOnInit() {
    let ohlc = dailyQuotes.map(q => {
      let date = luxon.DateTime.fromISO(q.timestamp);
      return {
        t: date.valueOf(),
        o: q.open,
        h: q.high,
        l: q.low,
        c: q.close
      }
    });

    this.chartData =  [{ data: ohlc }];
  }
}
The data used as JSON:
export let dailyQuotes = [
  {
    "timestamp": "2019-09-16T00:00:00",
    "open": 2996.4099,
    "high": 3002.1899,
    "low": 2990.6699,
    "close": 2997.9600,
    "volume": 4274640000
  },
  {
    "timestamp": "2019-09-17T00:00:00",
    "open": 2995.6699,
    "high": 3006.2100,
    "low": 2993.7300,
    "close": 3005.7000,
    "volume": 3671840000
  },
  {
    "timestamp": "2019-09-18T00:00:00",
    "open": 3001.5000,
    "high": 3007.8301,
    "low": 2978.5701,
    "close": 3006.7300,
    "volume": 3435540000
  },
  {
    "timestamp": "2019-09-19T00:00:00",
    "open": 3010.3601,
    "high": 3021.9900,
    "low": 3003.1599,
    "close": 3006.7900,
    "volume": 3251290000
  },
  {
    "timestamp": "2019-09-20T00:00:00",
    "open": 3008.4199,
    "high": 3016.3701,
    "low": 2984.6799,
    "close": 2992.0701,
    "volume": 6094740000
  },
  {
    "timestamp": "2019-09-23T00:00:00",
    "open": 2983.5000,
    "high": 2999.1499,
    "low": 2982.2300,
    "close": 2991.7800,
    "volume": 3186590000
  },
  {
    "timestamp": "2019-09-24T00:00:00",
    "open": 3002.4299,
    "high": 3007.9800,
    "low": 2957.7300,
    "close": 2966.6001,
    "volume": 3868160000
  },
  {
    "timestamp": "2019-09-25T00:00:00",
    "open": 2968.3501,
    "high": 2989.8201,
    "low": 2952.8601,
    "close": 2984.8701,
    "volume": 3318870000
  },
  {
    "timestamp": "2019-09-26T00:00:00",
    "open": 2985.7300,
    "high": 2987.2800,
    "low": 2963.7100,
    "close": 2977.6201,
    "volume": 3077240000
  },
  {
    "timestamp": "2019-09-27T00:00:00",
    "open": 2985.4700,
    "high": 2987.3101,
    "low": 2945.5300,
    "close": 2961.7900,
    "volume": 3243650000
  },
  {
    "timestamp": "2019-09-30T00:00:00",
    "open": 2967.0701,
    "high": 2983.8501,
    "low": 2967.0701,
    "close": 2976.7400,
    "volume": 3247610000
  },
  {
    "timestamp": "2019-10-01T00:00:00",
    "open": 2983.6899,
    "high": 2992.5300,
    "low": 2938.7000,
    "close": 2940.2500,
    "volume": 3558040000
  },
  {
    "timestamp": "2019-10-02T00:00:00",
    "open": 2924.7800,
    "high": 2924.7800,
    "low": 2874.9299,
    "close": 2887.6101,
    "volume": 3912520000
  },
  {
    "timestamp": "2019-10-03T00:00:00",
    "open": 2885.3799,
    "high": 2911.1299,
    "low": 2855.9399,
    "close": 2910.6299,
    "volume": 3503640000
  },
  {
    "timestamp": "2019-10-04T00:00:00",
    "open": 2918.5601,
    "high": 2953.7400,
    "low": 2918.5601,
    "close": 2952.0100,
    "volume": 2990830000
  },
  {
    "timestamp": "2019-10-07T00:00:00",
    "open": 2944.2300,
    "high": 2959.7500,
    "low": 2935.6799,
    "close": 2938.7900,
    "volume": 2940140000
  },
  {
    "timestamp": "2019-10-08T00:00:00",
    "open": 2920.3999,
    "high": 2925.4700,
    "low": 2892.6599,
    "close": 2893.0601,
    "volume": 3356450000
  },
  {
    "timestamp": "2019-10-09T00:00:00",
    "open": 2911.1001,
    "high": 2929.3201,
    "low": 2907.4099,
    "close": 2919.3999,
    "volume": 2726820000
  },
  {
    "timestamp": "2019-10-10T00:00:00",
    "open": 2918.5500,
    "high": 2948.4600,
    "low": 2917.1201,
    "close": 2938.1299,
    "volume": 3217250000
  },
  {
    "timestamp": "2019-10-11T00:00:00",
    "open": 2963.0701,
    "high": 2993.2800,
    "low": 2963.0701,
    "close": 2970.2700,
    "volume": 3580460000
  },
  {
    "timestamp": "2019-10-14T00:00:00",
    "open": 2965.8101,
    "high": 2972.8401,
    "low": 2962.9399,
    "close": 2966.1499,
    "volume": 2557020000
  },
  {
    "timestamp": "2019-10-15T00:00:00",
    "open": 2973.6101,
    "high": 3003.2800,
    "low": 2973.6101,
    "close": 2995.6799,
    "volume": 3340740000
  },
  {
    "timestamp": "2019-10-16T00:00:00",
    "open": 2989.6799,
    "high": 2997.5400,
    "low": 2985.2000,
    "close": 2989.6899,
    "volume": 3222570000
  },
  {
    "timestamp": "2019-10-17T00:00:00",
    "open": 3000.7700,
    "high": 3008.2900,
    "low": 2991.7900,
    "close": 2997.9500,
    "volume": 3115960000
  },
  {
    "timestamp": "2019-10-18T00:00:00",
    "open": 2996.8401,
    "high": 3000.0000,
    "low": 2976.3101,
    "close": 2986.2000,
    "volume": 3264290000
  },
  {
    "timestamp": "2019-10-21T00:00:00",
    "open": 2996.4800,
    "high": 3007.3301,
    "low": 2995.3501,
    "close": 3006.7200,
    "volume": 3271620000
  },
  {
    "timestamp": "2019-10-22T00:00:00",
    "open": 3010.7300,
    "high": 3014.5701,
    "low": 2995.0400,
    "close": 2995.9900,
    "volume": 3523890000
  },
  {
    "timestamp": "2019-10-23T00:00:00",
    "open": 2994.0100,
    "high": 3004.7800,
    "low": 2991.2100,
    "close": 3004.5200,
    "volume": 3392870000
  },
  {
    "timestamp": "2019-10-24T00:00:00",
    "open": 3014.7800,
    "high": 3016.0701,
    "low": 3000.4199,
    "close": 3010.2900,
    "volume": 3692600000
  },
  {
    "timestamp": "2019-10-25T00:00:00",
    "open": 3003.3201,
    "high": 3027.3899,
    "low": 3001.9399,
    "close": 3022.5500,
    "volume": 3370370000
  },
  {
    "timestamp": "2019-10-28T00:00:00",
    "open": 3032.1201,
    "high": 3044.0801,
    "low": 3032.1201,
    "close": 3039.4199,
    "volume": 3521230000
  },
  {
    "timestamp": "2019-10-29T00:00:00",
    "open": 3035.3899,
    "high": 3047.8701,
    "low": 3034.8101,
    "close": 3036.8899,
    "volume": 3589930000
  },
  {
    "timestamp": "2019-10-30T00:00:00",
    "open": 3039.7400,
    "high": 3050.1001,
    "low": 3025.9600,
    "close": 3046.7700,
    "volume": 3776030000
  },
  {
    "timestamp": "2019-10-31T00:00:00",
    "open": 3046.8999,
    "high": 3046.8999,
    "low": 3023.1899,
    "close": 3037.5601,
    "volume": 4139280000
  },
  {
    "timestamp": "2019-11-01T00:00:00",
    "open": 3050.7200,
    "high": 3066.9500,
    "low": 3050.7200,
    "close": 3066.9099,
    "volume": 3930200000
  },
  {
    "timestamp": "2019-11-04T00:00:00",
    "open": 3078.9600,
    "high": 3085.2000,
    "low": 3074.8701,
    "close": 3078.2700,
    "volume": 4146850000
  },
  {
    "timestamp": "2019-11-05T00:00:00",
    "open": 3080.8000,
    "high": 3083.9500,
    "low": 3072.1499,
    "close": 3074.6201,
    "volume": 4486130000
  },
  {
    "timestamp": "2019-11-06T00:00:00",
    "open": 3075.1001,
    "high": 3078.3401,
    "low": 3065.8899,
    "close": 3076.7800,
    "volume": 4458190000
  },
  {
    "timestamp": "2019-11-07T00:00:00",
    "open": 3087.0200,
    "high": 3097.7700,
    "low": 3080.2300,
    "close": 3085.1799,
    "volume": 4144640000
  },
  {
    "timestamp": "2019-11-08T00:00:00",
    "open": 3081.2500,
    "high": 3093.0901,
    "low": 3073.5801,
    "close": 3093.0801,
    "volume": 3499150000
  },
  {
    "timestamp": "2019-11-11T00:00:00",
    "open": 3080.3301,
    "high": 3088.3301,
    "low": 3075.8201,
    "close": 3087.0100,
    "volume": 3035530000
  },
  {
    "timestamp": "2019-11-12T00:00:00",
    "open": 3089.2800,
    "high": 3102.6101,
    "low": 3084.7300,
    "close": 3091.8401,
    "volume": 3466010000
  },
  {
    "timestamp": "2019-11-13T00:00:00",
    "open": 3084.1799,
    "high": 3098.0601,
    "low": 3078.8000,
    "close": 3094.0400,
    "volume": 3509280000
  },
  {
    "timestamp": "2019-11-14T00:00:00",
    "open": 3090.7500,
    "high": 3098.2000,
    "low": 3083.2600,
    "close": 3096.6299,
    "volume": 3276070000
  },
  {
    "timestamp": "2019-11-15T00:00:00",
    "open": 3107.9199,
    "high": 3120.4600,
    "low": 3104.6001,
    "close": 3120.4600,
    "volume": 3335650000
  },
  {
    "timestamp": "2019-11-18T00:00:00",
    "open": 3117.9099,
    "high": 3124.1699,
    "low": 3112.0601,
    "close": 3122.0300,
    "volume": 3436690000
  },
  {
    "timestamp": "2019-11-19T00:00:00",
    "open": 3127.4500,
    "high": 3127.6399,
    "low": 3113.4700,
    "close": 3120.1799,
    "volume": 3590070000
  },
  {
    "timestamp": "2019-11-20T00:00:00",
    "open": 3114.6599,
    "high": 3118.9700,
    "low": 3091.4099,
    "close": 3108.4600,
    "volume": 4034890000
  },
  {
    "timestamp": "2019-11-21T00:00:00",
    "open": 3108.4900,
    "high": 3110.1101,
    "low": 3094.5500,
    "close": 3103.5400,
    "volume": 3720560000
  },
  {
    "timestamp": "2019-11-22T00:00:00",
    "open": 3111.4099,
    "high": 3112.8701,
    "low": 3099.2600,
    "close": 3110.2900,
    "volume": 3226780000
  },
  {
    "timestamp": "2019-11-25T00:00:00",
    "open": 3117.4399,
    "high": 3133.8301,
    "low": 3117.4399,
    "close": 3133.6399,
    "volume": 3511530000
  },
  {
    "timestamp": "2019-11-26T00:00:00",
    "open": 3134.8501,
    "high": 3142.6899,
    "low": 3131.0000,
    "close": 3140.5200,
    "volume": 4595590000
  },
  {
    "timestamp": "2019-11-27T00:00:00",
    "open": 3145.4900,
    "high": 3154.2600,
    "low": 3143.4099,
    "close": 3153.6299,
    "volume": 3033090000
  },
  {
    "timestamp": "2019-11-29T00:00:00",
    "open": 3147.1799,
    "high": 3150.3000,
    "low": 3139.3401,
    "close": 3140.9800,
    "volume": 1743020000
  },
  {
    "timestamp": "2019-12-02T00:00:00",
    "open": 3143.8501,
    "high": 3144.3101,
    "low": 3110.7800,
    "close": 3113.8701,
    "volume": 3268740000
  },
  {
    "timestamp": "2019-12-03T00:00:00",
    "open": 3087.4099,
    "high": 3094.9700,
    "low": 3070.3301,
    "close": 3093.2000,
    "volume": 3653390000
  },
  {
    "timestamp": "2019-12-04T00:00:00",
    "open": 3103.5000,
    "high": 3119.3799,
    "low": 3102.5300,
    "close": 3112.7600,
    "volume": 3695030000
  },
  {
    "timestamp": "2019-12-05T00:00:00",
    "open": 3119.2100,
    "high": 3119.4500,
    "low": 3103.7600,
    "close": 3117.4299,
    "volume": 3355750000
  },
  {
    "timestamp": "2019-12-06T00:00:00",
    "open": 3134.6201,
    "high": 3150.6001,
    "low": 3134.6201,
    "close": 3145.9099,
    "volume": 3479480000
  },
  {
    "timestamp": "2019-12-09T00:00:00",
    "open": 3141.8601,
    "high": 3148.8701,
    "low": 3135.4600,
    "close": 3135.9600,
    "volume": 3345990000
  },
  {
    "timestamp": "2019-12-10T00:00:00",
    "open": 3135.3601,
    "high": 3142.1201,
    "low": 3126.0901,
    "close": 3132.5200,
    "volume": 3343790000
  },
  {
    "timestamp": "2019-12-11T00:00:00",
    "open": 3135.7500,
    "high": 3143.9800,
    "low": 3133.2100,
    "close": 3141.6299,
    "volume": 3252540000
  },
  {
    "timestamp": "2019-12-12T00:00:00",
    "open": 3141.2300,
    "high": 3176.2800,
    "low": 3138.4700,
    "close": 3168.5701,
    "volume": 3990690000
  },
  {
    "timestamp": "2019-12-13T00:00:00",
    "open": 3166.6499,
    "high": 3182.6799,
    "low": 3156.5100,
    "close": 3168.8000,
    "volume": 3736870000
  },
  {
    "timestamp": "2019-12-16T00:00:00",
    "open": 3183.6299,
    "high": 3197.7100,
    "low": 3183.6299,
    "close": 3191.4500,
    "volume": 4051790000
  },
  {
    "timestamp": "2019-12-17T00:00:00",
    "open": 3195.3999,
    "high": 3198.2200,
    "low": 3191.0300,
    "close": 3192.5200,
    "volume": 3837540000
  },
  {
    "timestamp": "2019-12-18T00:00:00",
    "open": 3195.2100,
    "high": 3198.4800,
    "low": 3191.1399,
    "close": 3191.1399,
    "volume": 4014080000
  },
  {
    "timestamp": "2019-12-19T00:00:00",
    "open": 3192.3201,
    "high": 3205.4800,
    "low": 3192.3201,
    "close": 3205.3701,
    "volume": 3720450000
  },
  {
    "timestamp": "2019-12-20T00:00:00",
    "open": 3223.3301,
    "high": 3225.6499,
    "low": 3216.0300,
    "close": 3221.2200,
    "volume": 6454270000
  },
  {
    "timestamp": "2019-12-23T00:00:00",
    "open": 3226.0500,
    "high": 3227.7800,
    "low": 3222.3000,
    "close": 3224.0100,
    "volume": 3060610000
  },
  {
    "timestamp": "2019-12-24T00:00:00",
    "open": 3225.4500,
    "high": 3226.4299,
    "low": 3220.5100,
    "close": 3223.3799,
    "volume": 1296540000
  },
  {
    "timestamp": "2019-12-26T00:00:00",
    "open": 3227.2000,
    "high": 3240.0801,
    "low": 3227.2000,
    "close": 3239.9099,
    "volume": 2160680000
  },
  {
    "timestamp": "2019-12-27T00:00:00",
    "open": 3247.2300,
    "high": 3247.9299,
    "low": 3234.3701,
    "close": 3240.0200,
    "volume": 2428670000
  },
  {
    "timestamp": "2019-12-30T00:00:00",
    "open": 3240.0901,
    "high": 3240.9199,
    "low": 3216.5701,
    "close": 3221.2900,
    "volume": 3013290000
  },
  {
    "timestamp": "2019-12-31T00:00:00",
    "open": 3215.1799,
    "high": 3231.7200,
    "low": 3212.0300,
    "close": 3230.7800,
    "volume": 2893810000
  },
  {
    "timestamp": "2020-01-02T00:00:00",
    "open": 3244.6699,
    "high": 3258.1399,
    "low": 3235.5300,
    "close": 3257.8501,
    "volume": 3458250000
  },
  {
    "timestamp": "2020-01-03T00:00:00",
    "open": 3226.3601,
    "high": 3246.1499,
    "low": 3222.3401,
    "close": 3234.8501,
    "volume": 3461290000
  },
  {
    "timestamp": "2020-01-06T00:00:00",
    "open": 3217.5500,
    "high": 3246.8401,
    "low": 3214.6399,
    "close": 3246.2800,
    "volume": 3674070000
  },
  {
    "timestamp": "2020-01-07T00:00:00",
    "open": 3241.8601,
    "high": 3244.9099,
    "low": 3232.4299,
    "close": 3237.1799,
    "volume": 3420380000
  },
  {
    "timestamp": "2020-01-08T00:00:00",
    "open": 3238.5901,
    "high": 3267.0701,
    "low": 3236.6699,
    "close": 3253.0500,
    "volume": 3720890000
  },
  {
    "timestamp": "2020-01-09T00:00:00",
    "open": 3266.0300,
    "high": 3275.5801,
    "low": 3263.6699,
    "close": 3274.7000,
    "volume": 3638390000
  },
  {
    "timestamp": "2020-01-10T00:00:00",
    "open": 3281.8101,
    "high": 3282.9900,
    "low": 3260.8601,
    "close": 3265.3501,
    "volume": 3212970000
  },
  {
    "timestamp": "2020-01-13T00:00:00",
    "open": 3271.1299,
    "high": 3288.1299,
    "low": 3268.4299,
    "close": 3288.1299,
    "volume": 3456380000
  },
  {
    "timestamp": "2020-01-14T00:00:00",
    "open": 3285.3501,
    "high": 3287.8501,
    "low": 3278.9199,
    "close": 3287.8501,
    "volume": 620683985
  }
]I have strange situation, don't know, related with scale or auto zoom.
But when I move mouse on candles graph, bars is moving unpredictable.
I can send archive with static HTML,css and JS. Please let me know e-mail.
Thanks. My email : [email protected] Telegram: @AlexGruPerm (https://t.me/AlexGruPerm)
You missed a bit on the upgrade to v3.0.0alpha...
Chart.defaults.global.tooltips
is now
Chart.defaults.tooltips
Unsure if this already exists, but is there a way to plot cumulative sums (e.g. cumulative returns).
Hi, thx again for the wonderful app!
the mixed chart for financial and other bar or scatter implementing seems good!
but there is one issue for tooltip displaying.
Whenever i try to display the tooltip, it looks fine for barchart+ financial chart,

but when i display it for financial chart+ scatter chart, the tooltip shows up far from the mouse hovering.as you could see in the screenshot, it moves on top of the y axis.

Could you kindly tell me if there any way to fix it?
Thank you,
Rasearth
hi, if you can introduce a cross line to get tooltip on a fix area for data of o,c,h,l,v, it will be great
A reference is this:
https://bitcoinwisdom.com/markets/bitstamp/btcusd
Thanks.
Trying to build the project, got an error after running gulp build, what am I doing wrong?
Steps to reproduce
> git clone https://github.com/chartjs/chartjs-chart-financial/
> cd chartjs-chart-financial
> npm install
> gulp build
Confirmed there were no missing dependencies
➜ chartjs-chart-financial git:(master) npm install
audited 7632 packages in 6.617s
found 0 vulnerabilities
➜ chartjs-chart-financial git:(master) gulp build
[00:11:53] Using gulpfile ~/VirtualBox/Win10/chartjs-chart-financial/gulpfile.js
[00:11:53] Starting 'build'...
[00:11:53] Starting 'rollupTask'...
[00:11:53] 'rollupTask' errored after 6.31 ms
[00:11:53] Error: Cannot find module 'rollup/bin/rollup'
at Function.Module._resolveFilename (internal/modules/cjs/loader.js:613:15)
at Function.resolve (internal/modules/cjs/helpers.js:28:19)
at run (/Users/andre/VirtualBox/Win10/chartjs-chart-financial/gulpfile.js:42:21)
at rollupTask (/Users/andre/VirtualBox/Win10/chartjs-chart-financial/gulpfile.js:51:3)
at bound (domain.js:400:14)
at runBound (domain.js:413:12)
at asyncRunner (/Users/andre/VirtualBox/Win10/chartjs-chart-financial/node_modules/async-done/index.js:55:18)
at processTicksAndRejections (internal/process/next_tick.js:74:9)
[00:11:53] 'build' errored after 11 ms
> node --version
v11.10.0
> npm --version
6.7.0
> gulp --version
CLI version: 2.2.0
Local version: 4.0.2
Should be able to implement getRightValue in the scale instead of overriding draw
I need a way to implement this extra lib plugin. This is what I get to see after I add the chart.financial.js file in the index of Angular 6:
Uncaught TypeError: Cannot read property 'helpers' of undefined
    at module.exports (chart.financial.js:438)
    at Object.8../controller.candlestick.js (chart.financial.js:423)
    at o (chart.financial.js:9)
    at r (chart.financial.js:9)
    at chart.financial.js:9
I know that this is not in the npm registry yet. Would you consider adding it as a -beta.x or with a @next tag? It would get more adoption while setting the expectation that it's not ready for prime time. This is a pattern that other libraries, such as vuefire with firestore support, has used.
A declarative, efficient, and flexible JavaScript library for building user interfaces.
🖖 Vue.js is a progressive, incrementally-adoptable JavaScript framework for building UI on the web.
TypeScript is a superset of JavaScript that compiles to clean JavaScript output.
An Open Source Machine Learning Framework for Everyone
The Web framework for perfectionists with deadlines.
A PHP framework for web artisans
Bring data to life with SVG, Canvas and HTML. 📊📈🎉
JavaScript (JS) is a lightweight interpreted programming language with first-class functions.
Some thing interesting about web. New door for the world.
A server is a program made to process requests and deliver data to clients.
Machine learning is a way of modeling and interpreting data that allows a piece of software to respond intelligently.
Some thing interesting about visualization, use data art
Some thing interesting about game, make everyone happy.
We are working to build community through open source technology. NB: members must have two-factor auth.
Open source projects and samples from Microsoft.
Google ❤️ Open Source for everyone.
Alibaba Open Source for everyone
Data-Driven Documents codes.
China tencent open source team.