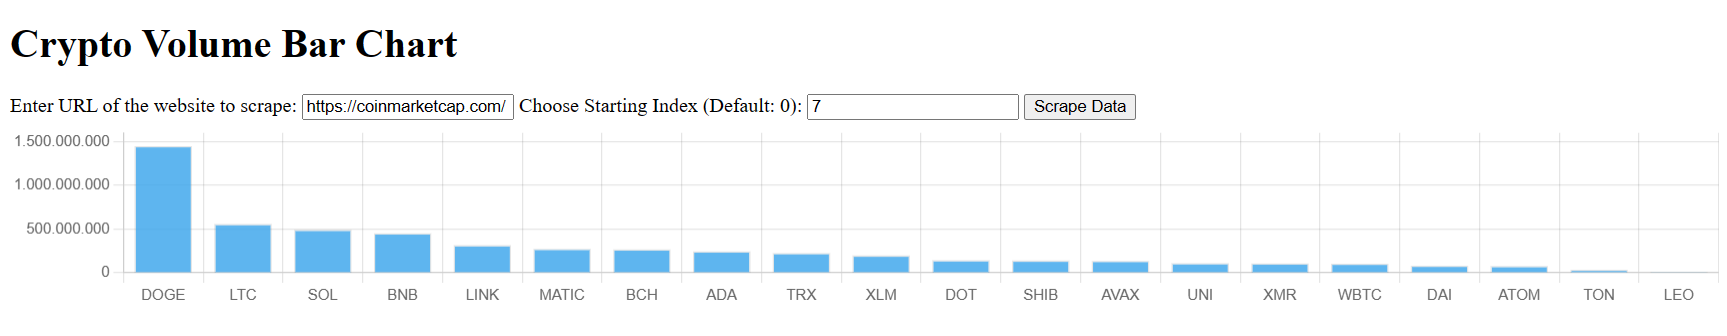
Crypto Volume Bar Chart is a web application that allows users to scrape cryptocurrency data from a specified website and visualize the trading volumes as a bar chart. The app is built with Python, Flask, Socket.IO, and Chart.js.
-
Real-time data scraping using WebSockets: The app updates the bar chart dynamically as new volume data becomes available.
-
Interactive web interface: Users can input the website URL from which they want to scrape data and view the bar chart with volume data.
-
Customizable starting index: Users can choose the starting index for the displayed data in the chart.
-
Export data: Users can export the scraped data in JSON format.
- Clone the repository:
git clone https://github.com/CharlieCidral/crypto-volume-bar-chart.git- Install the required libraries:
pip install Flask Flask-SocketIO requests selenium beautifulsoup4 matplotlib pandas- Run the app:
python app.py
- Access the app in your web browser at
http://127.0.0.1:5000/.
- Enter the URL(
https://coinmarketcap.com/) of the website you want to scrape in the provided input field. - (Optional) Choose the starting index for the displayed data in the chart. The default is 0.
- Click the "Scrape Data" button. The app will scrape the data and update the bar chart in real-time.
- Flask: Web framework for building the application.
- Flask-SocketIO: Provides WebSocket support for real-time communication.
- requests: HTTP library for making web requests.
- selenium: Web browser automation library for web scraping.
- beautifulsoup4: Library for parsing HTML and XML documents.
- matplotlib: Library for creating visualizations, including the bar chart.
- pandas: Data analysis library for handling data structures and manipulation.
Contributions are welcome! Feel free to open an issue or submit a pull request with any improvements or bug fixes.
