Coder Social home page Coder Social logo

pyflowchart's Introduction

PyFlowchart

English | 机翻中文

PyFlowchart is a Python package that lets you:

  • Write flowcharts in Python.
  • Translate Python source code into flowcharts.

PyFlowchart produces flowcharts in the flowchart.js flowchart DSL, a widely used textual representation of flowcharts. You can convert these flowcharts to images using flowchart.js.org, francoislaberge/diagrams, or some markdown editors. Alternatively, we also support an option to output the generated flowchart into a interactive HTML page.

Get PyFlowchart

$ pip install pyflowchart

Quick Start

Want to flowchart your Python code in example.py? Run this:

$ python -m pyflowchart example.py

⚠️ PyFlowchart works with Python 3.7+. To check your Python version, run python --version.

If you have both Python 2 and Python 3 installed, you may need to use python3 instead of python. This is becoming less common as Python 2 is sunsetting.

PyFlowchart will output the generated flowchart.js DSL. You can convert the output code to a rendered diagram by going to http://flowchart.js.org or using editors like Typora.

To output a HTML file containing the generated flowchart:

$ python -m pyflowchart example.py -o example.html
$ # open example.html

Open example.html in your browser to see the output in graphical representation.

To specify a function (or a method in a class) to flowchartlize:

  • Use the -f flag to specify the function or method name.
$ python -m pyflowchart example.py -f function_name
# or
$ python -m pyflowchart example.py -f ClassName.method_name

For example, to flowchartlize the add() function in the MyClass class, you would use the following command: python3 -m pyflowchart example.py -f MyClass.add.

🎉 Now you are ready to flowchart your code!

To learn more about how to use PyFlowchart, keep reading this document.

Flowchart in Python

PyFlowchart lets you write flowcharts in Python, which can be automatically translated into the flowchart.js DSL.

The following flowchart.js node types are supported:

  • StartNode
  • OperationNode
  • ConditionNode
  • InputOutputNode
  • SubroutineNode
  • EndNode

To connect nodes, use the connect() method. For ConditionNodes, use the connect_{yes|no} syntax. You can optionally specify the connect_direction as a second parameter.

Get a Flowchart with your start node and call its flowchart() method to generate flowchart.js flowchart DSL:

from pyflowchart import *

st = StartNode('a_pyflow_test')
op = OperationNode('do something')
cond = ConditionNode('Yes or No?')
io = InputOutputNode(InputOutputNode.OUTPUT, 'something...')
sub = SubroutineNode('A Subroutine')
e = EndNode('a_pyflow_test')

st.connect(op)
op.connect(cond)
cond.connect_yes(io)
cond.connect_no(sub)
sub.connect(op, "right")  # sub->op line starts from the right of sub
io.connect(e)
 
fc = Flowchart(st)
print(fc.flowchart())

Output:

st0=>start: start a_pyflow_test
op1=>operation: do something
cond2=>condition: Yes or No?
io3=>inputoutput: output: something...
e5=>end: end a_pyflow_test
sub4=>subroutine: A Subroutine

st0->op1
op1->cond2
cond2->
cond2->
cond2(yes)->io3
io3->e5
cond2(no)->sub4
sub4(right)->op1

You can visit http://flowchart.js.org and translate the generated textual representation into SVG flow chart diagrams:

screenshot on flowchart.js page

(v0.3.0) You can also use pyflowchart.output_html to generate a page similar to the picture above:

output_html('output.html', 'a_pyflow_test', fc.flowchart())

By the way, many Markdown editors, like Typora, also support this flowchart syntax. For more information, see the Typora documentation on flowcharts. If you prefer the command line, you can use francoislaberge/diagrams.

Set Params to Nodes

Starting with v0.2.0, you can use the Node.set_param(key, value) method to generate flowcharts like this:

element(param1=value1,param2=value2)=>start: Start

(See also adrai/flowchart.js#node-specific-specifiers-by-type)

There is also a shortcut to set the align-next=no parameter for ConditionNodes:

cond = ConditionNode("a cond node")
cond.no_align_next()
# or do this at __init__:
cond = ConditionNode("a cond node", align_next=False)

This usually works with a connect_direction customization:

cond.connect_yes(op, "right")

The generated flowchart will look like:

cond(align-next=no)=>condition: Yes or No?
...
cond(yes,right)->op

Python to Flowchart

PyFlowchart can also translate your Python code into flowcharts.

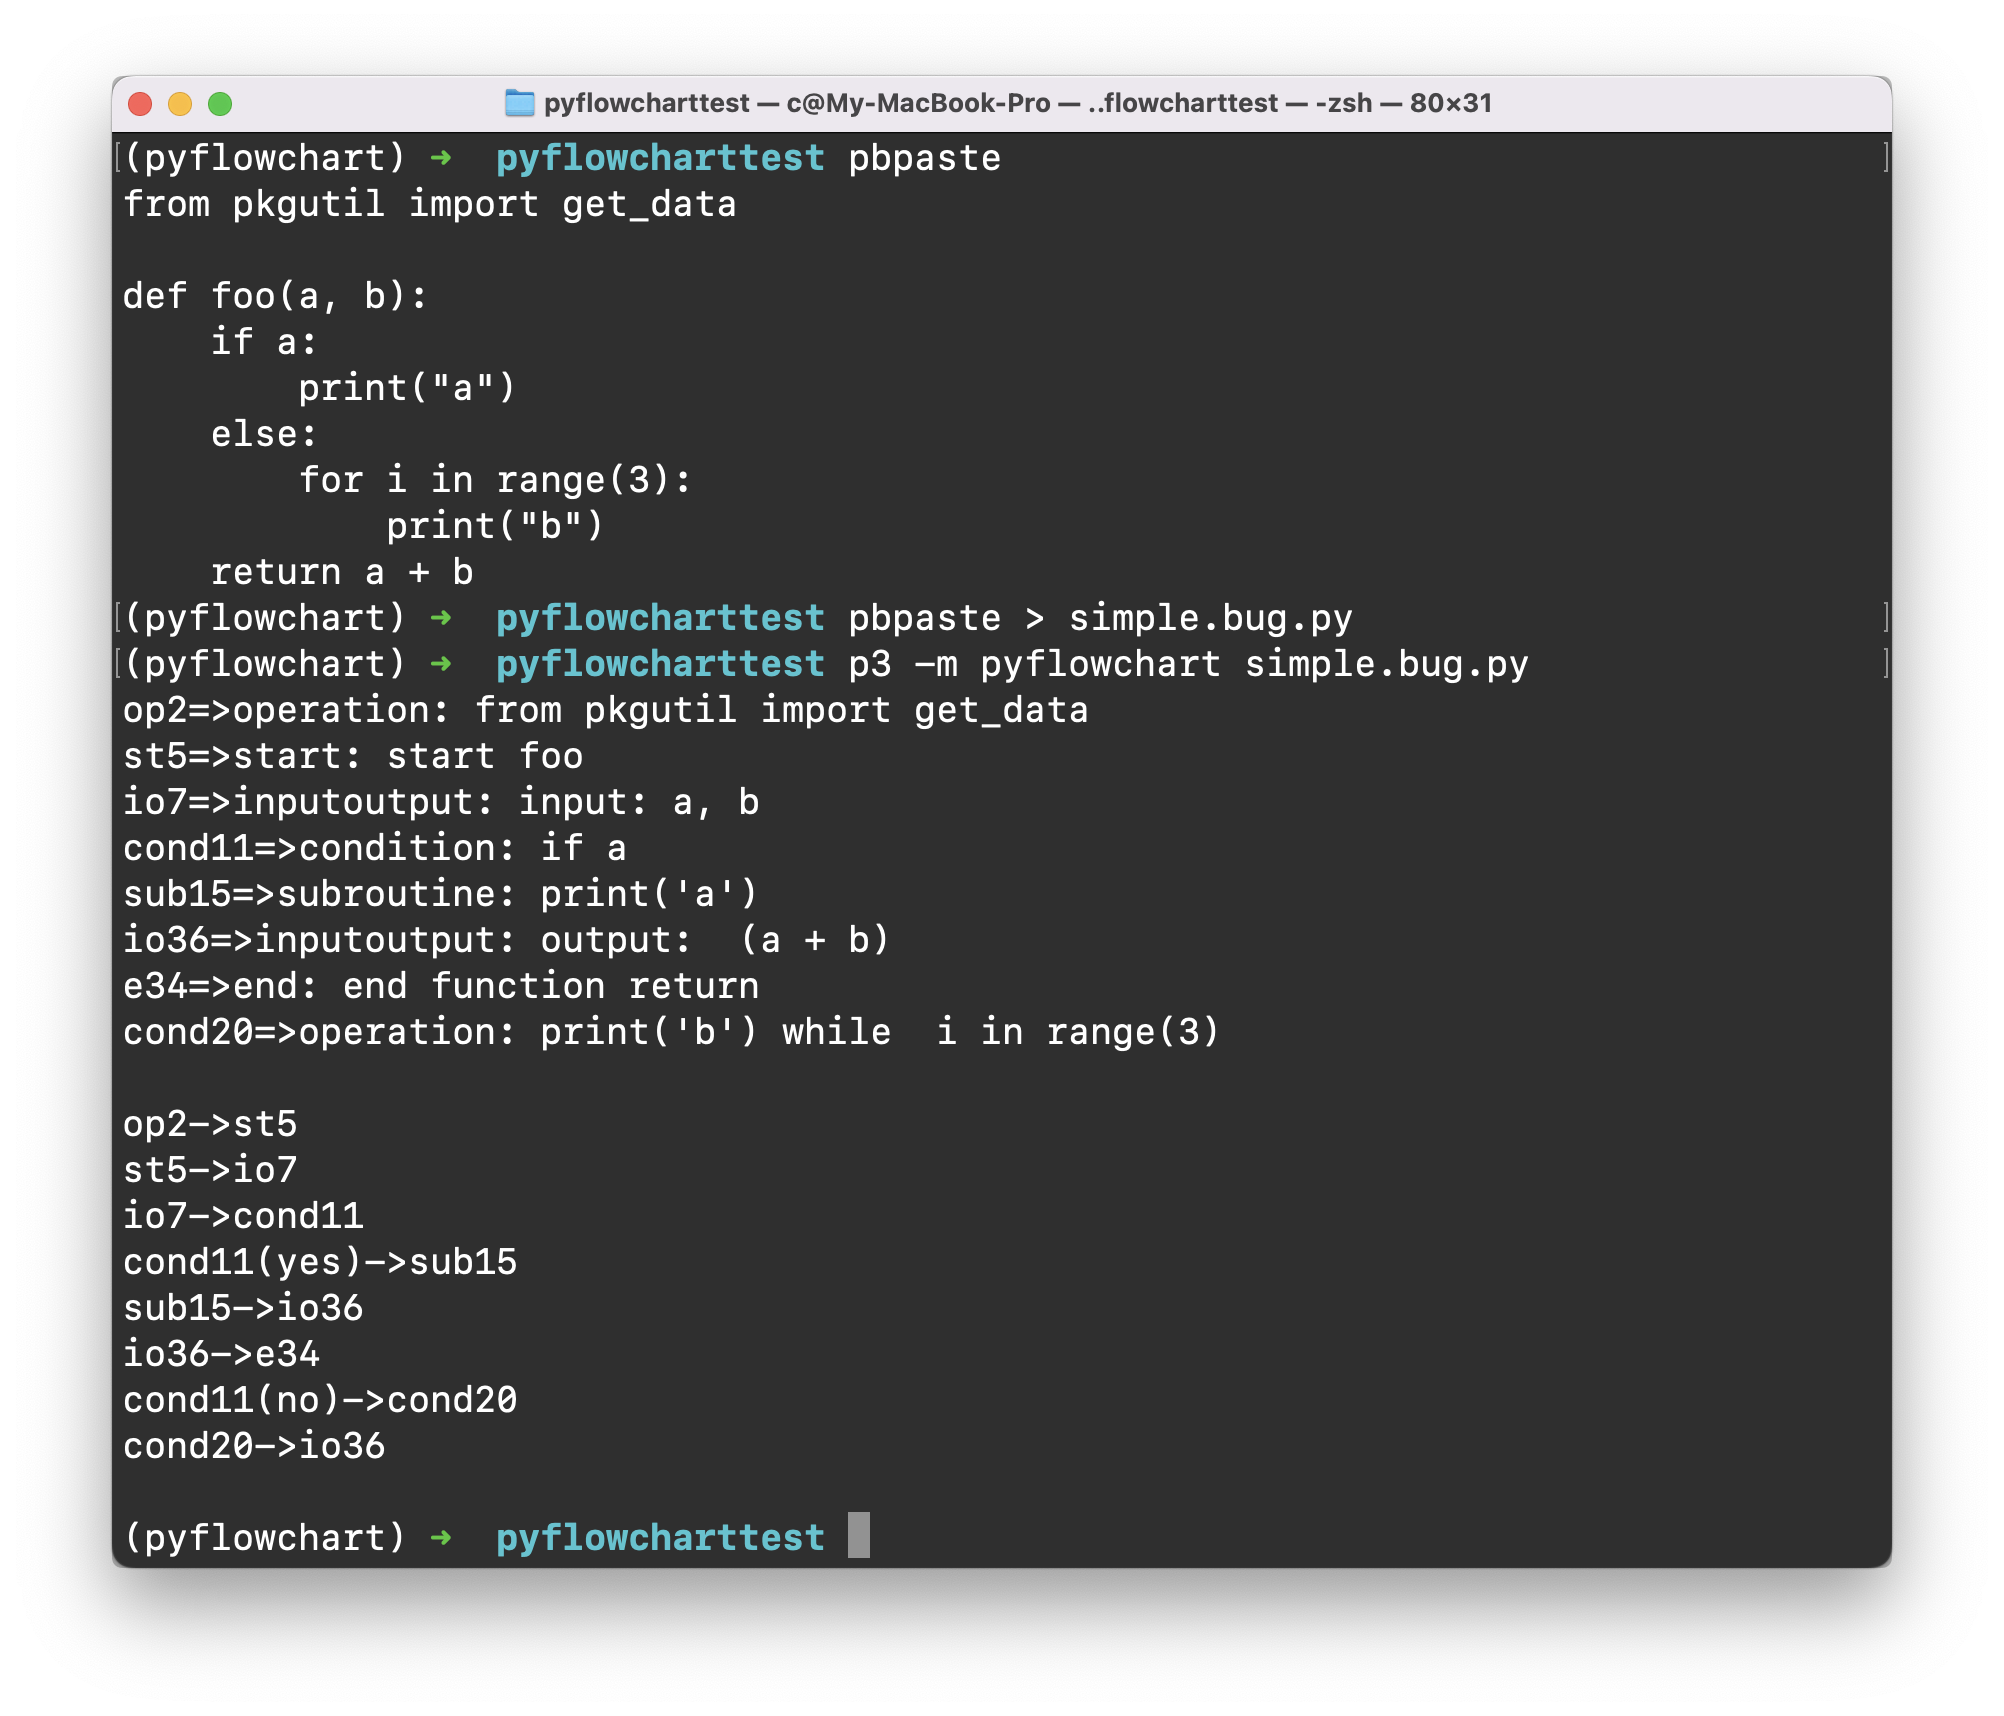
For example, let's say you have a Python file called simple.py with the following code:

def foo(a, b):
    if a:
        print("a")
    else:
        for i in range(3):
            print("b")
    return a + b

To generate a flowchart from this code, you can run the following command in the terminal:

$ python -m pyflowchart simple.py

# output flowchart code.

Or, in Python:

>>> from pyflowchart import Flowchart
>>> with open('simple.py') as f:
...     code = f.read()
... 
>>> fc = Flowchart.from_code(code)
>>> print(fc.flowchart())

# output flowchart code.

simple.py to flowchart

Advanced Usages

As mentioned above, we use Flowchart.from_code to translate Python codes into Flowcharts. The from_code is defined as:

Flowchart.from_code(code, field="", inner=True, simplify=True, conds_align=False)
  • code: The Python code to be converted into a flowchart.
  • field: The name of a field in the code to be converted into a flowchart. If this parameter is not specified, the entire code will be converted.
  • inner: If True, the body of the field will be parsed as a nested flowchart. If False, the body of the field will be parsed as a single node.
  • simplify: If True, simple If and Loop statements will be simplified. For example, an If statement with a single expression will be converted into a single node.
  • conds_align: If True, consecutive If statements will be aligned in the flowchart.

PyFlowchart CLI is an interface for this function:

python -m pyflowchart [-f FIELD] [-i] [--no-simplify] [--conds-align] [-o OUTPUT] code_file
  • -f FIELD: The name of the field to be converted into a flowchart.
  • -i: If specified, the body of the field will be parsed as a nested flowchart.
  • --no-simplify: If specified, the If and Loop statements will not be simplified.
  • --conds-align: If specified, consecutive If statements will be aligned in the flowchart.
  • -o OUTPUT: If specified, output the flowchart to specific file with a format indicating by the extension name. (only support *.html for now)

⚠️ -o is not a part of Flowchart.from_code. It's from pyflowchar import output_html.

field

the field is the path to a field (i.e. a function) you want to draw a flowchart.

# example.py
print("start")

def foo():
    foo = "foo"

class Bar():
    def buzz(self, f):
        def g(self):
            print("g")
            f(self)
        return g(self)

Bar().buzz(foo)
print("end")

For example.py above, available paths are:

- "" (means the whole code)
- "foo"
- "Bar.buzz"
- "Bar.buzz.g"

To generate a flowchart of Bar.buzz.g

# Python
from pyflowchart import Flowchart
with open('example.py') as f:
	code = f.read()
fc = Flowchart.from_code(code, field='Bar.buzz.g', inner=False)
print(fc.flowchart())

Or:

# CLI
python -m pyflowchart example.py -f Bar.buzz.g

Output result:

specify a field

inner

The inner parameter controls how the parser behaves. If inner=True, the parser will look into the field and parse its body. If inner=False, the parser will take the field as a single node.

pyflowchart_inner

In CLI, the -i argument sets inner=True. The absence of -i argument implies inner=False.

🔧 For developers: Techly, inner=True means parsing field.body, while inner=False parses [field].

simplify

The simplify parameter controls whether to simplify If and Loop statements. When simplify=True, an If or Loop statements with one-line-body will be simplified into a single node.

For example, the following code:

# example_simplify.py
a = 1
if a == 1:
    print(a)
while a < 4:
    a = a + 1

Would be converted into the following flowchart when simplify=True :

flowchart = Flowchart.from_code(example_simplify_py, field="", inner=True)
print(flowchart.flowchart())
# SH $ python -m pyflowchart example_simplify.py 

simplify result

And with simplify=False:

flowchart = Flowchart.from_code(example_simplify_py, field="", inner=True, simplify=False)
print(flowchart.flowchart())
# SH $ python -m pyflowchart --no-simplify example_simplify.py 

no simplify result

conds-align (Beta)

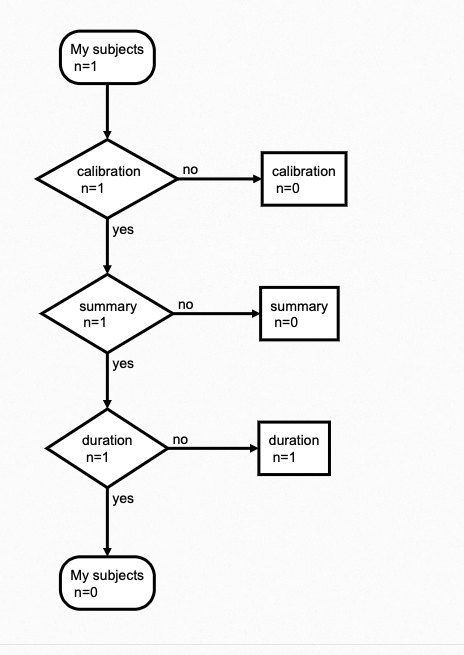
The conds-align parameter controls whether consecutive If statements are aligned in the flowchart. When conds-align=True, consecutive If statements are aligned in the flowchart.

# example-conds-align.py
if cond1:
	op1
if cond2:
	op2
if cond3:
	op3
op_end

conds-align-result

Note: This feature is still in beta and may not work perfectly in all cases.

output html and images

You can also directly ouput the generated flowchart.js DSL into an html by adding the parameter -o output.html where you specify an output filename ending in .html or .htm.

output-html

Opening the output.html in your browser will let you visualize the diagrams. You can tweak the code and click run to update the diagram. There are also links to download the current visuals as a .svg or .png image.

⚠️ The output file specified will overwrite any file that already has that name.

🐍 To use this feature via Python instead of CLI, call output_html(output_name: str, field_name: str, flowchart: str) -> None:

>>> import pyflowchart
>>> help(pyflowchart.output_html)

Beautify Flowcharts

The flowcharts generated by PyFlowchart may not always be perfect. In these cases, you can modify the generated flowchart code yourself or consider making your Python source code more clear. Clear and beautiful Python source code will result in more beautiful flowcharts generated by PyFlowchart.

An example: If you don't like the flowchart flow direction you can tweak a condition by modifying with with directions such as:

beautify-flowchart-example

TODOs

  • Directly generate flowchart SVG/HTML:
$ pyflowchart example.py -o flowchart.svg

Depends on node.js and flowchart.js.

  • PyFlowchart GUI

A GUI for PyFlowchart would be amazing. You could paste your Python code into it, and the flowchart DSL would be generated in real time, with the flowchart displayed alongside it. You could clearly see how the two are related.

  • The Chinese README your buddies waiting for! 希望有同学帮助贡献个中文 README 呀。
  • Tests automation.

Unfortunately, I am too busy (pronounced as [ˈlеizi]——lazy) to code these ideas myself. Please submit an issue to push me on. Or, PR to make it by yourself. I cannot wait to appreciate your great contribution!

References

License

Copyright 2020-2023 CDFMLR. All rights reserved.

Licensed under the MIT License.

pyflowchart's People

Contributors

cdfmlr avatar ddfault avatar

Stargazers

 avatar  avatar  avatar  avatar  avatar  avatar  avatar  avatar  avatar  avatar  avatar  avatar  avatar  avatar  avatar  avatar  avatar  avatar  avatar  avatar  avatar  avatar  avatar  avatar  avatar  avatar  avatar  avatar  avatar  avatar  avatar  avatar  avatar  avatar  avatar  avatar  avatar  avatar  avatar  avatar  avatar  avatar  avatar  avatar  avatar  avatar  avatar  avatar  avatar  avatar  avatar  avatar  avatar  avatar  avatar  avatar  avatar  avatar  avatar  avatar  avatar  avatar  avatar  avatar  avatar  avatar  avatar  avatar  avatar  avatar  avatar  avatar  avatar  avatar  avatar  avatar  avatar  avatar  avatar  avatar  avatar  avatar  avatar  avatar  avatar  avatar  avatar  avatar  avatar  avatar  avatar  avatar  avatar  avatar  avatar  avatar  avatar  avatar  avatar  avatar

Watchers

 avatar  avatar  avatar  avatar  avatar  avatar

pyflowchart's Issues

CLI running `python3 -m pyflowchart simple.py` got no outputs

People complain to me about pyflowchart outputting nothing! Here is an example:

test51f7b490-9c2a-4267-84a4-3006e144e08e jpg

Where simple.py is defined as:

from pkgutil import get_data

def foo(a, b):
    if a:
        print("a")
    else:
        for i in range(3):
            print("b")
    return a + b

Awfully strange it is that pyflowchart works well on my mac for the instance above:

testda96b50f-a211-43cf-9a33-e2fe718ef31e jpg

Whatever I know at the moment is that the described wrong behavior may be another bug related to the Windows :(

To handle this, I need more feedback.

windows: UnicodeDecodeError: 'gbk' codec can't decode

Env

  • windwos 10 amd64
  • py 3.9.0
  • pyflowchart 0.1.0

Err

code

# This is statement is required by the build system to query build info
if __name__ == '__build__':
    raise Exception

# cube.py
# Converted to Python by Jason Petrone 6/00

import sys

try:
    from OpenGL.GLUT import *
    from OpenGL.GL import *
    from OpenGL.GLU import *
except:
    print("ERROR: PyOpenGL not installed properly")


def init():
    glClearColor(0.0, 0.0, 0.0, 0.0)
    glShadeModel(GL_FLAT)


def display():
    glClear(GL_COLOR_BUFFER_BIT)
    glColor3f(1.0, 1.0, 1.0)
    glLoadIdentity()  # clear the matrix
    # viewing transformation
    gluLookAt(0.0, 0.0, 5.0, 0.0, 0.0, 0.0, 0.0, 1.0, 0.0)
    glScalef(1.0, 2.0, 1.0)  # modeling transformation
    glutWireCube(1.0)
    glFlush()


def reshape(w, h):
    glViewport(0, 0, w, h)
    glMatrixMode(GL_PROJECTION)
    glLoadIdentity()
    glFrustum(-1.0, 1.0, -1.0, 1.0, 1.5, 20.0)
    glMatrixMode(GL_MODELVIEW)


glutInit(sys.argv)
glutInitDisplayMode(GLUT_SINGLE | GLUT_RGB)
glutInitWindowSize(500, 500)
glutInitWindowPosition(100, 100)
glutCreateWindow('cube')
init()
glutDisplayFunc(display)
glutReshapeFunc(reshape)

glutMainLoop()

Exceptioin

$ python -m pyflowchart cube.py
Traceback (most recent call last):
  File "D:\Program Files\Python\Python39\lib\runpy.py", line 197, in _run_module_as_main
    return _run_code(code, main_globals, None,
  File "D:\Program Files\Python\Python39\lib\runpy.py", line 87, in _run_code
    exec(code, run_globals)
  File "D:\Program Files\Python\Python39\lib\site-packages\pyflowchart\__main__.py", line 33, in <module>
    main(args.code_file, args.field, args.inner)
  File "D:\Program Files\Python\Python39\lib\site-packages\pyflowchart\__main__.py", line 16, in main
    code = code_file.read()
UnicodeDecodeError: 'gbk' codec can't decode byte 0xaa in position 355: illegal multibyte sequence

另一个代码证明了不是code问题,也爆出了同样的错误,因此错误是由于该模块本身的问题...但是我目前的知识还不足以维护这个模块...

code2

import math
#  计算磁环的横截面积F  cm^2
def calMagnetRingCrossArea(D, d, h):
    return (0.5 * h * (D + d))

#  计算磁环平均长度l  cm
def calMagnetRingLength(D, d):
    return (0.5 * (D + d) * math.pi)

#  计算磁环绕线电感的电感L  mH
def calInductance(u, N, F, l):
    return 0

#  计算线圈匝数N
def calRingNumber(u, L, F, l):
    return math.sqrt((L * l * math.pow(10,5))/(0.4 * math.pi * u * F))
    
u = 75    
D = 3.3
d = 1.99
h = 1.07
L = 50.0
F = calMagnetRingCrossArea(D,d,h)
l = calMagnetRingLength(D,d)
N = calRingNumber(u,L,F,l)
print(N)

Parallel node support

At the moment we can only support one flow out. Is there any plans to include parallel node type or even limited support? I am trying to draw something very simple but found it hard without the parallel node:

mtdzyl

At the moment, I can only do something like the below which is not ideal : (
Screenshot 2022-02-15 at 01 58 22

Nodes: white spaces and shpes

Hi all,
I am using version 0.3.1 of pyflowchart and got two problems when creating my own flow chart.

First, I would like to change the shapes of the node. I searched around the source files and could spot the codes for changing the fill colours, font size etc and not the shapes of node. May I know where is this line?

Second, when creating my flowcharts, the white spaces in the text of each node become new lines. For example, when I have some node like :
st3=>start: start my function
The text in the output svg or png image will becomes:

start
my
function

I tried to search for some encoding issue when in the block of creating svg image, but failed. May I know how to solve it ?

I would be grateful if any expert could offer me with some advice. Thanks

Kenny

TODO Items

It would be very handy indeed if there was a simple CLI for code->svg.

Flowchart.js is javascript (obviously), so how would you feel if I made a pull request that installed npm, and the npm 'diagrams' package? From there, it's really just a simple CLI interface once those 2 things are installed.

aa

st3=>start: start foo
io5=>inputoutput: input: a, b
cond9=>condition: if a
sub13=>subroutine: print('a')
io34=>inputoutput: output: (a + b)
e32=>end: end function return
cond18=>operation: print('b') while i in range(3)

st3->io5
io5->cond9
cond9(yes)->sub13
sub13->io34
io34->e32
cond9(no)->cond18
cond18->io34

Support for match-case statement: AttributeError: 'Unparser' object has no attribute '_Match'

As pyflowchart 0.3.1 used with python 3.11 and astunparse 1.6.3 throws an exception:
Traceback (most recent call last): File "/usr/lib/python3.10/runpy.py", line 196, in _run_module_as_main return _run_code(code, main_globals, None, File "/usr/lib/python3.10/runpy.py", line 86, in _run_code exec(code, run_globals) File "/home/bjorn/.local/lib/python3.10/site-packages/pyflowchart/__main__.py", line 115, in <module> main(args.code_file, args.field, args.inner, args.output, args.no_simplify, args.conds_align) File "/home/bjorn/.local/lib/python3.10/site-packages/pyflowchart/__main__.py", line 85, in main flowchart = Flowchart.from_code(code, File "/home/bjorn/.local/lib/python3.10/site-packages/pyflowchart/flowchart.py", line 102, in from_code p = parse(f, simplify=simplify, conds_align=conds_align) File "/home/bjorn/.local/lib/python3.10/site-packages/pyflowchart/ast_node.py", line 659, in parse node = ast_node_class(ast_object, **kwargs) File "/home/bjorn/.local/lib/python3.10/site-packages/pyflowchart/ast_node.py", line 137, in __init__ self.body_head, self.body_tails = self.parse_func_body(**kwargs) File "/home/bjorn/.local/lib/python3.10/site-packages/pyflowchart/ast_node.py", line 158, in parse_func_body p = parse(self.ast_object.body, **kwargs) File "/home/bjorn/.local/lib/python3.10/site-packages/pyflowchart/ast_node.py", line 659, in parse node = ast_node_class(ast_object, **kwargs) File "/home/bjorn/.local/lib/python3.10/site-packages/pyflowchart/ast_node.py", line 463, in __init__ OperationNode.__init__(self, operation=self.ast_to_source()) File "/home/bjorn/.local/lib/python3.10/site-packages/pyflowchart/ast_node.py", line 33, in ast_to_source return astunparse.unparse(self.ast_object).strip() File "/home/bjorn/.local/lib/python3.10/site-packages/astunparse/__init__.py", line 13, in unparse Unparser(tree, file=v) File "/home/bjorn/.local/lib/python3.10/site-packages/astunparse/unparser.py", line 38, in __init__ self.dispatch(tree) File "/home/bjorn/.local/lib/python3.10/site-packages/astunparse/unparser.py", line 65, in dispatch meth = getattr(self, "_"+tree.__class__.__name__) AttributeError: 'Unparser' object has no attribute '_Match'

I looked into a solution. It now seems that replacing astunparse with the inbuild package ast package (see e.g. simonpercivall/astunparse#56 (comment)) doesnt throw this and works atm.

ConditionNode alignment support

Thank you a lot for the package. It is really useful for one of my use cases in work :D

As raised in this issue, adrai/flowchart.js#221, it would be great to allow the align-text option set for the condition node. It should be something easy to do to set a positional argument in the constructor for the ConditionNode(name, isAlign=True).

Can this be added quickly? If not, we can maybe do a PR if you point out the caveats :D

Thought it we need to modify these two definitions?

class ConditionNode(Node):
def fc_definition(self) -> str:

for loop rendered as an operation not a loop

One of the things I noticed in your demo is that a for loop is rendered as a while in an operation block whereas a while is rendered (more usefully) in looped decision. Is there any way of rendering the for loop as a looped decision without manually converting the code to explicitly use a while?

Please add `scroll to zoom` functionality if possible.

for smaller code it is OK to view the flowchart in a small image but for large python file we need to have some library like bokeh to plot the graph so that the content is scroll to zoom and all the nodes are dragable.

Recommend Projects

  • React photo React

    A declarative, efficient, and flexible JavaScript library for building user interfaces.

  • Vue.js photo Vue.js

    🖖 Vue.js is a progressive, incrementally-adoptable JavaScript framework for building UI on the web.

  • Typescript photo Typescript

    TypeScript is a superset of JavaScript that compiles to clean JavaScript output.

  • TensorFlow photo TensorFlow

    An Open Source Machine Learning Framework for Everyone

  • Django photo Django

    The Web framework for perfectionists with deadlines.

  • D3 photo D3

    Bring data to life with SVG, Canvas and HTML. 📊📈🎉

Recommend Topics

  • javascript

    JavaScript (JS) is a lightweight interpreted programming language with first-class functions.

  • web

    Some thing interesting about web. New door for the world.

  • server

    A server is a program made to process requests and deliver data to clients.

  • Machine learning

    Machine learning is a way of modeling and interpreting data that allows a piece of software to respond intelligently.

  • Game

    Some thing interesting about game, make everyone happy.

Recommend Org

  • Facebook photo Facebook

    We are working to build community through open source technology. NB: members must have two-factor auth.

  • Microsoft photo Microsoft

    Open source projects and samples from Microsoft.

  • Google photo Google

    Google ❤️ Open Source for everyone.

  • D3 photo D3

    Data-Driven Documents codes.