
Yet Another Python Profiler, but this time support Multithread/CPU time profiling.


CPython standard distribution comes with three profilers. cProfile, Profile and hotshot.
cProfile is implemented as a C module based on lsprof, Profile is in pure Python and
hotshot can be seen as a small subset of a cProfile.
The major issue is that all of these profilers lack support for multi-threaded programs and CPU time.
If you want to profile a multi-threaded application, you must give an entry point to these profilers and then maybe merge the outputs. None of these profilers are designed to work on long-running multi-threaded application.It is impossible to profile an application retrieve the statistics then stop and then start later on the fly (without affecting the profiled application).
- Per-thread function stats can be obtained
- Profiler can be started/stopped at any time from any thread in the application.
- Profile statistics can be obtained from any thread at any time.
- Profile statistics can show actual CPU Time used instead of Wall time.
- "Profiler pollution" (effect on the application run-time) is very minimal.
Can be installed via PyPI
$ pip install yappi
OR from the source directly.
$ pip install git+https://github.com/sumerc/yappi#egg=yappi
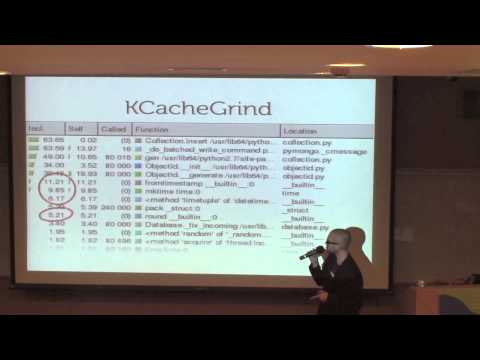
- Profiler results can be saved in callgrind or pstat formats. (new in 0.82)
- Profiler results can be merged from different sessions on-the-fly. (new in 0.82)
- Profiler results can be easily converted to pstats. (new in 0.82)
- Profiling of multithreaded Python applications transparently.
- Supports profiling per-thread CPU time (new in 0.62)
- Profiler can be started from any thread at any time.
- Ability to get statistics at any time without even stopping the profiler.
- Various flags to arrange/sort profiler results.
- Supports Python >= 2.7.x
- Threads must be derived from "threading" module's Thread object.
-
Python Performance Profiling: The Guts And The Glory
Yappi is the default profiler in PyCharm. If you have Yappi installed, PyCharm will use it. See the official documentation for more details.


