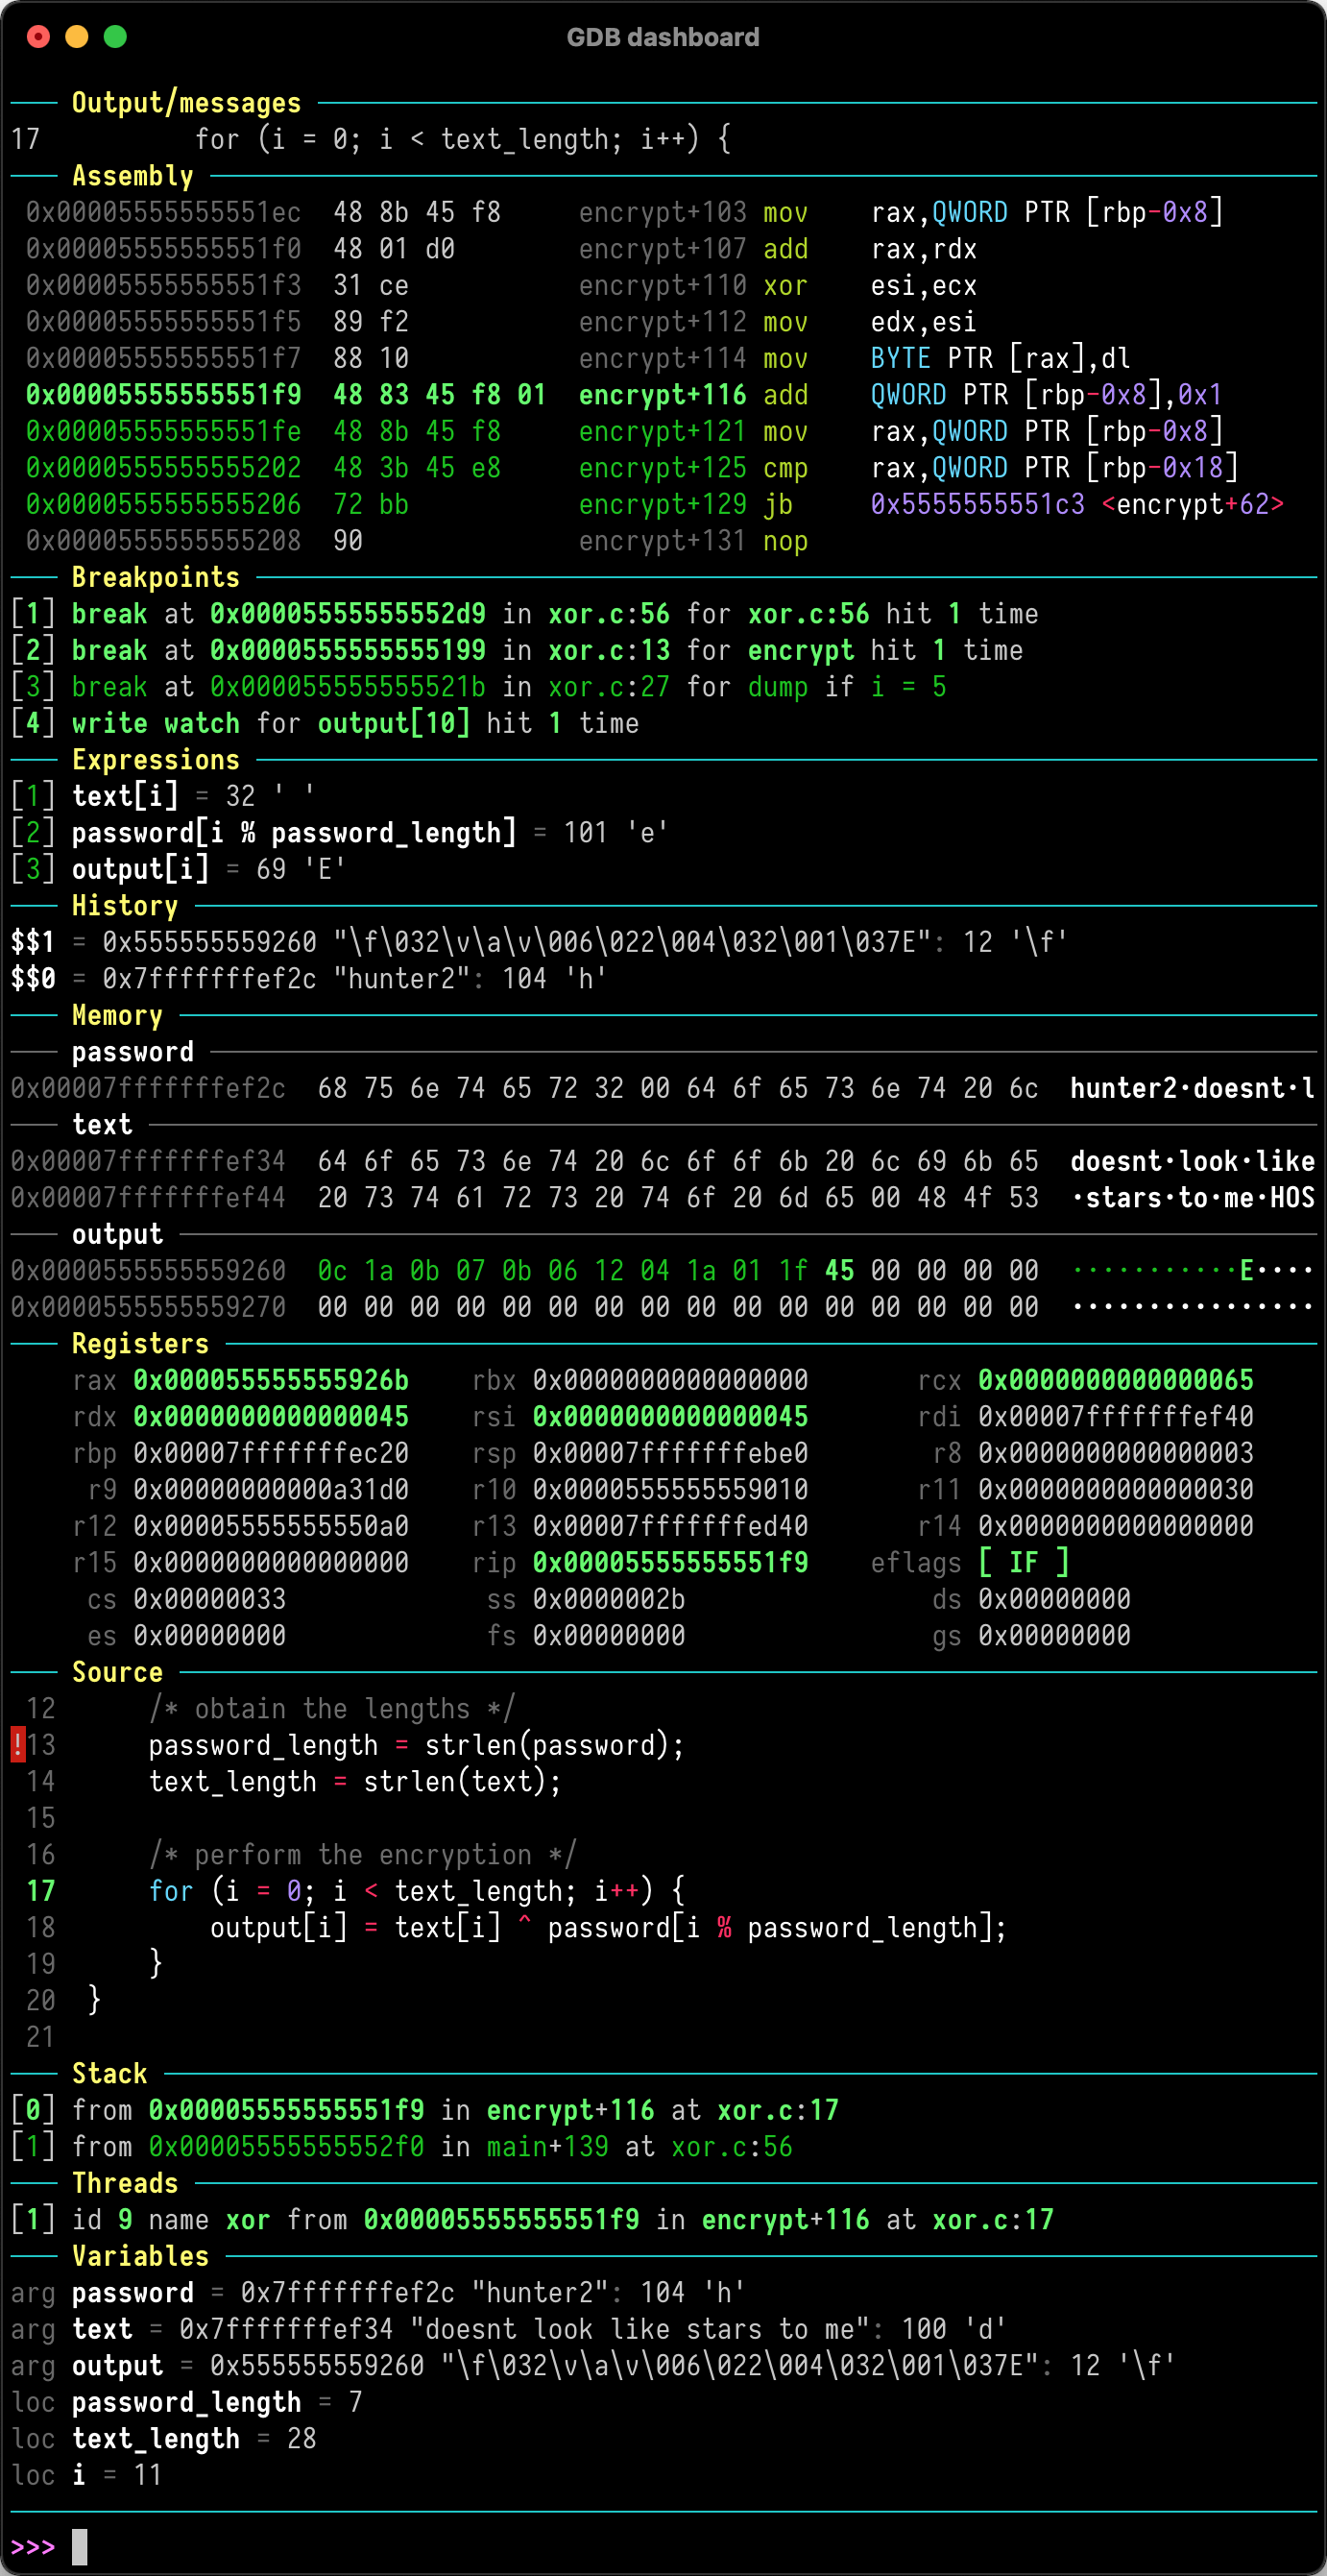
GDB dashboard is a standalone .gdbinit file written using the Python API that enables a modular interface showing relevant information about the program being debugged. Its main goal is to reduce the number of GDB commands needed to inspect the status of current program thus allowing the developer to primarily focus on the control flow.
Just place .gdbinit in your home directory, for example with:
wget -P ~ git.io/.gdbinit
Optionally install Pygments to enable syntax highlighting:
pip install pygments
Then debug as usual, the dashboard will appear automatically when the inferior program stops. Keep in mind that no GDB command has been redefined, instead all the features are available via the main dashboard command (see help dashboard).
The wiki also can be useful as it contains some common use cases.
GDB dashboard requires at least GDB 7.7 compiled with Python 2.7 in order to work properly, see #1 for more details and possible workarounds. To find the Python version used by GDB run:
gdb --batch -ex 'python import sys; print(sys.version)'
Make sure that the system locale is configured to use UTF-8, in most cases it already is, otherwise (in case of UnicodeEncodeError errors) a simple solution is to export the following environment variable:
export LC_CTYPE=C.UTF-8
On Windows the windows-curses Python package is needed in order to obtain the correct terminal size.
GDB dashboard is not meant to work seamlessly with additional front ends, e.g., TUI, Nemiver, QtCreator, etc. either instruct the front end to not load the .gdbinit file or load the dashboard manually.
Follows the list of bundled default modules, refer to the GDB help system for the full syntax.
assembly shows the disassembled code surrounding the program counter. The instructions constituting the current statement are marked, if available.
history lists the last entries of the GDB value history.
memory allows to inspect memory regions.
registers shows the CPU registers and their values.
source show the program source code, if available.
stack shows the current stack trace including the function name and the file location, if available. Optionally lists the frame arguments and locals too.
threads lists the currently available threads.
variables shows arguments and locals of the selected frame.
expressions watches user expressions.
breakpoints displays the breakpoints list.
The GDB documentation is available at help dashboard. Just like any GDB command, abbreviations are possible, so da, dash, etc. all resolve to dashboard.
This is the root command and it is used to manually redisplay the dashboard.
Display and optionally write to <file> the current configuration (layout, styles, outputs). This command allows to configure the dashboard live then make the changes permanent, for example:
dashboard -configuration ~/.gdbinit.d/auto
By default the dashboard is displayed in the GDB terminal together with the prompt and the program I/O but it may be convenient to display the whole dashboard or individual modules to other terminals.
This command allows to specify the destination terminal for both the dashboard and the modules, in such a way that when the output of a module is not specified then the dashboard output is used. To restore the original value run the command omitting the file.
To identify the TTY file name associated with terminal use the tty system command, those entries are often in the format /dev/pts/<n>.
The dashboard -layout command can be used to display a summary of the active modules and their outputs.
If <file> is not a valid terminal then the size of the GDB terminal is used to render the modules.
Enable or disable the automatic display of the dashboard whenever the target program stops. The dashboard is enabled by default and even when it is disabled, it can be manually displayed with dashboard.
By default, all the modules are enabled and placed within the dashboard in alphabetical order. As the number of modules grows, it is important to decide which modules will be part of the dashboard, and where.
Each directive is in the form [!]<module>, when the ! is present then the corresponding module is disabled by default. The order of directives denotes the display order within the dashboard. For example:
dashboard -layout source !assembly stack
Modules which do not appear in the list are disabled and placed after the last element in alphabetical order.
When executed without arguments, this command lists all the available modules in the form of a list of directives followed by the status of the output files of the modules.
Access to the stylable attributes of the dashboard, see Stylable attributes. For example, to change the prompt to something more familiar:
dashboard -style prompt '(gdb)'
The argument is parsed as a Python literal and converted to the proper type.
When only the name is specified this command shows the current value, whereas without arguments prints all the attributes.
Every module adds its own subcommand dashboard <module> which is used to toggle the enable flag and to redisplay the dashboard.
Modules may also declare additional subcommands, see help dashboard <module> from GDB.
There are two additional predefined subcommands: -style and -output.
If a module declares some stylable attributes then the command dashboard <module> -style will be available. Its semantics is equivalent to the dashboard -style command but it does apply to a module.
The dashboard <module> -output mimics the dashboard -output command but allows a finer grain of operation by working for a single module.
Files in ~/.gdbinit.d/ are executed in alphabetical order, but the preference is given to Python files. If there are subdirectories, they are walked recursively. The idea is to keep separated the custom modules definition from the configuration itself.
By convention, the main configuration file should be placed in ~/.gdbinit.d/ (say ~/.gdbinit.d/init) and can be used to tune the dashboard styles and modules configuration but also the usual GDB parameters.
There is number of attributes that can be used to customize the aspect of the dashboard and of its modules. They are documented within the GDB help system. For what concerns the dashboard itself it can be reached with:
help dashboard -style
Whereas for modules:
help dashboard <module> -style
Colors and text styles are specified using ANSI escape codes. For example setting a style to 1;31 will produce ^[[1;31m, which will result in displaying the text red (31) and bright (1). The ANSI output can be disabled by setting the ansi attribute to False (note that this will not affect the command prompt).
When the ansi attribute is set to True the Pygments Python library may be used by modules to provide syntax highlighting of the source code.
The syntax_highlighting stylable attribute is a string which defines the Pygments style to use.
A divider is basically a terminal-wide horizontal line with an optional label. Primary dividers are those used to separate the modules, whereas secondary dividers may be used inside modules to logically separate different sections. When a section or module is empty then the styles used for the divider are those with the off qualifier.
These are general purpose ANSI styles defined for convenience and used by default modules:
style_selected_1;style_selected_2;style_low;style_high;style_error;style_critical.
Custom modules must inherit the Dashboard.Module class and define some methods:
-
labelreturns the module label which will appear in the divider; -
linesreturn a list of strings which will form the module content, when a module is temporarily unable to produce its content, it should return an empty list; its divider will then use the styles with theoffqualifier.
The name of a module is automatically obtained by the class name.
Modules are instantiated once at initialization time and kept during the whole the GDB session.
Optionally, a module may include a description which will appear in the GDB help system by specifying a Python docstring for the class.
Optionally, a module may define stylable attributes by defining the attributes method returning a dictionary in which the key is the attribute name and the value is another dictionary:
-
defaultis the initial value for this attribute; -
docis the optional documentation of this attribute which will appear in the GDB help system; -
nameis the name of the attribute of the Python object, defaults to the key value; -
typeis the type of this attribute defaulting to thestrtype, it is used to coerce the value passed as an argument to the proper type, or raise an exception; -
checkis an optional control callback which accept the coerced value and returnsTrueif the value satisfies the constraint andFalseotherwise.
Optionally, a module may declare subcommands by defining the commands method returning a dictionary in which the key is the command name and the value is another dictionary:
-
actionis the callback to be executed which accepts the raw input string from the GDB prompt, exceptions will be shown automatically to the user; -
docis the command documentation; -
completionis the optional completion policy, one of thegdb.COMPLETE_*constants defined in the reference manual.
A number of auxiliary common functions are defined in the global scope, they can be found in the provided .gdbinit and concern topics like ANSI output, divider formatting, conversion callbacks, etc. They should be more or less self-documented, some usage examples can be found within the bundled default modules.
Default modules already provide a good example, but here is a simple module which may be used as a template for new custom modules, it allows the programmer to note down some snippets of text during the debugging session.
class Notes(Dashboard.Module):
    """Simple user-defined notes."""

    def __init__(self):
        self.notes = []

    def label(self):
        return 'Notes'

    def lines(self, term_width, term_height, style_changed):
        out = []
        for note in self.notes:
            out.append(note)
            if self.divider:
                out.append(divider())
        return out[:-1] if self.divider else out

    def add(self, arg):
        if arg:
            self.notes.append(arg)
        else:
            raise Exception('Cannot add an empty note')

    def clear(self, arg):
        self.notes = []

    def commands(self):
        return {
            'add': {
                'action': self.add,
                'doc': 'Add a note.'
            },
            'clear': {
                'action': self.clear,
                'doc': 'Remove all the notes.'
            }
        }

    def attributes(self):
        return {
            'divider': {
                'doc': 'Divider visibility flag.',
                'default': True,
                'type': bool
            }
        }
To use the above just save it in a Python file, say notes.py, inside ~/.gdbinit.d/, the following commands (together with the help) will be available:
dashboard notes
dashboard notes add
dashboard notes clear
dashboard notes -style


