Coder Social home page Coder Social logo

apple / ml-hierarchical-confusion-matrix Goto Github PK

View Code? Open in Web Editor NEW
294.0 16.0 28.0 2.12 MB

Neo: Hierarchical Confusion Matrix Visualization (CHI 2022)

Home Page: https://apple.github.io/ml-hierarchical-confusion-matrix/

License: Other

JavaScript 0.89% CSS 0.39% HTML 0.20% TypeScript 83.55% Svelte 14.97%
confusion-matrix data-visualization machine-learning visual-analytics

ml-hierarchical-confusion-matrix's Introduction

Neo: Hierarchical Confusion Matrix

npm version

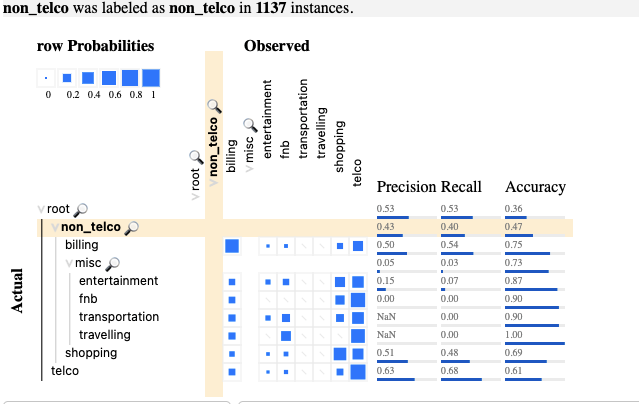
The confusion matrix, a ubiquitous visualization for helping people evaluate machine learning models, is a tabular layout that compares predicted class labels against actual class labels over all data instances. Neo is a visual analytics system that enables practitioners to flexibly author and interact with hierarchical and multi-output confusion matrices, visualize derived metrics, renormalize confusions, and share matrix specifications.

This code accompanies the research paper:

Neo: Generalizing Confusion Matrix Visualization to Hierarchical and Multi-Output Labels
Jochen Görtler, Fred Hohman, Dominik Moritz, Kanit Wongsuphasawat, Donghao Ren, Rahul Nair, Marc Kirchner, Kayur Patel
ACM Conference on Human Factors in Computing Systems (CHI), 2022.
image Paper, image Live demo, image Video, image Video Preview, image Code

Documentation

You can embed our confusion matrix visualization into your own project. There are two ways to use it.

NPM

Install with npm install --save @apple/hierarchical-confusion-matrix or yarn add @apple/hierarchical-confusion-matrix.

Then you can import the module in your project

import confMat from '@apple/hierarchical-confusion-matrix';

const spec = {
    classes: ['root'],
};

const confusions = [
    {
        actual: ['root:a'],
        observed: ['root:a'],
        count: 1,
    },
    {
        actual: ['root:a'],
        observed: ['root:b'],
        count: 2,
    },
    {
        actual: ['root:b'],
        observed: ['root:a'],
        count: 3,
    },
    {
        actual: ['root:b'],
        observed: ['root:b'],
        count: 4,
    },
];

confMat.embed('matContainer', spec, confusions);

Embed the Compiled File

If you prefer to load the compiled JavaScript directly, you have to compile it. To do this, run yarn install and copy the public/confMat.js into your project. Here is a simple example of a small confusion matrix:

<!DOCTYPE html>
<html>
    <head>
        <meta charset="utf8" />
        <meta name="viewport" content="width=device-width" />
        <title>Neo: Hierarchical Confusion Matrix</title>
    </head>

    <body>
        <div id="matContainer"></div>
        <script src="confMat.js"></script>
        <script>
            const spec = {
                classes: ['root'],
            };

            const confusions = [
                {
                    actual: ['root:a'],
                    observed: ['root:a'],
                    count: 1,
                },
                {
                    actual: ['root:a'],
                    observed: ['root:b'],
                    count: 2,
                },
                {
                    actual: ['root:b'],
                    observed: ['root:a'],
                    count: 3,
                },
                {
                    actual: ['root:b'],
                    observed: ['root:b'],
                    count: 4,
                },
            ];

            confMat.embed('matContainer', spec, confusions);
        </script>
    </body>
</html>

Specification

You can find all the options that you can pass via the spec argument in src/specification.ts.

Loaders

The different loaders can be found in src/loaders, which include loading data from json, csv, vega, and a synthetic example synth for testing.

Confusion Data Format Examples

Example 1: Conventional Confusions

The confusions for data with actual labels of fruit:lemon that are incorrectly predicted as fruit:apple, of which there are count 1 of them.

{
    "actual": ["fruit:lemon"],
    "observed": ["fruit:apple"],
    "count": 1
}

Example 2: Hierarchical Confusions

The confusions for hierarchical data with actual labels of fruit:citrus:lemon that are incorrectly predicted as fruit:pome:apple, of which there are count 2 of them. Note : denotes hierarchies.

{
    "actual": ["fruit:citrus:lemon"],
    "observed": ["fruit:pome:apple"],
    "count": 2
}

Example 3: Multi-output Confusions

The confusions for multi-output data with actual labels of fruit:lemon,taste:sweet that are incorrectly predicted as fruit:apple,taste:sour, of which there are count 3 of them. Note , denotes multi-ouput labels.

{
    "actual": ["fruit:lemon", "taste:sweet"],
    "observed": ["fruit:apple", "taste:sour"],
    "count": 3
}

Example 4: Hierarchical and Multi-output Confusions

The confusions for hierarchical and multi-output data with actual labels of fruit:citrus:lemon,taste:sweet,ripeness:ripe that are incorrectly predicted as fruit:pome:apple,taste:sour,ripeness:not-ripe, of which there are count 4 of them.

{
    "actual": [
        "fruit:citrus:lemon",
        "taste:sweet",
        "ripeness:ripe"
    ],
    "observed": [
        "fruit:pome:apple",
        "taste:sour"
        "ripeness:not-ripe"
    ],
    "count": 4
}

See fruit.json for a complete example of confusions for a hierarchical fruit, taste, and ripeness classification model.

Development

Build:

yarn install
yarn build

Test:

yarn test:unit

Dev Server:

yarn dev

Lint & Fix:

yarn lint

Contributing

When making contributions, refer to the CONTRIBUTING guidelines and read the CODE OF CONDUCT.

BibTeX

To cite our paper, please use:

@inproceedings{goertler2022neo,
  title={Neo: Generalizing Confusion Matrix Visualization to Hierarchical and Multi-Output Labels},
  author={Görtler, Jochen and Hohman, Fred and Moritz, Dominik and Wongsuphasawat, Kanit and Ren, Donghao and Nair, Rahul and Kirchner, Marc and Patel, Kayur},
  booktitle={Proceedings of the SIGCHI Conference on Human Factors in Computing Systems},
  year={2022},
  organization={ACM},
  doi={10.1145/3491102.3501823}
}

License

This code is released under the LICENSE terms.

ml-hierarchical-confusion-matrix's People

Contributors

dependabot[bot] avatar domoritz avatar fredhohman avatar grtlr avatar

Stargazers

 avatar  avatar  avatar  avatar  avatar  avatar  avatar  avatar  avatar  avatar  avatar  avatar  avatar  avatar  avatar  avatar  avatar  avatar  avatar  avatar  avatar  avatar  avatar  avatar  avatar  avatar  avatar  avatar  avatar  avatar  avatar  avatar  avatar  avatar  avatar  avatar  avatar  avatar  avatar  avatar  avatar  avatar  avatar  avatar  avatar  avatar  avatar  avatar  avatar  avatar  avatar  avatar  avatar  avatar  avatar  avatar  avatar  avatar  avatar  avatar  avatar  avatar  avatar  avatar  avatar  avatar  avatar  avatar  avatar  avatar  avatar  avatar  avatar  avatar  avatar  avatar  avatar  avatar  avatar  avatar  avatar  avatar  avatar  avatar  avatar  avatar  avatar  avatar  avatar  avatar  avatar  avatar  avatar  avatar  avatar  avatar  avatar  avatar  avatar  avatar

Watchers

 avatar  avatar  avatar  avatar  avatar  avatar  avatar  avatar  avatar  avatar  avatar  avatar  avatar  avatar  avatar  avatar

ml-hierarchical-confusion-matrix's Issues

NPM version bump

Given the security issues with d3-color, and all of the dependabot version bumps, is it expected to have a new version of the package released on npm?

How to utilize this tool for python users?

I went through the paper and loved the idea. The roadblock is that I am a little unfamiliar with typescript. Let's say I have built a classification model (binary or multi-class or multi-label) and have the test versus prediction labels. I could create the JSON files using python but is there any documentation (examples) on how to use this library to get these beautiful visualizations?

Maybe some youtube tutorials will help a lot of programmers like me who are more familiar with Python and love to see new tools in other languages.

Can a tooltip be added as well when hovering on the cell ?

Hi,

I just started using this and it has a very cool visualization interface.
Would be great if you can add the following feature:

If the number of classes that are present overall is big (say 200-250), it becomes difficult to read the message that is displayed in the place of "Hover over cells to show more information." , as you have to scroll left and right continuously.
So, is it possible to also include a tooltip with the onhover of the matrix cells to easily show this information? Or somehow have the message dynamically centrally aligned so that the user does not have to go back and forth all the time on the screen?

Have added a screenshot that I am talking about.
Screenshot 2022-05-06 at 17 00 53

Thanks!

Nishant

Recommend Projects

  • React photo React

    A declarative, efficient, and flexible JavaScript library for building user interfaces.

  • Vue.js photo Vue.js

    🖖 Vue.js is a progressive, incrementally-adoptable JavaScript framework for building UI on the web.

  • Typescript photo Typescript

    TypeScript is a superset of JavaScript that compiles to clean JavaScript output.

  • TensorFlow photo TensorFlow

    An Open Source Machine Learning Framework for Everyone

  • Django photo Django

    The Web framework for perfectionists with deadlines.

  • D3 photo D3

    Bring data to life with SVG, Canvas and HTML. 📊📈🎉

Recommend Topics

  • javascript

    JavaScript (JS) is a lightweight interpreted programming language with first-class functions.

  • web

    Some thing interesting about web. New door for the world.

  • server

    A server is a program made to process requests and deliver data to clients.

  • Machine learning

    Machine learning is a way of modeling and interpreting data that allows a piece of software to respond intelligently.

  • Game

    Some thing interesting about game, make everyone happy.

Recommend Org

  • Facebook photo Facebook

    We are working to build community through open source technology. NB: members must have two-factor auth.

  • Microsoft photo Microsoft

    Open source projects and samples from Microsoft.

  • Google photo Google

    Google ❤️ Open Source for everyone.

  • D3 photo D3

    Data-Driven Documents codes.