The purpose of this analysis is to calculate vote totals overall and for candidates and counties, determine the largest share of county votes, and determine the winning candidate. This is done through a python script that counts the total amount of votes, determines the candidates and counties, counts the votes received for each, calculates the percent of votes per candidate and per county, then determines the largest county and winner of the election.
Image of results
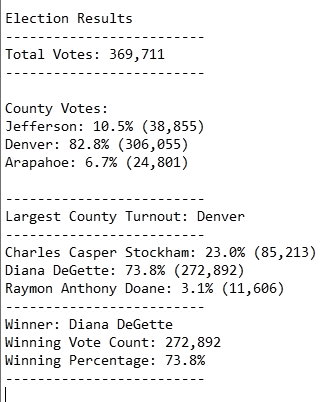
- How many votes were cast in this congressional election?
The total number of votes cast in the election is 369,711
- Provide a breakdown of the number of votes and the percentage of total votes for each county in the precinct.
The breakdown of county votes is as follows: - Jefferson: 10.5% (38,855) - Denver: 82.8% (306,055) - Arapahoe: 6.7% (24,801)
- Which county had the largest number of votes?
Denver County had the largest number of votes with 306,055
- Provide a breakdown of the number of votes and the percentage of the total votes each candidate received.
The breakdown of candidate votes is as follows: - Charles Casper Stockham: 23.0% (85,213) - Diana DeGette: 73.8% (272,892) - Raymon Anthony Doane: 3.1% (11,606)
- Which candidate won the election, what was their vote count, and what was their percentage of the total votes?
Diane Degette won the election with 272,892 votes and 73.8% of the total vote
This python script is created in a way that allows us to generalize its use to other elections, since it takes in the dataset and determines the candidates, counties, and vote counts from the dataset itself. However it may be a more helpful statistic in an audit to have the total county vote as a proportion of the county size. To do this we would need additional data on county size, as well as to amend the script to calculate the percent total of the county vote. This would be a more accurate representation of turnout. It may also be helpful to compare this with traditional turnout, which could also be added to the script to compare its increase or decrease from election year to election year.