Coder Social home page Coder Social logo

algenty / grafana-flowcharting Goto Github PK

View Code? Open in Web Editor NEW
942.0 39.0 143.0 233.62 MB

Flowcharting, plugin for Grafana to create complexe visio's draws style like technical architectures, floorplan, diagrams, hierarchical schema based on draw.io

License: Apache License 2.0

JavaScript 71.01% HTML 9.08% CSS 2.63% Shell 0.12% TypeScript 14.90% SCSS 2.27%
grafana flowchart diagram drawio mxgraph monitoring visio flowchart-diagrams grafana-plugin diagrams

grafana-flowcharting's People

Contributors

algenty avatar dependabot[bot] avatar dprokop avatar ryantxu avatar x70b1 avatar xkilian avatar

Stargazers

 avatar  avatar  avatar  avatar  avatar  avatar  avatar  avatar  avatar  avatar  avatar  avatar  avatar  avatar  avatar  avatar  avatar  avatar  avatar  avatar  avatar  avatar  avatar  avatar  avatar  avatar  avatar  avatar  avatar  avatar  avatar  avatar  avatar  avatar  avatar  avatar  avatar  avatar  avatar  avatar  avatar  avatar  avatar  avatar  avatar  avatar  avatar  avatar  avatar  avatar  avatar  avatar  avatar  avatar  avatar  avatar  avatar  avatar  avatar  avatar  avatar  avatar  avatar  avatar  avatar  avatar  avatar  avatar  avatar  avatar  avatar  avatar  avatar  avatar  avatar  avatar  avatar  avatar  avatar  avatar  avatar  avatar  avatar  avatar  avatar  avatar  avatar  avatar  avatar  avatar  avatar  avatar  avatar  avatar  avatar  avatar  avatar  avatar  avatar  avatar

Watchers

 avatar  avatar  avatar  avatar  avatar  avatar  avatar  avatar  avatar  avatar  avatar  avatar  avatar  avatar  avatar  avatar  avatar  avatar  avatar  avatar  avatar  avatar  avatar  avatar  avatar  avatar  avatar  avatar  avatar  avatar  avatar  avatar  avatar  avatar  avatar  avatar  avatar  avatar  avatar

grafana-flowcharting's Issues

Zoom, Scale Issues

I am working with a very large flow chart, 6000 down x 750 wide. When using the zoom feature it is cutting off part of the diagram when I display it. When I use the scale option is is extremely small even when I change the iFrame size to match the diagram it is still not filling the space and stays very tiny. This has made it very hard to view large flow charts. I have also changed the size of the page in the xml to match the large flow chart size, but still am not able to view whole chart correctly.

This is part of the xml:

object ID reference alternative

Dear Arnoud,
Thanks again for your great plugin. Currently the draw.io ID attribute is used to reference wxGraphModel objects. I learned the hard way that this can corrupt the drawing when I tried to swap the names of two objects.

As an alternative mapping approach, an additional attribute could be used on the object, e.g. "flowcharting_id", which could leave the original draw.io object references intact. This would give the following advantages:

  • you can already provide the names in draw.io, i.e. via Edit Data
  • when you copy the draw.io object, it will retain the same ID, so you can easily adjust it in draw.io and/or the FlowCharting plugin. Without changing the name I could expect it to have the same mapping behavior as the original object.
  • it would no longer be possible to corrupt the drawing by trying to swap object-ids
  • draw.io library objects can be created that already have an initial flowcharting_id.

With a highly structured diagram (i.e. with lots of groupings), it would become possible to automatically create the flowcharting_id when each element has a name or label attribute. I.e. in the DSP flow diagram below where a voltage and a current sensor together calculate power at 50Hz from 4KHz raw samples. E.g. the ID of the port pq_vec within ComplexPower within LV-Sensor VT, could then be automatically created as flow_charting_id = LV-Sensor VT/ComplexPower/pq_vec. I could envisage a "create object names from name attribute" button in the Inspect tab of the FlowCharting plugin. This could considerably speed up configuration of the mappings.

image

Kind regards,
Dennis

NEW 0.4.0 SNAPSHOT candidate for release : BETA USERS NEEDED

Hi Users and grafana team.
Since 4 months, i work on version 0.4.0.
I think this version is stable but before to pull for release, i need feedback and beta tester.
You can found it at
https://algenty.github.io/flowcharting-repository/ARCHIVES.html

Documentation at
https://algenty.github.io/flowcharting-repository/

What's news for this version :

[0.4.0 SNAPSHOT] - 2019-09-14

Added

  • Draw.io editor (Example)
    • Open draw.io with dark theme for better rendering
    • Display waiting screen when loading xml definition.
  • Upgrading libraries
    • mxGraph 4.0.4
    • draw.io 11.2.8
  • Graph definition
    • Adding download function to download source by http on load. (Example)
  • Metric
    • Adding string support for state
  • Zoom (issue #19) (Example)
    • On the mouse pointer : Ctrl + Mouse
    • Hold right button to move diagram.
    • double click on shape to zoom on.
    • Escape key to restore.
  • Tooltip/popup support (Example)
    • Grafana style css and date
    • Adding metrics with color according levels
    • Adding colors on metrics in tooltip
    • Adding date of change
    • Adding label input for metric
  • Variables/templates support, accept variable like ${} (Example)
    • In xml definition
    • In text mapping when type in sring for "Range to text" and "Value to text"
    • In link ovewrite
  • full shapes from draw.io included (Examples)
  • Some optimizations

Fixed

BR
Arnaud

Some of the shapes in draw.io not visualized well in grafana

why some of the shapes used in draw.io not visualized well on grafana using this plugin ..
for example cisco shapes shown as blue rectangular wile fortigate shapes showing well.

my grafana version is 5.3.2 and grafana-flowcharting plugin version is 0.3.0 .

thanks
Uploading Untitled.png…
Uploading Capture1.PNG…

as i continue invastigate , the issue seems to be related to the style of the shape .. but i;m not sure

Feature Request: Additional Thresholds (>3 colors)

#39

Hi algenty, thanks for making this Grafana Plugin. It is working to great affects. I do have a request, is it possible to add additional thresholds & colors. As of right now, the plugin is limited to 3 colors.

duration (s)

I'm on 0.3.0-SNAPSHOT & using a query metric that returns a value that can be used with time-duration(s) and a numerical threshold:

probe_ssl_earliest_cert_expiry{instance="<hostname>",job="<jobname>"}-time()

image

To use the numerical threshold the unit needs to be time/duration(s) but it's impossible to select it in the dropdown, it can however be changed in the json:

"unit": "dtdurations",

After that it works like a regular panel: changing color to red as the expiration date comes closer.

Thx!

Embedded zoom in/out buttons?

First of all, the plugin works great for me. I want to take to the next level to make large complex tree-like diagram. I am wondering if it is possible to have an embedded zoom in/out button? Essentially, I want to show a high-level view by default but when required, drill down to the lowest level. This would be similar to + and - available on maps (including the maps plugin in grafana). Any guidance is much appreciated. Thanks.

significant decimals for unit conversion

Dear Arnaud,

When using number of decimals combined with unit conversion the result does not always look useful to me and may take too much space e.g. when selecting Unit Watt (W) in version 0.4:

  • with 0 decimals -536.753 W is now converted to -536 W
  • with 0 decimals -1536.753 W is now converted to -2 kW
  • with 1 decimals -536.753 W is now converted to -536.8 W
  • with 1 decimals -1536.753 W is now converted to -1.5 kW
  • with 2 decimals -536.753 W is now converted to -1536.75 W
  • with 2 decimals -1536.753 W is now converted to -1.54 kW
  • with 3 decimals -536.753 W is now converted to -536.753 W
  • with 3 decimals -1536.753 W is now converted to -1.537 kW

I think it would be more useful to present the number of significant digits for the given unit. E.g. when digits==3, try to show 3 digits before + after the decimal point.

With different significant digits we would then get ( 0 digits would not make much sense):

  • with 0 digits -536.753 W converts to - kW
  • with 0 digits -1536.753 W converts to - kW
  • with 1 digits -536.753 W converts to -0.5 kW
  • with 1 digits -1536.753 W converts to -2 kW
  • with 2 digits -536.753 W converts to -0.54 kW
  • with 2 digits -1536.753 W converts to -1.5 kW
  • with 3 digits -536.753 W converts to -537 W
  • with 3 digits -1536.753 W converts to -1.54 kW

Kind regards,
Dennis

Getting XML By URL now working

Thank you so much for all the help so far! I have written a service to return the XML needed to display the graphic and am trying to test it out. I am facing a couple issues, 1) not sure if related to this plugin, but am seeing error "WARN : XML Content not defined undefined" in the chrome console. 2) it is as if nothing is happening on the screen, i can't see the request hit my service so not sure if its making it out of grafana. We are also not seeing any errors in the granfana logs. I have written the service to return of type "xml/plain" and is working fine in postman.

Feature Request: Support for Tooltips

Draw.io allows tooltips to be added to shapes. Would be helpful to have these display when I hover over in Grafana please?

If tooltips are included in the .XML at the moment it breaks the graphic as I have it updating a value by replacing the word VALUE in the Text Pattern box. Including the tooltip changes it to replace all content.

Guidance needed

Hi,

Thank you for writing this plugin, it looks very promising, but I'm not sure how to make it work.

I have tried to use a Graphite data source with a serie like:
alias(cumulative(xxx.stats_counts.processing.success), 'processingCount')

The output in a SingleStat panel works, I get a number.

Now, how am I supposed to say in the Flowcharting plugin that I want to have this value somewhere ?

Thank you

Alex

Word Wrap in object

I would like to know if there is a way to do word wrapping within an object. You can see in the picture the labeling on the box is very large, I would like it to wrap inside the box. Below is how I have defined the XML for that box

    <object label="VERIFY_SUPPCANCEL_TLS_REMOVE" id="101">
        <mxCell style="rounded=0;whiteSpace=wrap;html=1;fillColor=white;strokeColor=black;" parent="1" vertex="1">
            <mxGeometry x="60" y="0" width="120" height="60" as="geometry"/>
        </mxCell>
    </object>

image

Referencing metrics in text mappings

I'm trying to achieve the following:

I have a network map (quite like the examples in the animated gifs) which contain labels.
I have an influxdb query which does a 'GROUP BY' to gather data for all links in the network map in every direction. Aliases are set using the tags used. So I have a lot of metrics named 'IFDESC1-IN', 'IFDESC2-OUT' etc. In my draw.io map I changed the ID's on the labels to match these names. Now, I would like to replace those labels with the measurements in one go. I can use a regexp to match /./ in the "apply to metrics named" field, but when I leave "/./ in the "Text Mappings" field all labels get the same value.

I assume that in the "Text Mapping" fields I would like to reference the value in the "apply to metrics field. Is there any way to reference that field value, so that I can use one rule to set each value on the appropriate label?

Tooltips and URL Linking Don't Both Work at the Same Time

Version 0.4.0
If you take a component and add a URL Link click through things work fine.
If you take a second component and add tooltip text from the draw io editor it renders fine.
However if you take a 3rd component and add a URL click through link and a tooltip they both don't work. I was wondering if I am doing something wrong.
It seems to me I had to make a lower Z level component do the click through URL and place another component on top that is smaller for the tooltip.

What is the recommended way to have one component that supports URL click through and tooltips?

Coordinate and visibility mappings

Thanks for this great plugin, it is really powerful! I managed to draw an electrical diagram that shows actual voltage, current and power from my sensors with the 0.40 snapshot (see figure below),

It would become even more powerful when X and Y coordinate of lines/shapes/mxPoint could be mapped, so that you can e.g.:

  • change the endpoint (x and/or y) of a line in a circuit from open to closed, e.g. based on a threshold or variable
  • have bars that move/grow/shrink with your data, e.g. by changing coordinate of two corners, it could colored at the same time with color mapping
  • rotating arrow/analog clock hand/dial, when input data is in degrees or as complex number. For this you may need a divider and offset to keep coordinates within the diagram. Of course the arrow could also be colored according to the color mapping.
  • move shapes around

The circuit open/close could alternatively be accomplished when the visibility of a shape could be mapped. You could then draw one or more alternatives with draw.io and make one of them visible based on e.g. a threshold or variable.

Are these mapping features interesting enough to be added to the roadmap?

Kind regards,
Dennis

image

Feature Request: Use an internal drawio website

Hello,

I'm using an internal drawio website, with flowcharting 4.0 I switched some links in code to my internal domain, of course there are a lot of changes in 5.0 and I need to find and change the new entries

I think a global variable or a parameter for this could be helpful (at least for me :))

Thanks for your works !

Duplicate Panel

After duplicating a Flowcharting panel changes done on the duplicated panel are also saved in the source panel and after a refresh both panels appear the same.

Not an issue: Great job!

Hi, we've been using mermaid graph extensively but found your plugin when upgrading our Grafana environment, I installed the zip you posted as reply on another issue.
We're starting to move all our mermaid graphs to mxgraph / draw.io now ;)

You nailed it with the scaling, inline editor, link-picker and the overall functionality, really great job!

Thanks for sharing this!

Font Size problem

In draw.io i have these font size:
Selezione_005

after saving in graphana I have this:

Selezione_006

0 decimals for number is not remembered

I can successfully change the decimals for number type under Mapping. However, when I set it to 0 decimals, save and switch dashboard it is back to the default 2 decimals.

feature: map metric to draw.io placeholder

Hi Arnaud,
Would it be possible to map a map a metric to a draw.io placeholder?
This would enable displaying multiple metrics within one label like "%metric1%, %metric2%, %metric3%" on a draw.io object, and would make it easier to reuse these placeholders in different objects.
Kind regards,
Dennis

Feature Request: Support interactive changes with Shared Crosshair option enabled

It would be really great if FlowCharting would support the Shared Crosshair/Shared Tooltip options (from the Graph Tooltip setting in the Panel Options in the dashboard settings) and interactively change the numbers/formatting according to the crosshair position from another panel. This would give the option to easily scroll through history and display the state of the diagram at the selected time.

Here is a simple example dashboard of what I mean: At the top, there two graph panel which shows an ambient temperature and a mean temperature of three different sensors. The bottom diagram is a simple Flowcharting panel, showing the temperature values of the three sensors for the average. At the moment, flowchart only shows a single value according to the selected time. With this feature request, the values would change interactively (as shown in this GIF mockup):
InteractiveChangeCrosshair

Multiple FlowCharts On a Dashboard

When creating and saving multiple FlowCharts on a Dashboard, sometimes on the first time of saving, both Flowcharts show the same content. Valid in Version 0.3.0 and 0.4.0

To reproduce:

  1. Add a panel to a dashboard, configure it to be a Flowchart, open the draw io editor clean everything out, and add a component, give it some text like "Hello" and save. So far so good.
  2. Add a second panel to the same dashboard, configure it to be a Flowchart, open the draw io editor clean everything out, and add a component, give it some text like "World" and save.
  3. Sometimes when saving the second instance for the first time, both instances of the FlowCharting component will have one component and both say "World". So it looks like your serializer back to JSON has problems sometimes when saving back to find the proper instance of the FlowCharting component. So what I do to work around this is to copy the json XML config for the first instance to my clipboard or external editor, then create the second one. If the problem happens, then I paste the Json xml back into the dashboard json for the first instance and things work fine. After that, editing either one works fine for ever more. Interesting bug. :) Hope you fix this one. :)

Feature request: specify remote location for XML

Thanks for the great plugin! I have a feature request: instead of creating/editing the Draw.io XML I would like to use diagram we already have made and which are hosted on a server. This way we would not have to copy XMLs from our documentation archive to Grafana, and we would not risk that the documentation an dashboard run out of sync.

Rules not handling decimal value correctly

After importing an XML form draw.io, i wanted to setup uptime display with decimals to have the hours, minutes and seconds.
But when i setup the decimal to "2", the value display doesn't have any decimal :
image

image

If i setup a similar request in a another panel (SingleStat in this case) i got the correct value out of it with the decimals :

image

image

hyperlink text appears in white over flowchart

Hi Arnaud,
I created two links in my flowcharting diagram, one via draw.io on the logo icon, and one via a rule on the business building icon. Both are shown in white over the diagram, both when editing rules (first figure, below its icons) and also when in view mode (second figure, once on the right of logo icon, three times on the right&above building icon).

This started after using the inspector, I only seem to be able to get rid of it by re-loading the grafana web-page.

Kind regards,
Dennis
image
image

Issue while trying to color text

Hi Arnaud, first of all, thank you very much for the plugin ... it's great !!!

I'am encounting an issue when I try to colorize a value, It's works, but I have the background going white

In draw.io
image

In grafana
grafana2p

If you could figure out what's going on, it would be great

Many thanks again for you work

Pierre

Feature request: Variables inside the flowchart

Hi.

I would like to be able to use variables inside the flowchart.

I have a rather big multidatacenter infrastructure diagram in both production and staging environments. In Grafana i have an "environment" variable and it would make sense if url-names, servernames etc could change when I switch the environment variable.

Thank you.

Overwrite link is inactive

Hello,

I'm using 0.5.0_3_fix_bug_draw.io_editor branch, "Object as link" seems without any effect

"Object as link" is enabled
"Overwrite" is on Warning/Critical
Url box with a different url

When the state switch to critical the link still the same

Thanks

Image broken

I created a graphic with images in draw.io.
When I import them in graffite, the image is broken.
It is referencing /img/....png and does not exist on the server

no metrics tab or flowcharting menu

I am using Grafana 6.3.2 and flowcharting 0.4.0 on OSX using Chrome and Safari.
The FlowCharting menu bar does not show up and there is no metrics tab.
Am I doing something wrong?
Thanks,
Pat.

Screen Shot 2019-10-02 at 1 11 24 PM

draw.io - hyperlink open in the same window

A hyperlink in a draw.io diagram can link to other dashboard. However it always opens in a new window, rather than the same window. Any suggestions?

draw.io does hyperlinks which link to pages within the diagram. However the flowcharting plugin only appears to support one page.

diagram editor breaks hyperlinks

I'm testing the version mentioned in #7
One thing I noticed that changed since the previous version I used (which was installed with grafana-cli) is that hyperlinks on objects in the diagram don't work anymore.

For example:
<mxGraphModel dx="492" dy="577" grid="1" gridSize="10" guides="1" tooltips="1" connect="1" arrows="1" fold="1" page="0" pageScale="1" pageWidth="827" pageHeight="1169" math="0" shadow="0"> <root> <mxCell id="0"/> <mxCell id="1" parent="0"/> <UserObject label="" link="https://grafana.com" id="2"> <mxCell style="rounded=0;whiteSpace=wrap;html=1;" vertex="1" parent="1"> <mxGeometry x="120" y="40" width="120" height="50" as="geometry"/> </mxCell> </UserObject> </root> </mxGraphModel>

used to work in the old version, now the hyperlink isn't clickable anymore. Does the minify/compress function perhaps break this? Looking at the generated HTML, I don't see a hyperlink anymore in the SVG.

Number of query limitation

Hi ,

I'm using Grafana 6.2.5 with agenty-flowcharting-panel @ 0.4.0 , I have a limitation in number of query that i can create , every new request assign a letter between A and Z , after Z the system dont assign any letter.

Is it a known limitation or a bug ?

Thanks in advance

Big loading times when using many mapping rules

Valid for 0.3.0 version

Greetings,

We are trying to generate somewhat a dynamic dashboard when the whole JSON structure of the panel is generated dynamically.
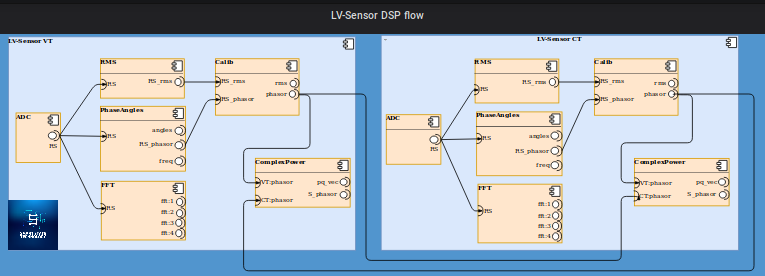
Think about a panel that displays ~350 nested square panels and each one should be assign with a metric and change the color according to the metric value.

The visual part works well. We are able to generate the xml part that draws squares.
The issue comes when we start linking squares with the metrics.

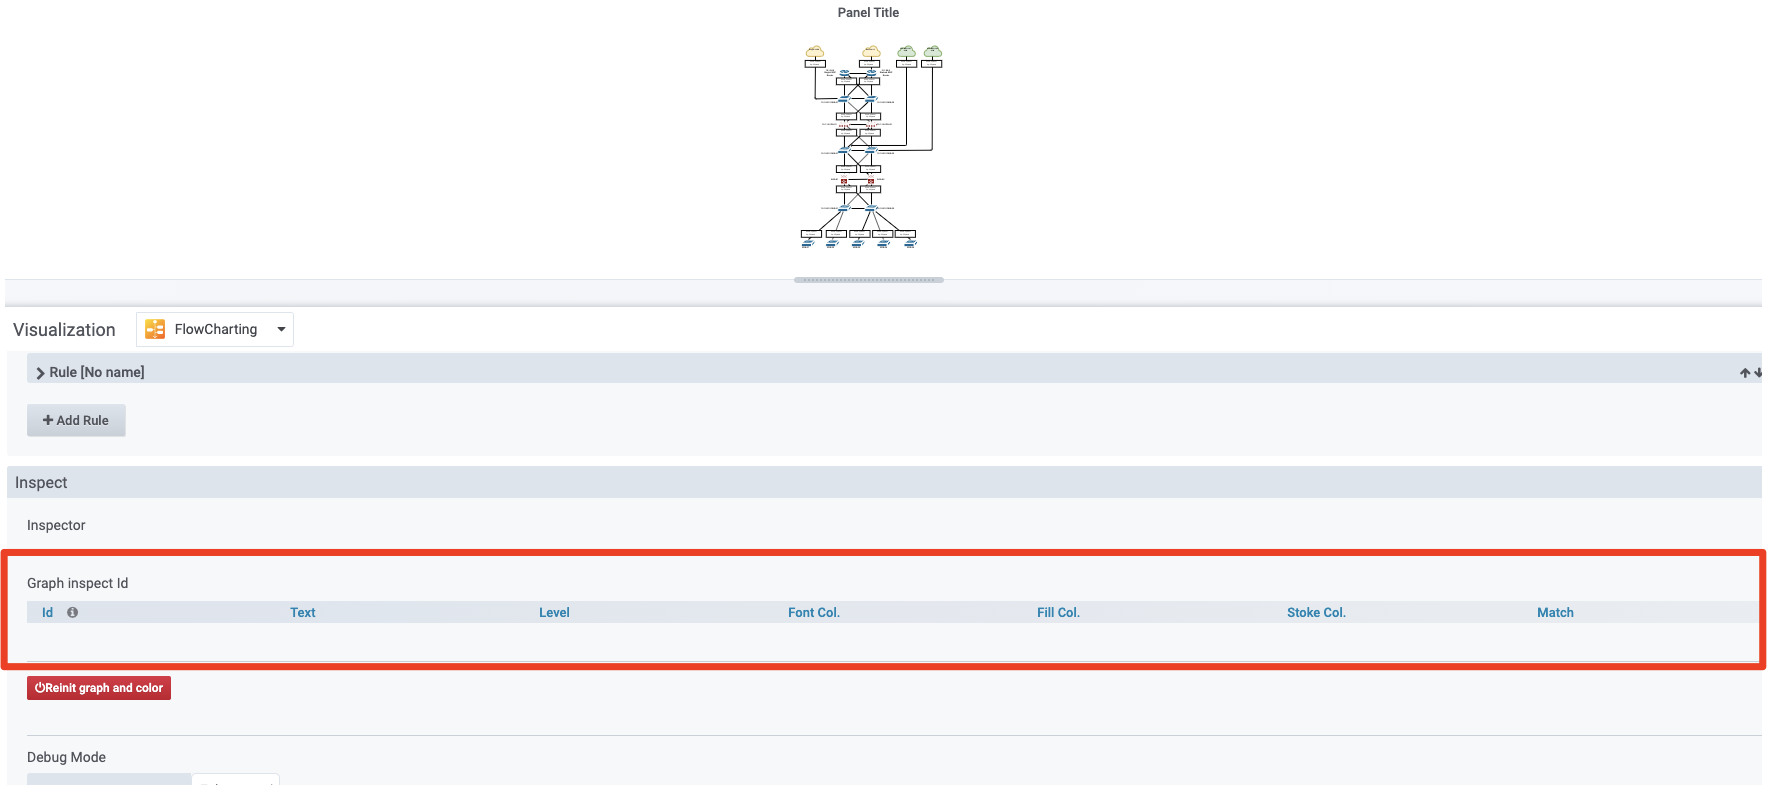
For each mxgraph object (square panel) we create a rule where we dynamically link a metric from Prometheus to the id of the mxgraph object.
In the end we have ~350 Mapping rules, as expected resulting in the JSON structure for ~16k lines.

Now if we try to load the page with Chrome the loading time might take ~5 minutes to refresh the panel.
In Firefox it takes ~ 40sec - 1minute.
During the loading time one of the CPU cores goes 100% loaded until the page is loaded completely.

Attaching performance recording from Chrome.

image

Attaching performance from Firefox
image

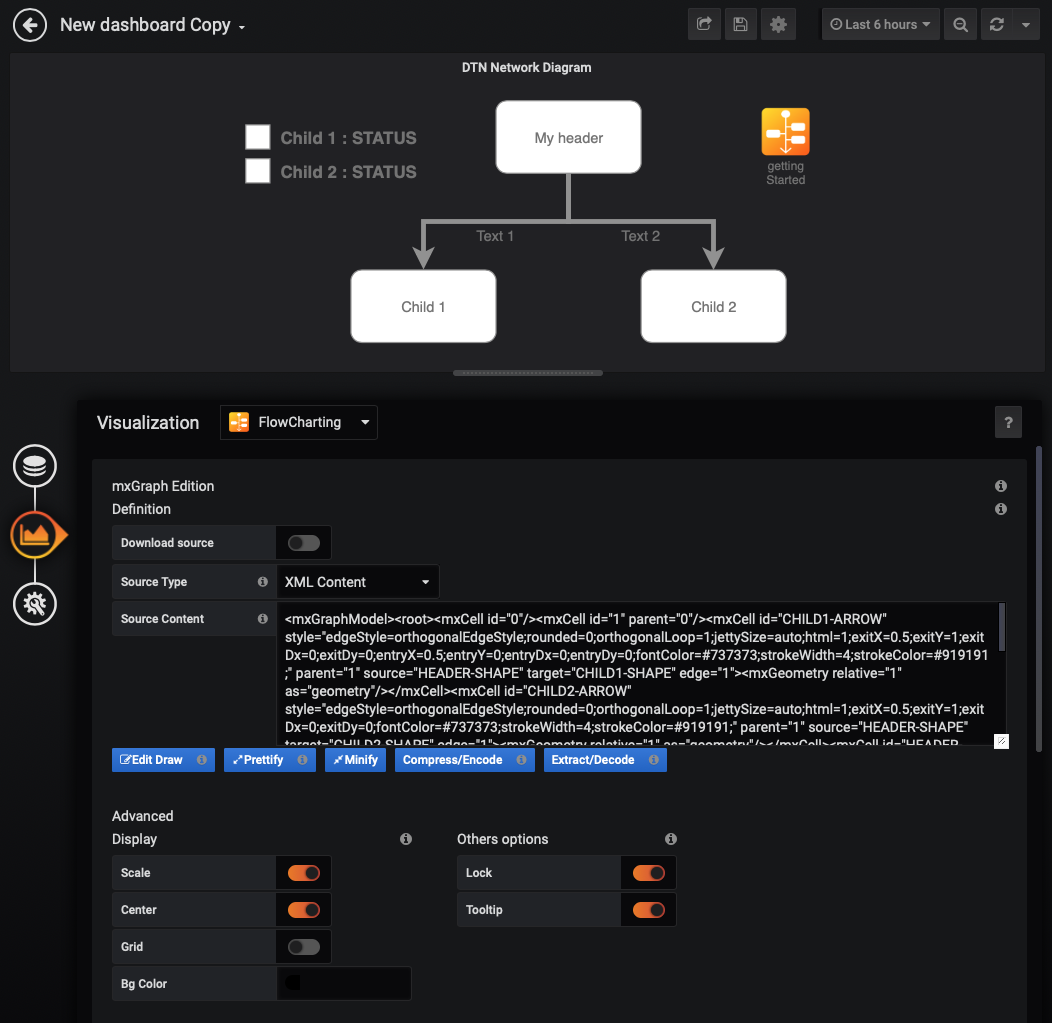
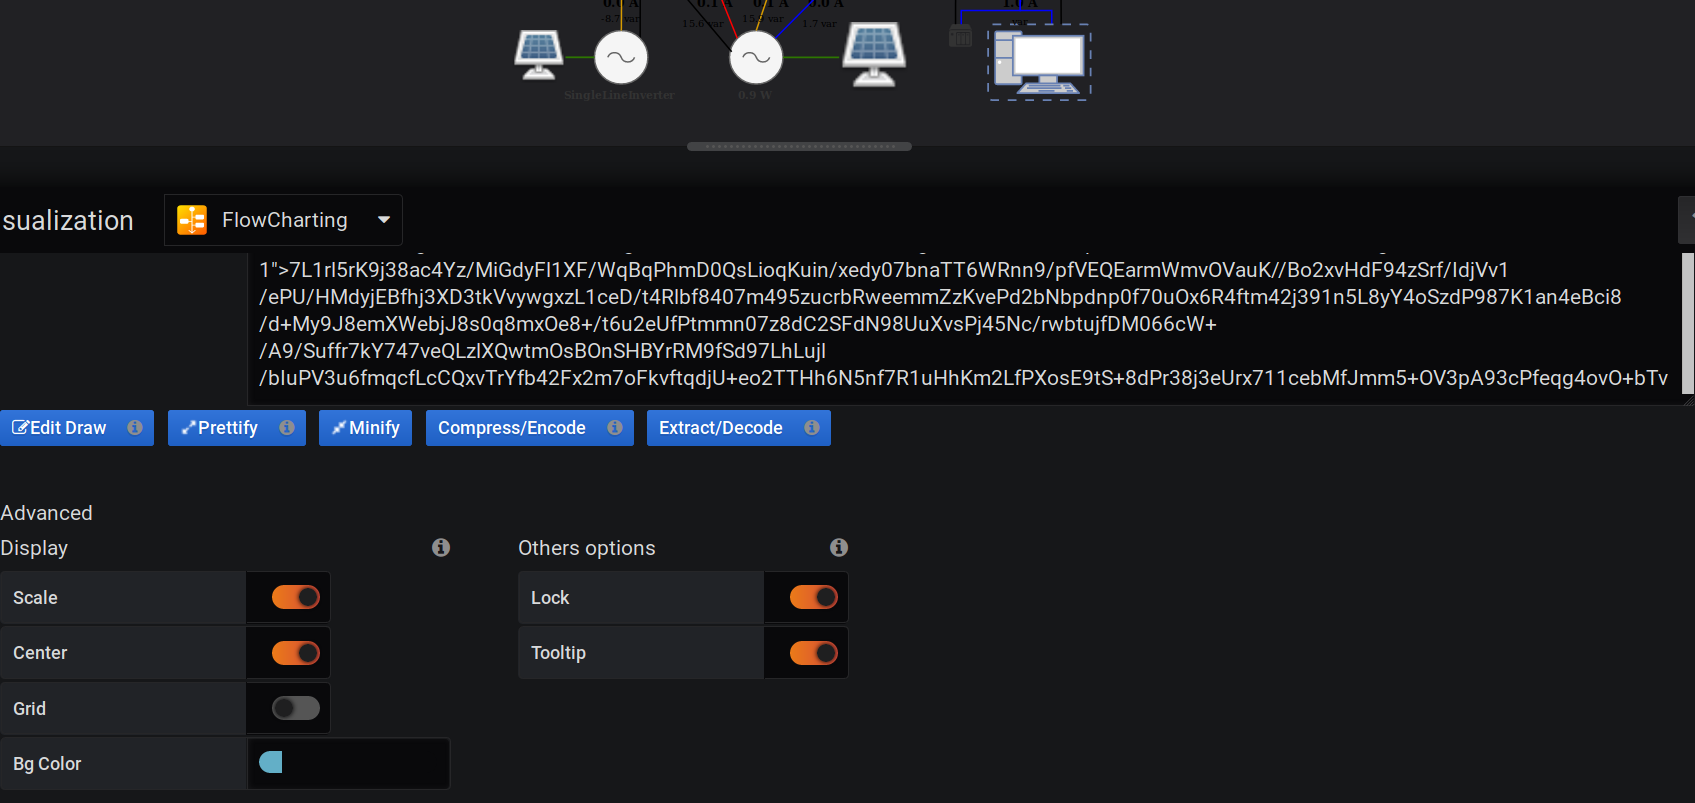
We tried to draw everything with draw.io with coloring the panels, but failed to import it dynamically. It seems that URL source for the XML part is still not working.

Could you, please, have a look in terms of optimizing loading speed with multiple items?

Thank you.

Mapping Tab

Hi,

can you give me short hint how the "Mapping" tab works? Or do you have an example? I see the screenshot but I don't understand how to use it ;-)

Thank you

Floor plan all black

I created a floor plan in draw.io but in the Grafana panel, it's all black. Also, doors don't appear. Here is the xml:

7ZpNc9sgEIZ/jY/NCBD6OLZukh7SmU5z6FmxscVEFh6MY6e/viCBbQkSuw2y8Ux18FgL+tpH7y4LGqHxYnvPi2X5nU1JNYLRdDtCX0cQpkkmf5XhtTXgBLeGOafT1gT2hkf6m+h+2rimU7Lq9BOMVYIuu8YJq2syEa0tam0F52yz6phmrOpedFnMiWV4nBSVbf1Fp6JsrRlM9/ZvhM5LfWUAkrxteSomz3PO1rW+3giiWbO1zYvCnEvf2aospmxzYEK3IzTmjIn232I7JpXyrPFae9zdG627++akFqccgGB7xEtRrYm55ebGxKtxRvM4RB0QjdCXTUkFeVwWE9W6kfClrRSLSu4B+XdGq2rMKsabY9Fds0n7SnD2TExLzWqiOrNaHHRuN2ln8vRUvOor2s+kH/OFcEG2Byb9jPeELYjgr7KLaY21v/XrCBO9v9nTxbm2lQdkk8i8VfqNmu/Ovfeq/KMd63YyPu5j9ShUvn8PxROpfrAVFZTVsumJCcEWXRebvp8rOld9BFMMCr03kV4iXHm8LJbq7IvtXEn0ZlYxxpdVUd9M5Z8HMhPqqNWy1c+MbhXiL5yJQl/7Ux5Z4CSlqNn8cEEmLOzCRG5xSYADC/w4FXDCq39WLJtCSYfXTbeejnZOn1IugbV3sWJr5SS3tnzQSbuqSTC2VeMQDcixBzxxYHjeU82gIomTuIMhxfGNDcIpE+SBQxIYByWTdwQylBgw7FOwUwhwicFDAglNCsFFKoC7kQojZMHZjbkO6aDUg0LSwPCcmN+HT+9xlnQTSJadlECwj/wR2qjrSNw6p1x28jCxLD4xlvkIZiAPDMzFEjs2cjDySLEjsaPMBhGDj3Mw4TAYDhdK7AnEPQq2GMyA1ndi391tSAyOZvbBwlLaqwYRsMNS7EKB8o+zuLJx7lkLwaRXCKLT8gXykcfRdXEZikEMuwxc9YdTGz5SdhYgg8uFqd7oyZUwcGKTgB6Sdmhi4Kw55bkRXHY+1zg9GApqBPuzfchzD2HzvAfCNTeFoU0Cxx5AhDYx8m+lxEFNDrKhwESO0tuFxcOESHDZgtbNIls/TOmVOceih48QhXplRWSHKNeMlJd8HVxpFwIBHCVnIxBcNfFuirAC0LCzgr1lpTizyzyMHKEp8cAltLnai61mwK42HKW2i4EXbYQ4M/tXyxk144PW2zHurjVBR4VhVh06FUbqocQAwc1JHUseHjwO0+5KhaugAGioZHF1AyYfESiCRz0+1LQrurrx0WCRpvdtQeaYVXJ9WeDltf+/EPQmhRO/7/AwvxrcgOgMsQf0RqCutx54+phD7u4/52zaDr6YRbd/AA==

background color to transparant after selecting variable

Hi Arnoud,
I just changed selection of a variable in the top of grafana (which is not changing any flowcharting metric), and now the flowcharting panel background went transparant. When I look at the background color in the flowcharting settings it is still set to my custom blue, see figure, but as seen in top of figure, the flowchart has transparent background (probably black because of my grafana layout style). When I reload the webpage in firefox, the color comes back. When I dive into the color setting, the right custom color is still selected

This is with the agenty-flowcharting-panel-0.4.0 from September, as well as the 0.40 release.

Kind regards,
Dennis
image

Rendering

Good morning

Thank you for this great plugins.

The attached shape render nice in draw.io but a bit different in this plugin.

shape.txt

Can you have a look please.

Thank you

Sylvain

Error "Editor is not defined"

I installed on Grafana 5.2.1 and used a simple graph from draw.io. A little bit is drawn, but then the error occurs: "Editor is not defined"

ReferenceError: Editor is not defined
    at mxConnector.paintLine (webpack://mxHandler/./src/Graph.js?:3359:17)
    at mxConnector.mxPolyline.paintEdgeShape (webpack://mxHandler/./node_modules/mxgraph/javascript/dist/build.js?:25608:8)
    at mxConnector.paintEdgeShape (webpack://mxHandler/./node_modules/mxgraph/javascript/dist/build.js?:28376:38)
    at mxConnector.mxShape.paint (webpack://mxHandler/./node_modules/mxgraph/javascript/dist/build.js?:24059:9)
    at mxConnector.mxShape.paint (webpack://mxHandler/./src/Shapes.js?:585:19)
    at mxConnector.mxShape.redrawShape (webpack://mxHandler/./node_modules/mxgraph/javascript/dist/build.js?:23648:8)
    at mxConnector.mxShape.redraw (webpack://mxHandler/./node_modules/mxgraph/javascript/dist/build.js?:23486:9)
    at mxCellRenderer.doRedrawShape (webpack://mxHandler/./node_modules/mxgraph/javascript/dist/build.js?:49703:14)
    at mxCellRenderer.redrawShape (webpack://mxHandler/./node_modules/mxgraph/javascript/dist/build.js?:49682:10)
    at mxCellRenderer.redraw (webpack://mxHandler/./node_modules/mxgraph/javascript/dist/build.js?:49596:26)

Have I misconfigured something?

Recommend Projects

  • React photo React

    A declarative, efficient, and flexible JavaScript library for building user interfaces.

  • Vue.js photo Vue.js

    🖖 Vue.js is a progressive, incrementally-adoptable JavaScript framework for building UI on the web.

  • Typescript photo Typescript

    TypeScript is a superset of JavaScript that compiles to clean JavaScript output.

  • TensorFlow photo TensorFlow

    An Open Source Machine Learning Framework for Everyone

  • Django photo Django

    The Web framework for perfectionists with deadlines.

  • D3 photo D3

    Bring data to life with SVG, Canvas and HTML. 📊📈🎉

Recommend Topics

  • javascript

    JavaScript (JS) is a lightweight interpreted programming language with first-class functions.

  • web

    Some thing interesting about web. New door for the world.

  • server

    A server is a program made to process requests and deliver data to clients.

  • Machine learning

    Machine learning is a way of modeling and interpreting data that allows a piece of software to respond intelligently.

  • Game

    Some thing interesting about game, make everyone happy.

Recommend Org

  • Facebook photo Facebook

    We are working to build community through open source technology. NB: members must have two-factor auth.

  • Microsoft photo Microsoft

    Open source projects and samples from Microsoft.

  • Google photo Google

    Google ❤️ Open Source for everyone.

  • D3 photo D3

    Data-Driven Documents codes.