- Aditya Sankar [email protected]
- Brian Burg [email protected]
- Alex Burner [email protected]
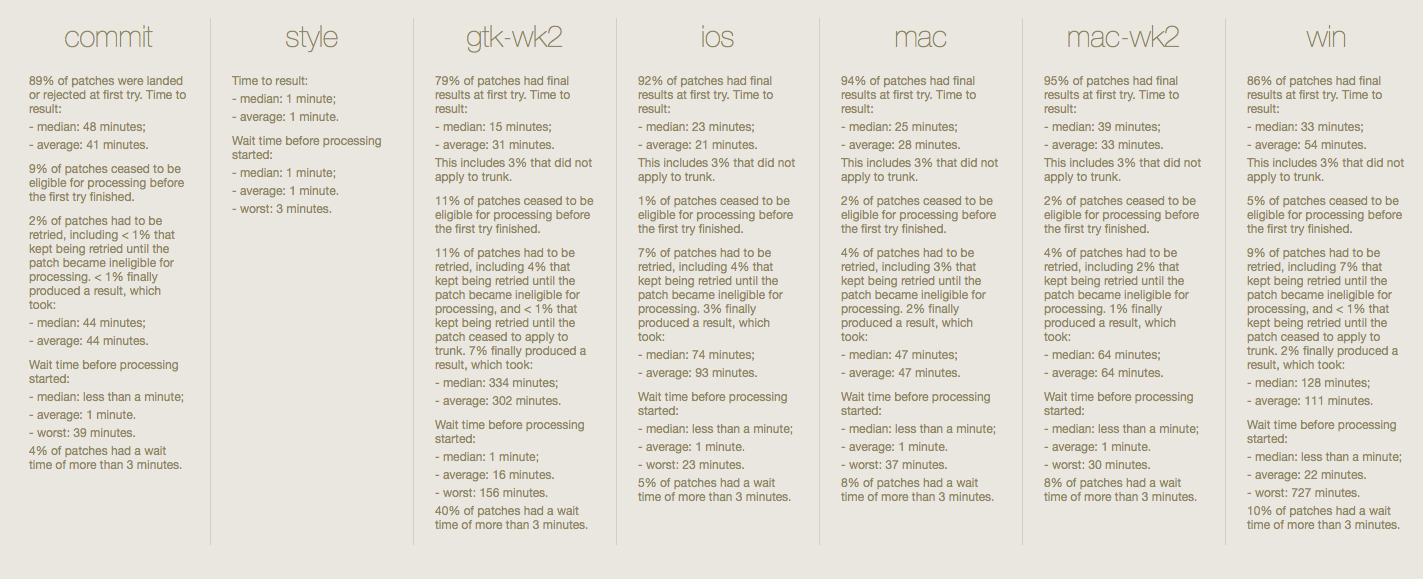
Our visualization is an exploratory tool for analyzing data from bots running WebKit patch tests. The current dashboard for the tests is a large table of text. It provides accurate data, but it is difficult to read and doesn't provide insight into the form of the test process:
Our visualization is designed to graphically represent the testing process, showing the flow of patch test attempts as the come from the queue and are run by bots multiple times against system builds. The different outcomes (pass, fail, abort, and retry) are represented by arrows, which we label with percentages from the patch test data:

The views are linked: the queue flow diagram can be used as a selection tool to choose a subset of the patch test results. This subset will be displayed in both D3 histograms and a details table below.
Access our visualization at http://cse512-15s.github.io/a3-adityas-burg-aburner/ or download this repository and open dashboard/pipeline.html.
To use the visualization:
- Select a date range at the top of the page
- Wait for test results data to load from API
- Use the queue flow diagram to select a test outcome
- View detailed breakdowns of the test outcomes in the histogram and table
-
In our initial storyboard, we planned to display all queue data in the histograms and tables, and then selecting specific outcomes in the queue flow diagram would filter the data down to a subset. However, this amount of data became prohibitive to work with, and so now the visualization starts with no histogram or table data and the user must make a selection from the diagram to populate them.
-
At first we planned to include Author and Bug Description columns in the patch results details table. However these would require separate XML API calls per each patch. We decided this would take too long to load, and so those columns are left out of our final submission. (This data depends on an upgrade of the WebKit project's Bugzilla bug tracker.)
-
We wanted to be able to select ranges in the histogram, updating the details table (linking and brushing). However we did not have time to complete this complex of an interaction task.
-
Breaking news: the histogram and table always show all of the data for a selected queue (instead of filtering by the specific outcome chosen). We ran out of time to complete our data filtering.
- identified the target domain and data
- created the initial storyboard and mockups
- designed the data model and selection model
- misc.
- converted mockup to real HTML + SVG
- implemented the attempts table
- worked on first version of diagram selection model
- project documentation
- created the linked histogram views
- our application took roughly 25 man hours to complete
- gathering and formatting the data took the most time
- user events and view linking took a lot of time too


