This tool is designed to help Power BI developers/admins match Visual IDs from Log Analytics to specific visuals in their Power BI report. Additionally, Report Analyzer provides a visual interface for prioritizing performance troubleshooting.
Report Analyzer is an External Tool for Power BI Desktop.
In order to take full advantage of the tool, make sure you run the Performance Analyzer across all tabs in your Power BI report and export the results to a .json file. Save the performance data file to the same folder as your Power BI Desktop/Template file(s). Report Analyzer is able to handle multiple .pbix/.pbit files as well as multiple Performance Analyzer .json files.
NOTE: There is no specific naming requirement for performance data .json files.
- Install Report Analyzer.
- Open Power BI Desktop.
- Navigate to 'External Tools' in the ribbon.
- Open Report Analyzer.
- Select the folder which contains your Power BI Desktop (or Power BI Template) file(s) as well as the Performance Analyzer export (.json) file.
This tool is compatible with Power BI Desktop, Power BI Templates, and Performance Analyzer data (.json) files. All files must be in the same folder for the tool to integrate all of these files.
- Visually see Performance Analyzer data overlaid on each visual on a simulated Power BI Desktop canvas.
- Find a specific visual by searching by Visual ID (especially useful for matching Visual IDs from Log Analytics).
- Easily see all visuals of a specific visual type (i.e. card).
- Use the slider to select a DAX Query Time which highlights visuals (red border) with DAX Query times slower than the selected time (in seconds).
- Hover over a visual to see additional tooltip information.
- Visual ID, Visual Name, Page Name, Report Name, DAX Query Time, Render Time, Row Count, Columns Used, Measures Used, Hierarchies Used, Custom Visual Flag, Visual Contains a Report-Level Measure.
- Click on a visual to copy additional information to the clipboard (including the DAX Query).
- Supports loading multiple Power BI Desktop/Template files and automatically associating them with the Performance Analyzer .json files (must all be in the folder selected in the start screen).
- Dark mode out of the box.
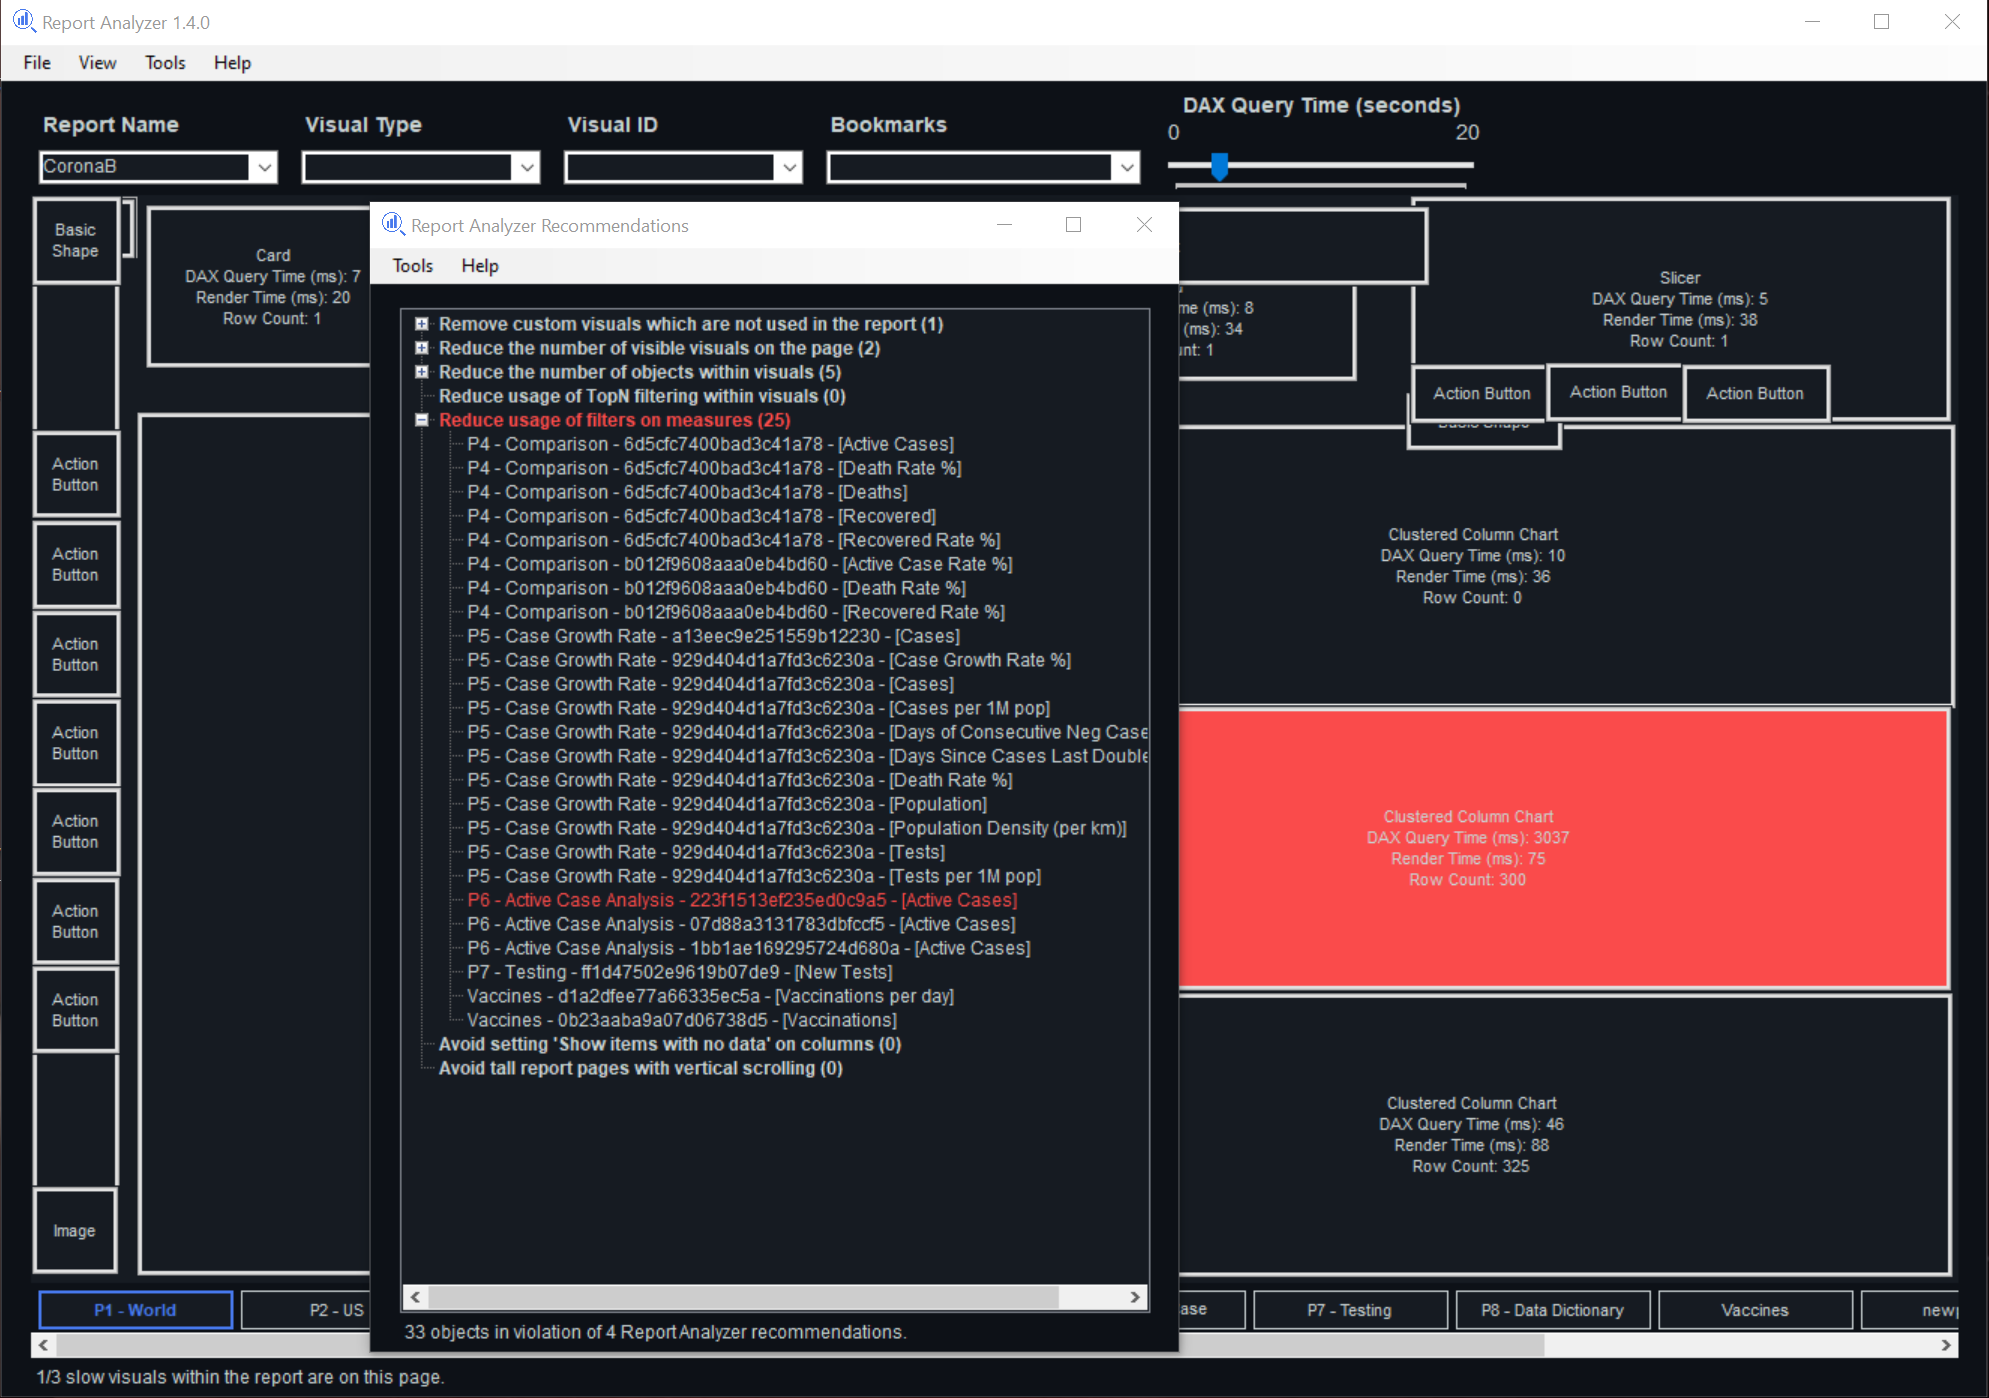
- Report Analyzer Recommendations (as of v1.1.0).
- Export Report Metadata (as of v1.2.0) - this exports the report metadata (objects) in the same fashion as the Export Report Objects script.
- Bookmarks slicer allows for updating the simulated Power BI canvas to show the visuals per the settings of the selected bookmark (as of v1.4.0).
- Make sure to see my blog post on this topic for additional context regarding the recommendations!
- 7 pre-loaded recommendations available to be run against your reports.
- Following these recommendations will generally yield more performant reports.
- Each recommendation and object has tooltips on hover which provide additional context regarding the recommendation and objects which violate the best practice.
- Clicking on objects within the recommendations will navigate you to the particular page/visual where additional information can be found and performance improvement actions can commence.
- Recommendations in red text have visuals which are deemed 'slow queries' (based on the DAX Query Time threshold)
- Visuals in red text are deemed 'slow queries' (based on the DAX Query Time threshold)
- The number in parenthesis next to a recommendation shows the number of objects which violate the recommendation
- The number in parenthesis next to a violation shows the number of objects within that object (visual/page/report)
Report Analyzer can be used to match Log Analytics queries to a specific visual in a Power BI report. In order to do this, follow these steps:
- Navigate to your Log Analytics Workspace.
- Click on 'Logs' within the 'General' category on the left pane.
- Paste the Kusto query (see below).
- Add any additional filters to the Kusto query (as desired - perhaps based on time etc.).
- Copy the VisualId from the Kusto query and search for it within the Report Analyzer's Visual ID slicer (must be connected to the same report).
PowerBIDatasetsWorkspace
| where OperationName == "QueryEnd"
| project WorkspaceName
,DatasetId = substring(ApplicationContext,indexof(ApplicationContext,"{\"DatasetId\":")+14,36)
,ReportId  = substring(ApplicationContext,indexof(ApplicationContext,"{\"ReportId\":")+13,36)
,VisualId  = substring(ApplicationContext,indexof(ApplicationContext,",\"VisualId\":")+13,20)
,DurationMs
,EventText
,ApplicationContext
| order by DurationMs desc
NOTE: A simple way to find the Report ID of a Power BI report is by navigating to the report page within PowerBI.com and copying the GUID within the URL after 'reports' (highlighted in orange in the screenshot below).

- In order to obtain the report metadata, Report Analyzer 'hacks' into the Power BI Desktop file. This type of operation is not supported by Microsoft.

