![]()


klib is a Python library for importing, cleaning, analyzing and preprocessing data. Explanations on key functionalities can be found on Medium / TowardsDataScience and in the examples section. Additionally, there are great introductions and overviews of the functionality on PythonBytes or on YouTube (Data Professor).
Use the package manager pip to install klib.

pip install -U klibAlternatively, to install this package with conda run:


conda install -c conda-forge klibimport klib
import pandas as pd
df = pd.DataFrame(data)
# klib.describe - functions for visualizing datasets
- klib.cat_plot(df) # returns a visualization of the number and frequency of categorical features
- klib.corr_mat(df) # returns a color-encoded correlation matrix
- klib.corr_plot(df) # returns a color-encoded heatmap, ideal for correlations
- klib.corr_interactive_plot(df, split="neg").show() # returns an interactive correlation plot using plotly
- klib.dist_plot(df) # returns a distribution plot for every numeric feature
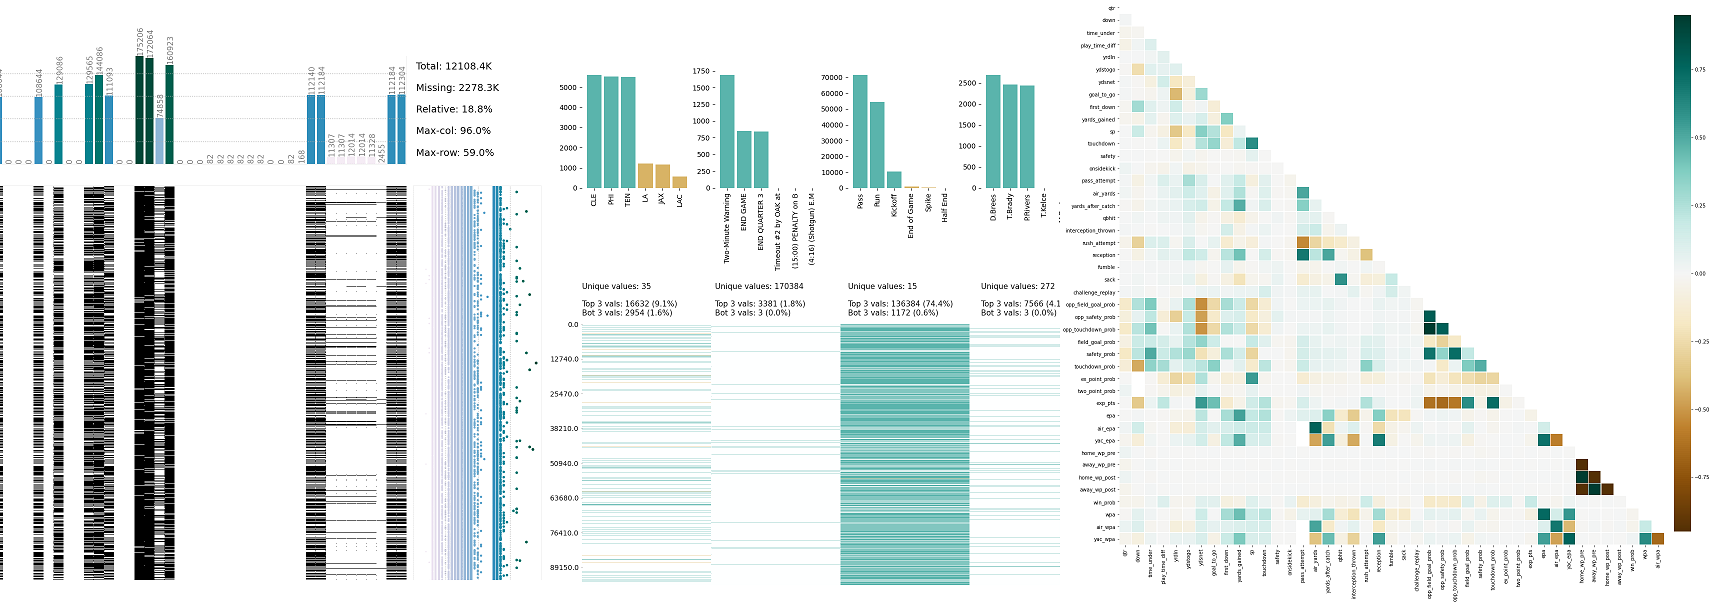
- klib.missingval_plot(df) # returns a figure containing information about missing values
# klib.clean - functions for cleaning datasets
- klib.data_cleaning(df) # performs datacleaning (drop duplicates & empty rows/cols, adjust dtypes,...)
- klib.clean_column_names(df) # cleans and standardizes column names, also called inside data_cleaning()
- klib.convert_datatypes(df) # converts existing to more efficient dtypes, also called inside data_cleaning()
- klib.drop_missing(df) # drops missing values, also called in data_cleaning()
- klib.mv_col_handling(df) # drops features with high ratio of missing vals based on informational content
- klib.pool_duplicate_subsets(df) # pools subset of cols based on duplicates with min. loss of informationFind all available examples as well as applications of the functions in klib.clean() with detailed descriptions here.
klib.missingval_plot(df) # default representation of missing values in a DataFrame, plenty of settings are available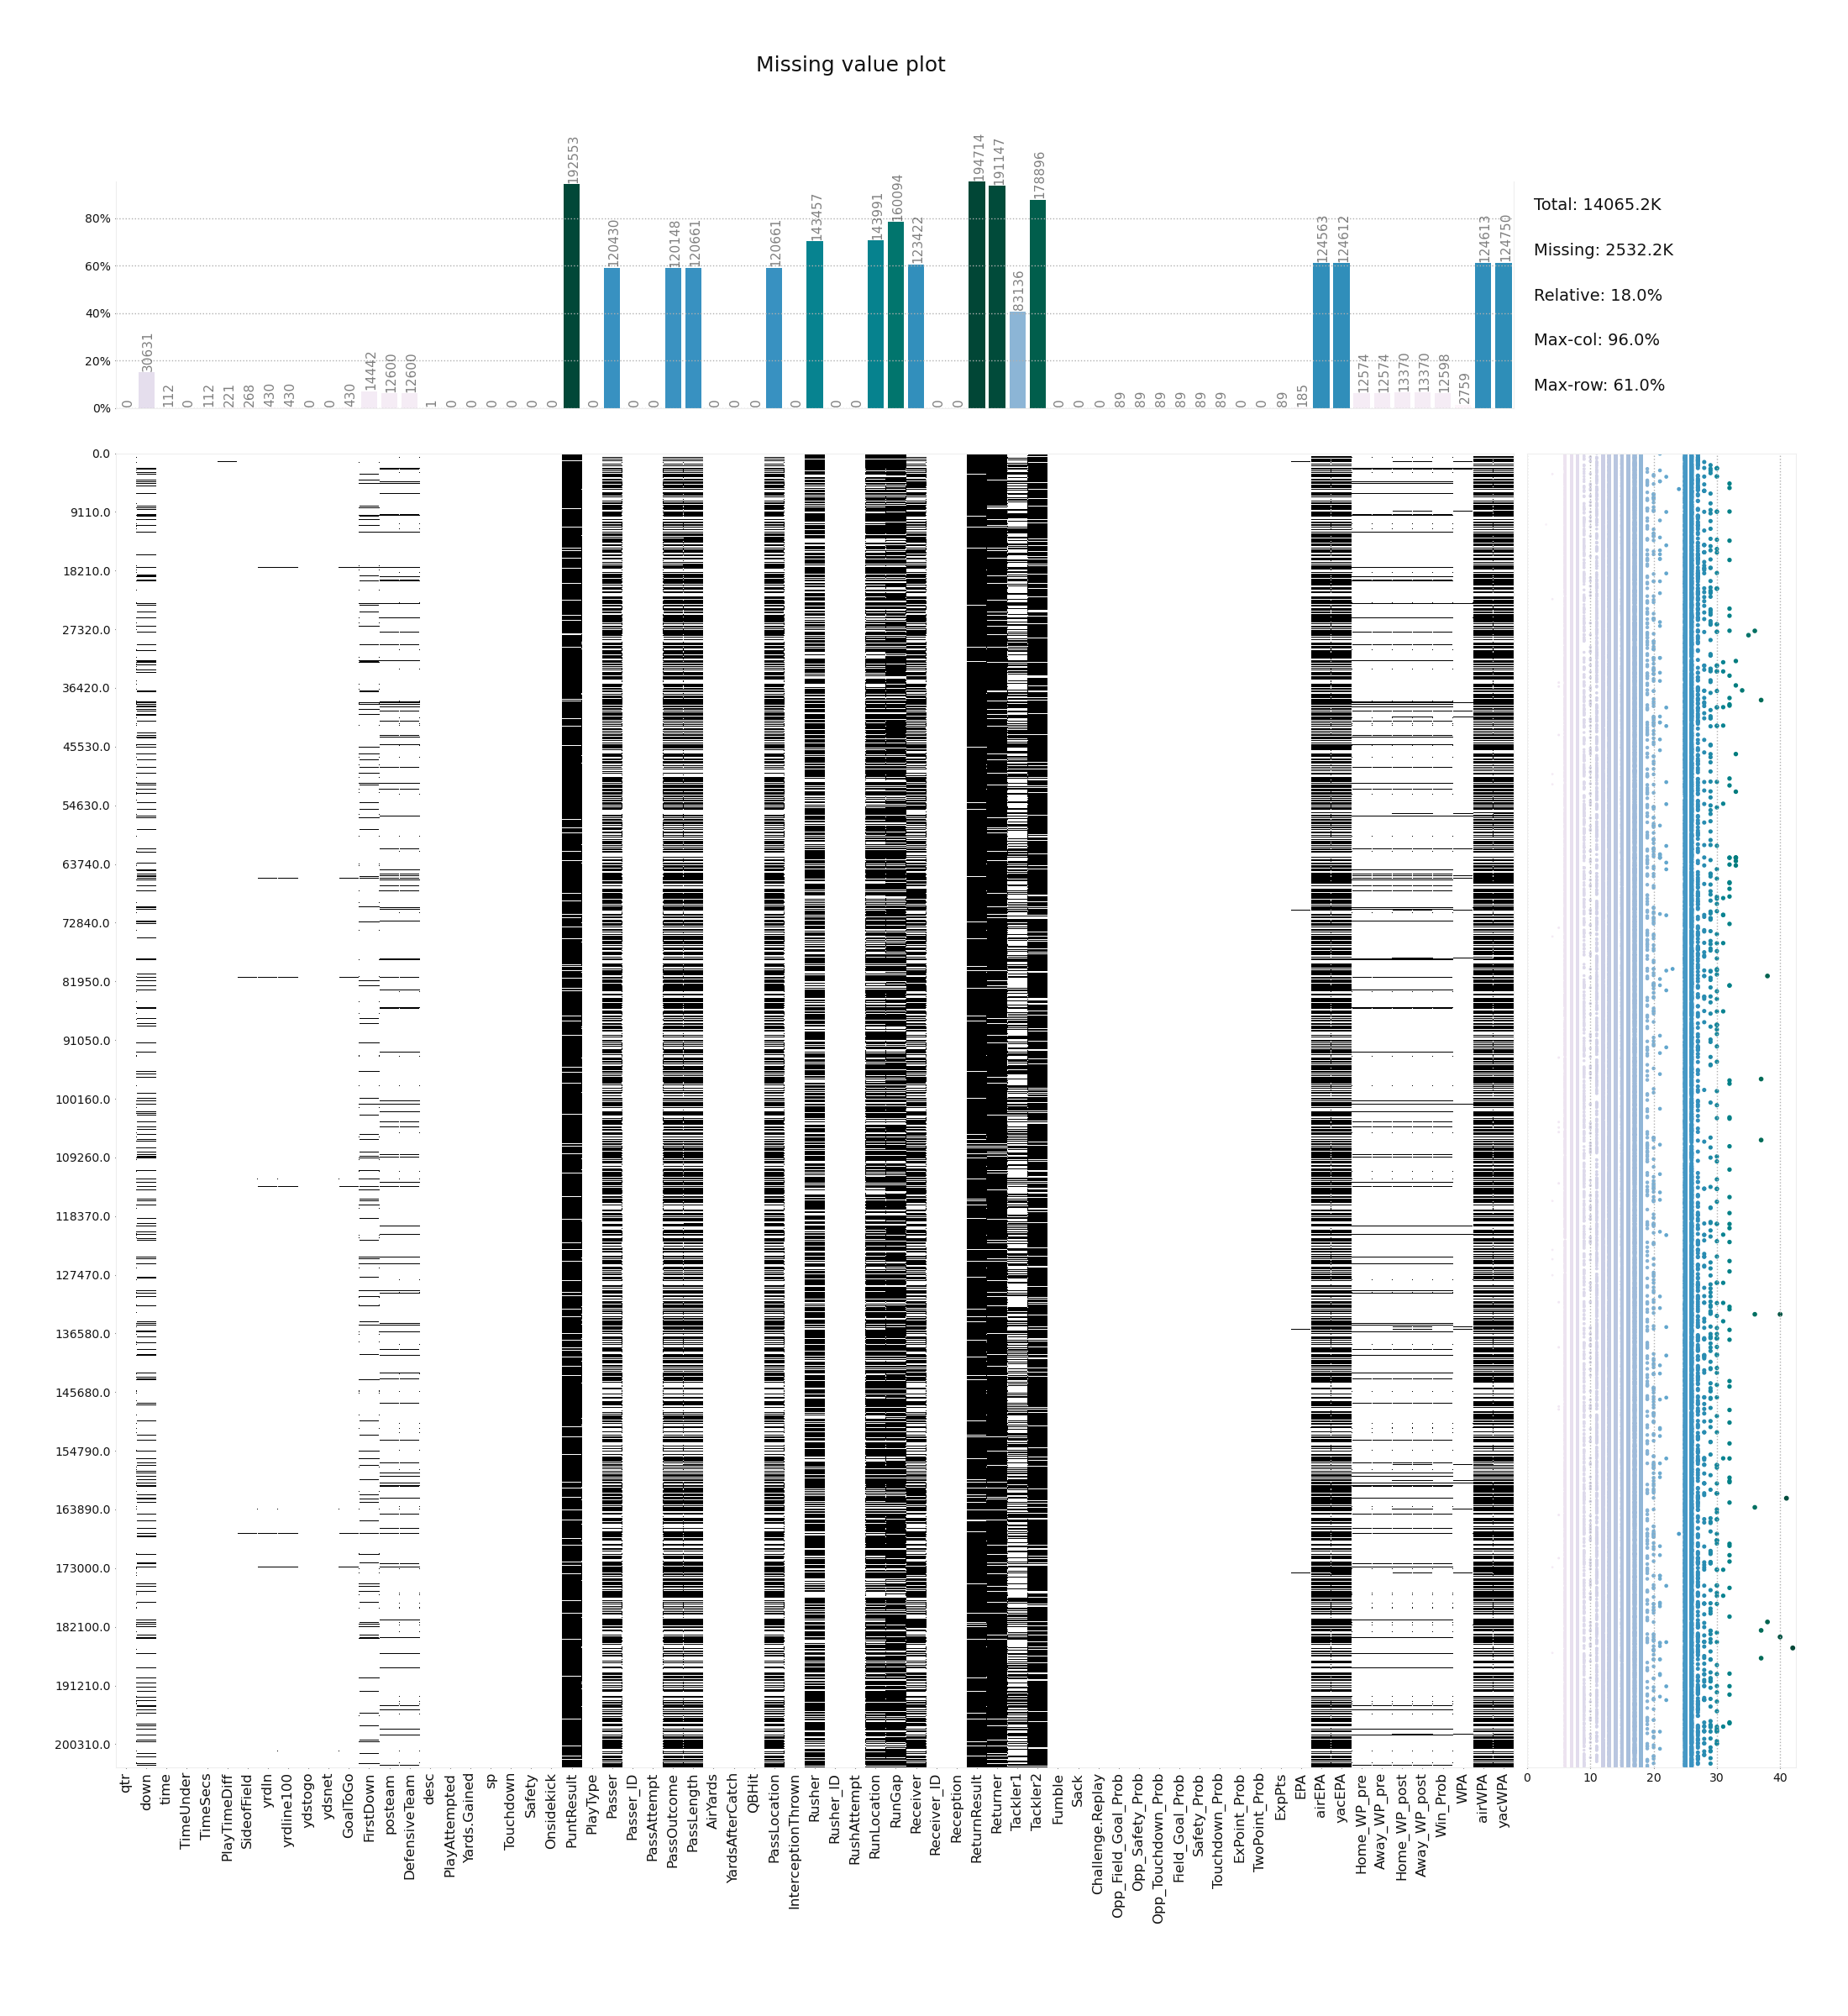
klib.corr_plot(df, split='pos') # displaying only positive correlations, other settings include threshold, cmap...
klib.corr_plot(df, split='neg') # displaying only negative correlations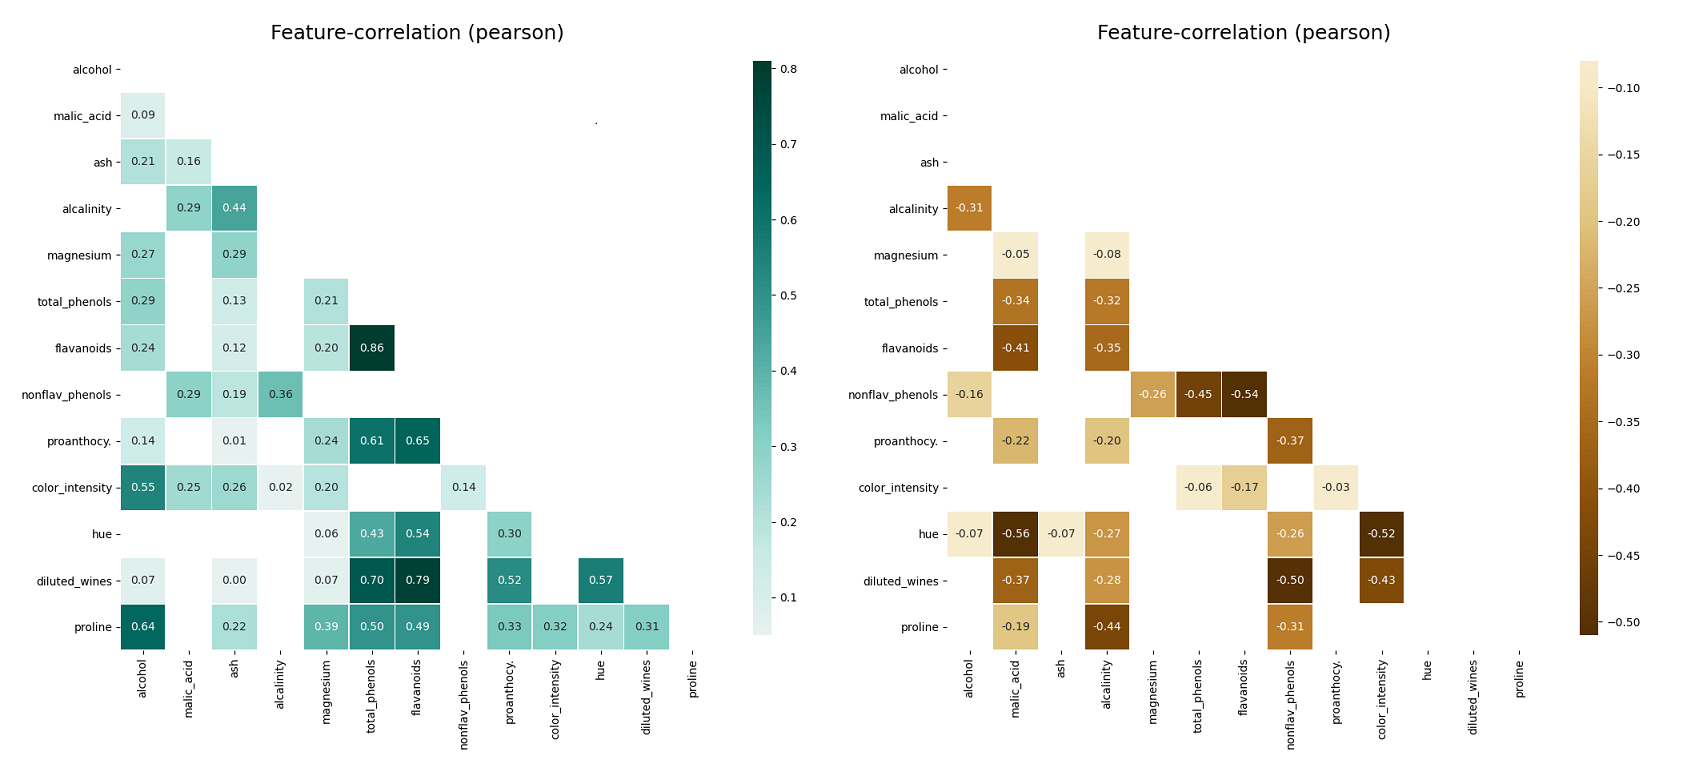
klib.corr_plot(df, target='wine') # default representation of correlations with the feature column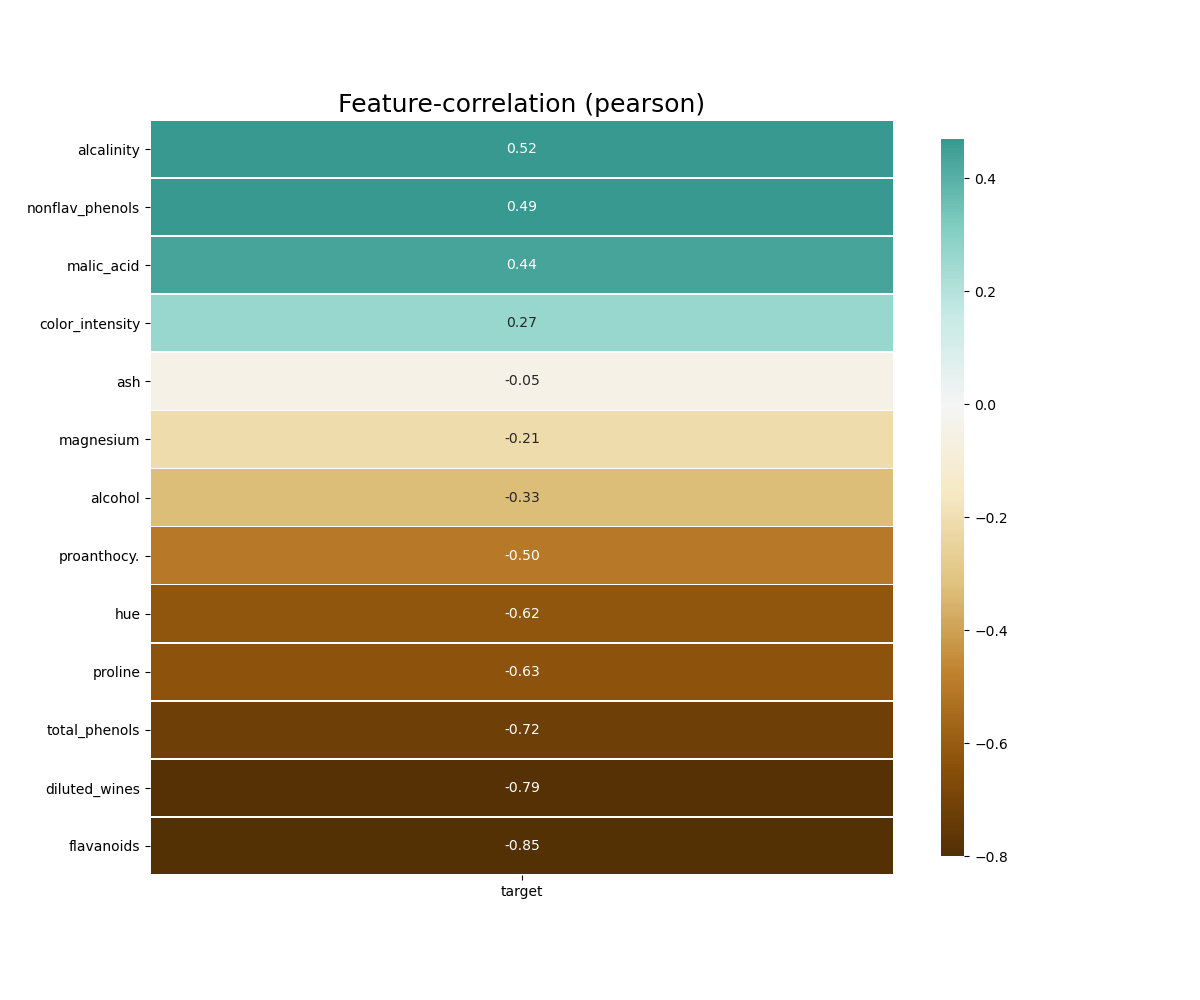
klib.corr_interactive_plot(df, split="neg").show()

# The interactive plot has the same parameters as the corr_plot, but with additional Plotly heatmap graph object kwargs.
klib.corr_interactive_plot(df, split="neg", zmax=0)

#Since corr_interactive_plot returns a Graph Object Figure, it supports the update_layout chain method.
klib.corr_interactive_plot(wine, split="neg").update_layout(template="simple_white")
klib.dist_plot(df) # default representation of a distribution plot, other settings include fill_range, histogram, ...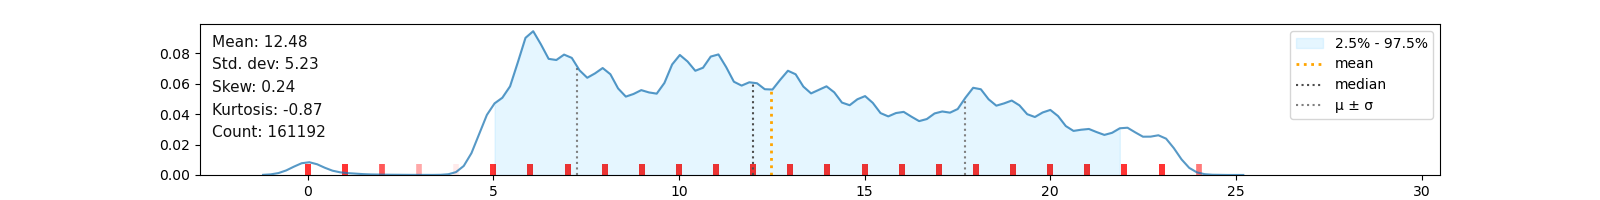
klib.cat_plot(data, top=4, bottom=4) # representation of the 4 most & least common values in each categorical column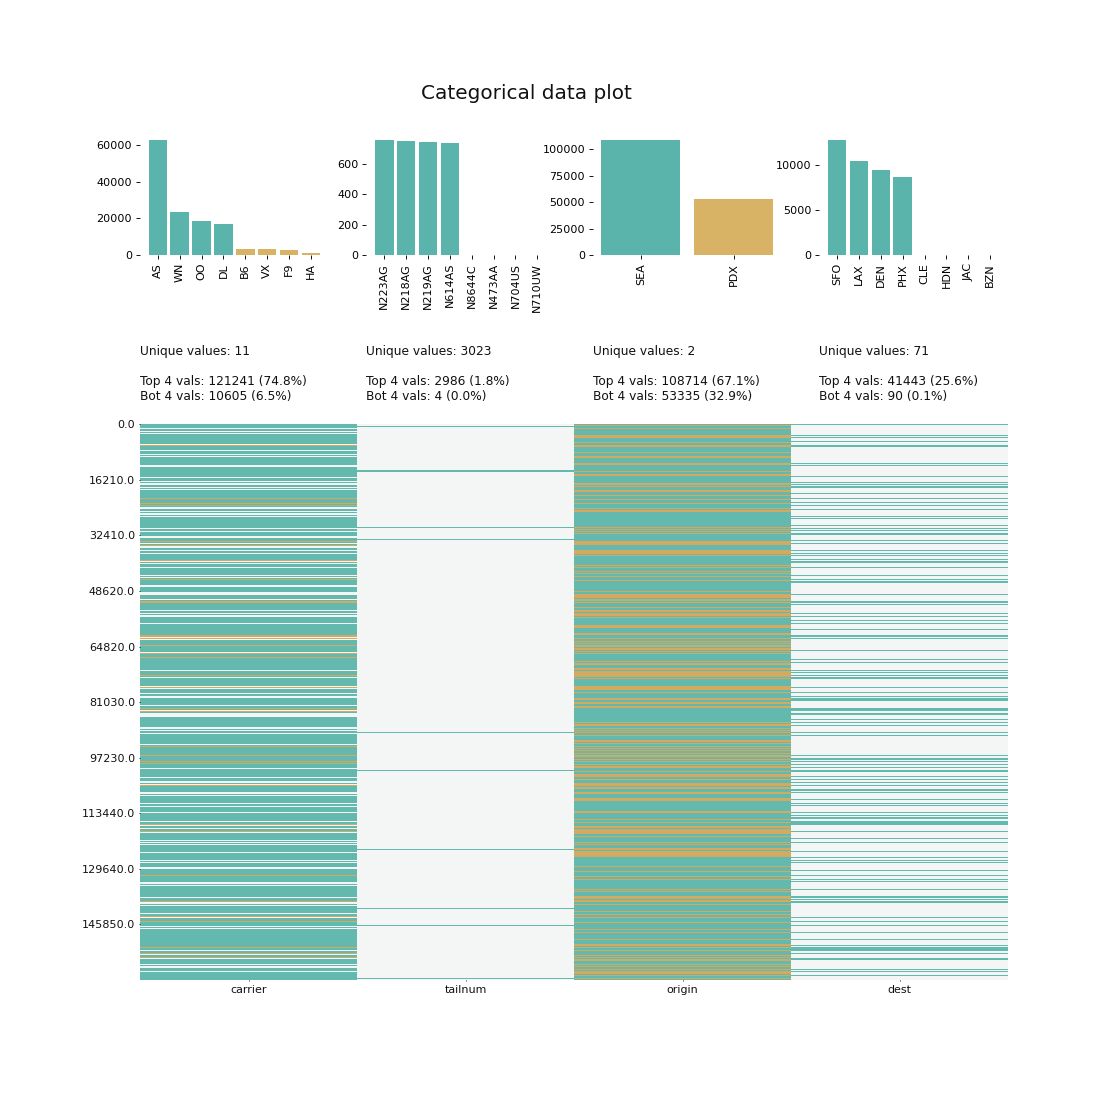
Further examples, as well as applications of the functions in klib.clean() can be found here.

Pull requests and ideas, especially for further functions are welcome. For major changes or feedback, please open an issue first to discuss what you would like to change.


![dependabot[bot] avatar](https://avatars.githubusercontent.com/in/29110?v=4 "dependabot[bot]")


