aeyrium / bezier-chart Goto Github PK
View Code? Open in Web Editor NEWA beautiful bezier line chart widget for flutter that is highly interactive and configurable.
License: Apache License 2.0
A beautiful bezier line chart widget for flutter that is highly interactive and configurable.
License: Apache License 2.0


Thanks so much for this charting library!
I think I may have found a small bug…. Of course it may be by design so the chart doesn’t appear until you have multiple points to plot…
On BezierChartScale.WEEKLY
When adding the first point to a graph it will not appear. I tracked it to this code… Also I believe one point will be dropped from the graph with multiple points.
      for (int i = 0; i < days; i++) {
        final newDate = widget.fromDate.add(
          Duration(
            days: (i+1),
          ),
        );
I think it should be this.
      for (int i = 0; i  <= days; i++) { //otherwise will not show if only 1 and drop one of the points if more than 1 day?
        final newDate = widget.fromDate.add(
          Duration(
            days: (i), //remove +1 so dates match up with data points.
          ),
        );
There is also a second possible gotcha…
If the fromDate and toDate have less than 24 hours between them it will merge the dates, not necessarily by the right date. I fixed this by dropping the hours:minutes:seconds from my DateTime Objects. Maybe have something in the docs about it? In any case I was able to fix that with the input data, but Dates might not match up as expected when using difference if points are less than 24 hours apart but appear on different days. Here is that line:
final days = widget.toDate
          .difference(widget.fromDate)
          .inDays;
I think you could fix this by converting the fromDate and toDate to date only(no time value) and then getting the difference that way.
Function to convert to date only (no time)…
DateTime convertToDateOnly(DateTime date) {
  int year = date.year;
  int month = date.month;
  int day = date.day;
  return DateTime(year, month, day);
}
Third and final potential gotcha. If fromDate == toDate that isn’t allowed either so I needed to add a second to the toDate if only one data point. So that’s an easy fix too without changing the charting library. Not sure if you wanted to handle that in the library or not.
Anyway thanks for your really nice charting library. This will save me so much time!
There are something like selectedDate for CUSTOM?

Hello,
I was trying to launch the example project but the compiler gives me the following errors:
Compiler message:
lib/main.dart:275:31: Error: Getter not found: 'white60'.
                color: Colors.white60,
                              ^^^^^^^
file:///path/bezier-chart-master/lib/src/bezier_chart_widget.dart:414:11: Error: Method not found: 'LongPressMoveUpdateDetails'.
          LongPressMoveUpdateDetails(
          ^^^^^^^^^^^^^^^^^^^^^^^^^^
file:///path/bezier-chart-master/lib/src/bezier_chart_widget.dart:414:11: Error: The method 'LongPressMoveUpdateDetails' isn't defined for the class 'BezierChartState'.
 - 'BezierChartState' is from 'package:bezier_chart/src/bezier_chart_widget.dart' ('file:///path/bezier-chart-master/lib/src/bezier_chart_widget.dart').
Try correcting the name to the name of an existing method, or defining a method named 'LongPressMoveUpdateDetails'.
          LongPressMoveUpdateDetails(
          ^^^^^^^^^^^^^^^^^^^^^^^^^^
file:///path/bezier-chart-master/lib/src/bezier_chart_widget.dart:679:11: Error: No named parameter with the name 'onLongPressStart'.
          onLongPressStart: isPinchZoomActive ? null : _onDisplayIndicator,
          ^^^^^^^^^^^^^^^^
file:///otherpath/flutter/packages/flutter/lib/src/widgets/gesture_detector.dart:166:3: Context: Found this candidate, but the arguments don't match.
  GestureDetector({
  ^
Compiler failed on path\bezier-chart-master\example\lib\main.dart
Finished with error: Gradle task assembleDebug failed with exit code 1
Can you help me? Did I miss some dependency?

We're having an issue when setting a Custom Scale chart to display the Y axis with steps set to 2.
Thank you for your efforts on this widget!
`Container(
color: Colors.transparent,
height: 250,
child: BezierChart(
bezierChartScale: BezierChartScale.CUSTOM,
xAxisCustomValues: const [0, 1, 2, 3, 4, 5, 6, 7, 8, 9, 10, 11, 12, 13, 14, 15, 16, 17, 18, 19, 20, 21, 22, 23],
footerValueBuilder: (double value) {
              int hour = value.toInt();

              if(hour == 0) {
                return '12 am';
              } else if (hour < 12) {
                return '$hour am';
              } else {
                return '${hour > 12 ? hour - 12 : hour} pm';
              }
            },
            series: [
              BezierLine(
                lineColor: Colors.blue,
                lineStrokeWidth: 2.0,
                label: "feet",
                data: dataPoints,
              ),
            ],
            config: BezierChartConfig(
              verticalIndicatorStrokeWidth: 2.0,
              verticalIndicatorColor: Colors.grey.shade800,
              bubbleIndicatorColor: Colors.grey.shade800,
              displayYAxis: true,
              startYAxisFromNonZeroValue: false,
              stepsYAxis: 2,
              contentWidth: 1400,
              bubbleIndicatorTitleStyle: TextStyle(
                color: Colors.grey.shade800,
              ),
              bubbleIndicatorValueStyle: TextStyle(
                color: Colors.white
              ),
              yAxisTextStyle: TextStyle (
                fontSize: 14
              ),
              xAxisTextStyle: TextStyle (
                fontSize: 14
              ),
            ),
          )
        ),`
Would it be possible to add the options below?
Display a vertical indicator at each x-value, instead of only the selected value.
Apply the gradient to only the space below the curve. Not the entire background.
Widget sample4(BuildContext context) {
  final fromDate = DateTime(2019);
  final toDate = DateTime(2019,12);
  return Center(
    child: Container(
      color: Colors.red,
      height: MediaQuery.of(context).size.height / 4,
      width: MediaQuery.of(context).size.width,
      child: BezierChart(
        bezierChartScale: BezierChartScale.MONTHLY,
        fromDate: fromDate,
        toDate: toDate,
        selectedDate: toDate,
        series: [
          BezierLine(
            label: "Orders",
//            onMissingValue: (dateTime) {
//              if (dateTime.month.isEven) {
//                return 10.0;
//              }
//              return 5.0;
//            },
            data: [
              DataPoint<DateTime>(value: 10, xAxis: DateTime(2019,1)),
              DataPoint<DateTime>(value: 30, xAxis: DateTime(2019,2)),
              DataPoint<DateTime>(value: 30, xAxis: DateTime(2019,3)),
              DataPoint<DateTime>(value: 30, xAxis: DateTime(2019,4)),
              DataPoint<DateTime>(value: 30, xAxis: DateTime(2019,5)),
              DataPoint<DateTime>(value: 30, xAxis: DateTime(2019,6)),
            ],
          ),
        ],
        config: BezierChartConfig(
          verticalIndicatorStrokeWidth: 3.0,
          verticalIndicatorColor: Colors.black26,
          showVerticalIndicator: true,
          verticalIndicatorFixedPosition: false,
          backgroundColor: Colors.green,
          footerHeight: 30.0,
        ),
      ),
    ),
  );
}

Issue:
As u can see from the image, the year is cut off
It would be very helpful to show the month and the year in the WEEKLY date format chart because, if you have many months shown on the chart you wouldn't know for what month are those days.
Problem:

In this case, you can't say which month and year is the shown date. A workaround would be this:

You could add 2 props:
Can we show line between two points instead of bezier?
As with Flutter 1.9, the flutter web platform has merged with the main flutter repository, it should be possible to use libraries that function on the main flutter repository and make web builds with them. With this library, however, while trying to use this bezier-chart library I get the following error that makes my compiling skip.
bezier_chart|lib/src/bezier_chart_widget.dart
I don't want the chart scrollable , just show two dot , begin and end of query date time .
How can this do that ?
I was trying to use the below to animate the datapoints. I feel like it is close, but it's just not happening. If I click on the graph the points all jump into place, but it's not actually performing the tween. I am guessing it is missing a set state, but I am not quite sure how I would implement that. Any suggestions?
An example can be seen here. https://i.imgur.com/jn7rEib.gifv
Thanks,
-MH
  double numberAnimate(double order, double current) {
    var adjustedValue = new Tween(begin: 1.0, end: current).animate(
      new CurvedAnimation(
        parent: controller,
        curve: new Interval(
          0.350, // + (order * 0.1),
          0.650,
          curve: Curves.easeIn,
        ),
      ),
    );
    return adjustedValue.value;
} data: [
DataPoint<double>(
value: widget._controller
.numberAnimate(date7.day.truncateToDouble(), 10.0),
xAxis: date7.day.truncateToDouble()),
DataPoint<double>(
value: widget._controller
.numberAnimate(date6.day.truncateToDouble(), 30.0),
xAxis: date6.day.truncateToDouble()),
DataPoint<double>(
value: widget._controller
.numberAnimate(date5.day.truncateToDouble(), 50),
xAxis: date5.day.truncateToDouble()),
DataPoint<double>(
value: widget._controller
.numberAnimate(date4.day.truncateToDouble(), 20),
xAxis: date4.day.truncateToDouble()),
DataPoint<double>(
value: widget._controller
.numberAnimate(date3.day.truncateToDouble(), 80),
xAxis: date3.day.truncateToDouble()),
DataPoint<double>(
value: widget._controller
.numberAnimate(date2.day.truncateToDouble(), 14),
xAxis: date2.day.truncateToDouble()),
DataPoint<double>(
value: widget._controller
.numberAnimate(date1.day.truncateToDouble(), 30),
xAxis: date1.day.truncateToDouble()),
],A few things to make the library even more amazing:
Interactive legends
For charts with multiple lines it would be great if there was an option to add legends on top of the chart.
The legends will get the same text as the labels in the bubble.
The legend shape and type could be one of 2 options
a) Informative - A simple circle/square with the same color as the line next to the text (like a regular legend)
b) Interactive - A checkbox with the same color as the line that when checked will show/hide the line from the chart.
When using the monthly chart and the series is less than a year, the width is smaller than the screen width (or the charts given width). It could be awesome to get an option to force filling the charts width for a more professional look.
Hourly chart - A series of a 24 hour period showing the data per hour
Sorry, couldn't find your email address, so posting here. @diegoveloper are you and/or your team interested in freelance work? I may have a project you can assist with. If interested, let me know the best place to discuss.
Hey there,
I was just wondering what the possibility of allowing for a second Y-axis on the right side of the chart which uses a different scale might be and then allowing say one line graph to use one, and a second line to use the other? Also, any chance you might ever consider adding bar charts as well? I have been trying out all of the charts out there for flutter and I like this one the best so far, but what would really drive it home would be a bit more flexibility like those I mentioned.
Keep up the great work!
Thanks,
-MH
Hi. I'm fetching my data from an external source into a model inside my app. Do I need to convert this data model to a DataPoint model to make it work ? Are there examples on how to do it ?
many thanks in advance
Hello,
Could you please include the Daily parameter in BezierChartScale ?
Thanks !
Failed assertion: line 113 pos 9: '(bezierChartScale == BezierChartScale.CUSTOM &&
        _checkCustomValues(series)) ||
        bezierChartScale != BezierChartScale.CUSTOM'

how can I solve this ?
bezierChartScale: BezierChartScale.CUSTOM,
xAxisCustomValues: xpots,
footerValueBuilder: (double value) {
return "${formatAsIntOrDouble(value)}\n周";
},
From what I saw, the only option to style the bubble indicator is using the bubbleIndicatorColor option, which only let you style the background of the bubble indicator.
The problem appears when I'm using a light theme and I need to make the bubble indicator grey, because white won't be a good choice.
Example:

Now the label disappear because it's the same color as the background. It would be nice if you can add 3 more props:

Is it possible to add some y axis labels?
Would it be possible to add an option, where one can set an aggregation method besides sum?
Hi there, is it possible to localize xAxis values when they are from DateTime type?
onMissingValue just receive a dateTime as param, how can I return previous value when missing value?
hope this
Hi there,
I wonder if the chart can be configured to show data points on the curve only in case data series provide y value for specific x value? In case the y value is provided from onMissingValue callback, the point should not be drawn onto the curve. Again in case this is not possible (as I suspect), could be so kind to direct me to the code, so I can see if I can tweak it?
Thanks!
In case displayYAxis = true and the user scrolls to the leftmost chart side, the bubble indicator gets cut off on the left side. See the screenshot enclosed.

In case yAxis isn't present all seems good. Apparently, some space should be reserved for the bubble, in case yAxis is present.
The first point of the line seems to be always zero and this gives a vertical line connected to the first datapoint. Your example with increased numbers:

Another example with a little more data:

The dataset used:
[value: 100.25, xAxis: 1.0, value: 103.12, xAxis: 2.0, value: 108.0, xAxis: 3.0, value: 103.06, xAxis: 4.0, value: 103.0, xAxis: 5.0, value: 106.25, xAxis: 6.0, value: 108.0, xAxis: 7.0, value: 105.25, xAxis: 8.0, value: 107.69, xAxis: 9.0, value: 108.62, xAxis: 10.0, value: 107.0, xAxis: 11.0, value: 109.0, xAxis: 12.0, value: 110.0, xAxis: 13.0, value: 112.75, xAxis: 14.0, value: 113.5, xAxis: 15.0]
The line between the two fist points of the chart is not vertical here because I started my labels at 1,
How can I avoid displaying the first zero value to get a readable chart?
When I change the bottom text with footerValueBuilder should update the popup bubble text.
Is there a way currently?
Even by editing the code. I would need to blur what's behind the widget's background only not the colored bar itself.
Can you add fill gradient.

In my understanding, fromDate / toDate pair allows to define useful timespan over the existing data series, meaning even though the time series can include date point before fromDate or after toDate, they won't be visible on the chart. So far so good.
Now, what I would like to achieve is to change let's say fromDate value and this to reflect over the date points visibility.
To be more specific, let's suppose fromDate = DateTime(2019, 07, 1) and I have following data series (bezierChartScale: BezierChartScale.WEEKLY,):
[
   DataPoint<DateTime>(value: 45.5, xAxis: DateTime(2019, 7, 25)), //  point 1
   DataPoint<DateTime>(value: 48.5, xAxis: DateTime(2019, 7, 30)), // point 2
   DataPoint<DateTime>(value: 45.5, xAxis: DateTime(2019, 8, 25)), // point 3
   DataPoint<DateTime>(value: 48.5, xAxis: DateTime(2019, 8, 30)), // point 4
]
In this case, all 4 points will be present on the chart.
Now, let's change fromDate = DateTime(2019, 08, 1), then, I should see only points 3 & 4.
This one works however only in case the widget where chart is built is initially created.
In case this is StatefulWidget and I make
setState(() {
  fromDate = DateTime(2019, 08, 1);
});
I expected to see chart updated, however it didn't affect the chart.
it possible to add the month to the WEEKLY DateTime format?
Something like Tue 18/5 instead of Tue 18?
Or at least add an option for a format parameter.
It is necessary for a weekly chart over a span of 30 days for example:
fromDate is 18/5 and toDate is 17/6
Currently it is very difficult to know the day of which month you are currently viewing
Please see the screenshot below:

As you can see, the first data point has value of 44.5, which is exactly the middle between 44 and 45, hence AB should equal BC. As seen on the screenshot however this is not the case.
Below is the code you can use to reproduce it. I use the master branch right from the github:
Widget sample3(BuildContext context) {
  final fromDate = DateTime(2019, 08, 1);
  final toDate = DateTime.now();
  final date1 = DateTime.now().subtract(Duration(days: 2));
  final date2 = DateTime.now().subtract(Duration(days: 3));
  return Center(
    child: Container(
      color: Colors.red,
      //height: MediaQuery.of(context).size.height / 2,
      //width: MediaQuery.of(context).size.width,
      child: BezierChart(
        fromDate: fromDate,
        bezierChartScale: BezierChartScale.WEEKLY,
        toDate: toDate,
        onIndicatorVisible: (val) {
          print("Indicator Visible :$val");
        },
        onDateTimeSelected: (datetime) {
          print("selected datetime: $datetime");
        },
        selectedDate: toDate,
        //this is optional
        footerDateTimeBuilder: (DateTime value, BezierChartScale scaleType) {
          final newFormat = intl.DateFormat('dd/MMM', "bg_BG");
          return newFormat.format(value);
        },
        bubbleLabelDateTimeBuilder:
            (DateTime value, BezierChartScale scaleType) {
          final newFormat = intl.DateFormat('EEE d', "bg_BG");
          return "${newFormat.format(value)}\n";
        },
        series: [
          BezierLine(
            label: "Duty",
            onMissingValue: (dateTime) {
              return 44.5;
            },
            data: [
              DataPoint<DateTime>(value: 44.5, xAxis: fromDate),
              DataPoint<DateTime>(value: 40, xAxis: date1),
              DataPoint<DateTime>(value: 43.5, xAxis: date2),
            ],
          ),
        ],
        config: BezierChartConfig(
          displayDataPointWhenNoValue: false,
          verticalIndicatorStrokeWidth: 3.0,
          pinchZoom: false,
          verticalIndicatorColor: Colors.black26,
          showVerticalIndicator: true,
          verticalIndicatorFixedPosition: false,
          backgroundColor: Colors.red,
          displayYAxis: true,
          stepsYAxis: 1,
        ),
      ), // bc
    ),
  );
}
I want to have a few graphs in separate cupertino segment.
When I switch between tabs the chart data is refreshed but the chart remains with the initial data (does not refresh - kind of like a singleton chart)
Each tab has a different date range (monthly, weekly etc...)
data like[value: 12346973724.0, xAxis: 2019-09-08 00:00:00.000, value: 12346973724.0, xAxis: 2019-09-09 00:00:00.000, value: 12346973724.0]
so pity ,can anyone help me
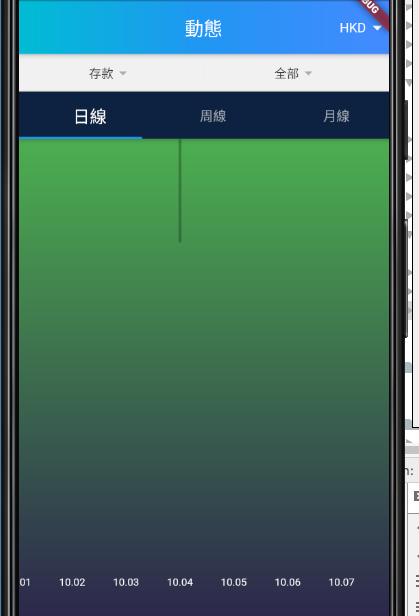
When all chart data values are 0, no line is rendered and an exception is thrown.
Added the logs
09:30:20.568 7 info flutter.tools I/flutter ( 4676): ══╡ EXCEPTION CAUGHT BY RENDERING LIBRARY ╞═════════════════════════════════════════════════════════
09:30:20.568 8 info flutter.tools I/flutter ( 4676): The following assertion was thrown during paint():
09:30:20.568 9 info flutter.tools I/flutter ( 4676): Offset argument contained a NaN value.
09:30:20.569 10 info flutter.tools I/flutter ( 4676): 'dart:ui/painting.dart':
09:30:20.569 11 info flutter.tools I/flutter ( 4676): Failed assertion: line 38: '<optimized out>'
09:30:20.569 12 info flutter.tools I/flutter ( 4676):
09:30:20.569 13 info flutter.tools I/flutter ( 4676): Either the assertion indicates an error in the framework itself, or we should provide substantially
09:30:20.569 14 info flutter.tools I/flutter ( 4676): more information in this error message to help you determine and fix the underlying cause.
09:30:20.569 15 info flutter.tools I/flutter ( 4676): In either case, please report this assertion by filing a bug on GitHub:
09:30:20.569 16 info flutter.tools I/flutter ( 4676):   https://github.com/flutter/flutter/issues/new?template=BUG.md
09:30:20.569 17 info flutter.tools I/flutter ( 4676):
09:30:20.569 18 info flutter.tools I/flutter ( 4676): When the exception was thrown, this was the stack:
09:30:20.569 19 info flutter.tools I/flutter ( 4676): #2      _offsetIsValid (dart:ui/painting.dart:38:10)
09:30:20.569 20 info flutter.tools I/flutter ( 4676): #3      _encodePointList (dart:ui/painting.dart:2672:12)
09:30:20.569 21 info flutter.tools I/flutter ( 4676): #4      Canvas.drawPoints (dart:ui/painting.dart:3587:63)
09:30:20.569 22 info flutter.tools I/flutter ( 4676): #5      _BezierChartPainter.paint._drawBezierLinePath (package:bezier_chart/src/bezier_chart_widget.dart:1078:16)
09:30:20.569 23 info flutter.tools I/flutter ( 4676): #6      _BezierChartPainter.paint (package:bezier_chart/src/bezier_chart_widget.dart:1098:26)
09:30:20.569 24 info flutter.tools I/flutter ( 4676): #7      RenderCustomPaint._paintWithPainter (package:flutter/src/rendering/custom_paint.dart:528:13)
09:30:20.569 25 info flutter.tools I/flutter ( 4676): #8      RenderCustomPaint.paint (package:flutter/src/rendering/custom_paint.dart:566:7)
09:30:20.569 26 info flutter.tools I/flutter ( 4676): #9      RenderObject._paintWithContext (package:flutter/src/rendering/object.dart:2089:7)
09:30:20.569 27 info flutter.tools I/flutter ( 4676): #10     PaintingContext.paintChild (package:flutter/src/rendering/object.dart:172:13)
09:30:20.569 28 info flutter.tools I/flutter ( 4676): #11     RenderShiftedBox.paint (package:flutter/src/rendering/shifted_box.dart:70:15)
09:30:20.569 29 info flutter.tools I/flutter ( 4676): #12     RenderObject._paintWithContext (package:flutter/src/rendering/object.dart:2089:7)
09:30:20.569 30 info flutter.tools I/flutter ( 4676): #13     PaintingContext.paintChild (package:flutter/src/rendering/object.dart:172:13)
09:30:20.569 31 info flutter.tools I/flutter ( 4676): #14     RenderShiftedBox.paint (package:flutter/src/rendering/shifted_box.dart:70:15)
09:30:20.569 32 info flutter.tools I/flutter ( 4676): #15     RenderObject._paintWithContext (package:flutter/src/rendering/object.dart:2089:7)
09:30:20.569 33 info flutter.tools I/flutter ( 4676): #16     PaintingContext.paintChild (package:flutter/src/rendering/object.dart:172:13)
09:30:20.569 34 info flutter.tools I/flutter ( 4676): #17     _RenderSingleChildViewport.paint.paintContents (package:bezier_chart/src/my_single_child_scroll_view.dart:338:17)
09:30:20.569 35 info flutter.tools I/flutter ( 4676): #18     PaintingContext.pushLayer (package:flutter/src/rendering/object.dart:369:12)
09:30:20.569 36 info flutter.tools I/flutter ( 4676): #19     PaintingContext.pushClipRect (package:flutter/src/rendering/object.dart:393:7)
09:30:20.569 37 info flutter.tools I/flutter ( 4676): #20     _RenderSingleChildViewport.paint (package:bezier_chart/src/my_single_child_scroll_view.dart:344:17)
09:30:20.569 38 info flutter.tools I/flutter ( 4676): #21     RenderObject._paintWithContext (package:flutter/src/rendering/object.dart:2089:7)
09:30:20.569 39 info flutter.tools I/flutter ( 4676): #22     PaintingContext._repaintCompositedChild (package:flutter/src/rendering/object.dart:127:11)
09:30:20.569 40 info flutter.tools I/flutter ( 4676): #23     PaintingContext.repaintCompositedChild (package:flutter/src/rendering/object.dart:95:5)
09:30:20.569 41 info flutter.tools I/flutter ( 4676): #24     PipelineOwner.flushPaint (package:flutter/src/rendering/object.dart:858:29)
09:30:20.569 42 info flutter.tools I/flutter ( 4676): #25     _WidgetsFlutterBinding&BindingBase&GestureBinding&ServicesBinding&SchedulerBinding&PaintingBinding&SemanticsBinding&RendererBinding.drawFrame (package:flutter/src/rendering/binding.dart:348:19)
09:30:20.569 43 info flutter.tools I/flutter ( 4676): #26     _WidgetsFlutterBinding&BindingBase&GestureBinding&ServicesBinding&SchedulerBinding&PaintingBinding&SemanticsBinding&RendererBinding&WidgetsBinding.drawFrame (package:flutter/src/widgets/binding.dart:701:13)
09:30:20.569 44 info flutter.tools I/flutter ( 4676): #27     _WidgetsFlutterBinding&BindingBase&GestureBinding&ServicesBinding&SchedulerBinding&PaintingBinding&SemanticsBinding&RendererBinding._handlePersistentFrameCallback (package:flutter/src/rendering/binding.dart:285:5)
09:30:20.569 45 info flutter.tools I/flutter ( 4676): #28     _WidgetsFlutterBinding&BindingBase&GestureBinding&ServicesBinding&SchedulerBinding._invokeFrameCallback (package:flutter/src/scheduler/binding.dart:1016:15)
09:30:20.569 46 info flutter.tools I/flutter ( 4676): #29     _WidgetsFlutterBinding&BindingBase&GestureBinding&ServicesBinding&SchedulerBinding.handleDrawFrame (package:flutter/src/scheduler/binding.dart:958:9)
09:30:20.569 47 info flutter.tools I/flutter ( 4676): #30     _WidgetsFlutterBinding&BindingBase&GestureBinding&ServicesBinding&SchedulerBinding.scheduleWarmUpFrame.<anonymous closure> (package:flutter/src/scheduler/binding.dart:784:7)
09:30:20.570 48 info flutter.tools I/flutter ( 4676): #32     _Timer._runTimers (dart:isolate-patch/timer_impl.dart:382:19)
09:30:20.570 49 info flutter.tools I/flutter ( 4676): #33     _Timer._handleMessage (dart:isolate-patch/timer_impl.dart:416:5)
09:30:20.570 50 info flutter.tools I/flutter ( 4676): #34     _RawReceivePortImpl._handleMessage (dart:isolate-patch/isolate_patch.dart:172:12)
09:30:20.570 51 info flutter.tools I/flutter ( 4676): (elided 3 frames from class _AssertionError and package dart:async-patch)
09:30:20.570 52 info flutter.tools I/flutter ( 4676):
09:30:20.570 53 info flutter.tools I/flutter ( 4676): The following RenderObject was being processed when the exception was fired: RenderCustomPaint#db479 relayoutBoundary=up18:
09:30:20.570 54 info flutter.tools I/flutter ( 4676):   creator: CustomPaint ← Align ← Padding ← _SingleChildViewport ← IgnorePointer-[GlobalKey#f9c54] ←
09:30:20.570 55 info flutter.tools I/flutter ( 4676):     Semantics ← Listener ← _GestureSemantics ←
09:30:20.570 56 info flutter.tools I/flutter ( 4676):     RawGestureDetector-[LabeledGlobalKey<RawGestureDetectorState>#570bb] ← Listener ← _ScrollableScope
09:30:20.570 57 info flutter.tools I/flutter ( 4676):     ← _ScrollSemantics-[GlobalKey#db183] ← ⋯
09:30:20.570 58 info flutter.tools I/flutter ( 4676):   parentData: offset=Offset(0.0, 48.3) (can use size)
09:30:20.570 59 info flutter.tools I/flutter ( 4676):   constraints: BoxConstraints(0.0<=w<=Infinity, 0.0<=h<=284.0)
09:30:20.570 60 info flutter.tools I/flutter ( 4676):   size: Size(1166.2, 227.2)
09:30:20.570 61 info flutter.tools I/flutter ( 4676): This RenderObject has no descendants.

If I add stepsYAxis: 3000 , the chart will go like this :

And it will crashed , error information:
flutter: ══╡ EXCEPTION CAUGHT BY WIDGETS LIBRARY ╞═══════════════════════════════════════════════════════════
flutter: The following assertion was thrown building Positioned(left: 10.0, bottom: 344.1):
flutter: Multiple widgets used the same GlobalKey.
flutter: The key [GlobalKey#b3844] was used by multiple widgets. The parents of those widgets were:
flutter: - Positioned(left: 10.0, bottom: 244.8)
flutter: - Positioned(left: 10.0, bottom: 344.1)
flutter: A GlobalKey can only be specified on one widget at a time in the widget tree.
flutter:
flutter: When the exception was thrown, this was the stack:
Chart config :
BezierChartConfig(
                                // startYAxisFromNonZeroValue: false,
                                footerHeight: 40,
                                bubbleIndicatorColor:
                                    Colors.white.withOpacity(0.9),
                                verticalIndicatorStrokeWidth: 3.0,
                                verticalIndicatorColor: Colors.black26,
                                showVerticalIndicator: true,
                                verticalIndicatorFixedPosition: false,
                                showDataPoints: false,
                                // stepsYAxis: this.ySteps * 2,
                                stepsYAxis: 3000,
                                displayYAxis: true,
                                yAxisTextStyle: TextStyle(
                                    fontSize: 12, color: Colors.white),
                              )
Hey there,
For some reason I can't seem to get the X axis or popup bubble text to show. I am not sure what I am missing?
Here is the code I am using for the chart at the moment. I tried adjusting all the options I could find in examples to test out, but I still end up with what you see in the image below. Any suggestions?
Thanks,
-MH
import 'package:bezier_chart/bezier_chart.dart';
import 'package:flutter/material.dart';
import 'package:project/animations/animate_details.dart';

class LineChart3 extends StatefulWidget {
  LineChart3(DetailsAnimation animation) : _controller = animation;
  final DetailsAnimation _controller;

  @override
  _LineChart3State createState() => _LineChart3State();
}

class _LineChart3State extends State<LineChart3> {
  @override
  Widget build(BuildContext context) {
    return Container(
      child: Column(
        mainAxisAlignment: MainAxisAlignment.center,
        children: [
          Text(
            "7 day statistics",
            style: TextStyle(
              color: Colors.white,
              fontSize: 18,
              fontWeight: FontWeight.w700,
            ),
          ),
          _buildChart(
            BezierChartScale.HOURLY,
            context,
            LinearGradient(
              colors: [
                Color(0x00303030),
                Color(0x22000000),
                Color(0x44000000),
              ],
              begin: Alignment.topCenter,
              end: Alignment.bottomCenter,
            ),
          ),
        ],
      ),
    );
  }

  _buildChart(
      BezierChartScale scale, BuildContext context, LinearGradient gradient) {
    return Center(
      child: Card(
        elevation: widget._controller.chartHeight.value,
        //margin: EdgeInsets.all(10.0),
        child: Container(
          color: Color(0x22303030),
          height: MediaQuery.of(context).size.height * 0.3,
          width: MediaQuery.of(context).size.width,
          child: BezierChart(
            bezierChartScale: BezierChartScale.CUSTOM,
            xAxisCustomValues: const [0, 5, 10, 15, 20, 25, 30],
            footerValueBuilder: (double value) {
              return "${formatAsIntOrDouble(value)}";
            },
            series: [
              BezierLine(
                label: "Test1",
                data: [
                  DataPoint<double>(value: 10, xAxis: 0),
                  DataPoint<double>(value: 50, xAxis: 5),
                  DataPoint<double>(value: 100, xAxis: 10),
                  DataPoint<double>(value: 100, xAxis: 15),
                  DataPoint<double>(value: 40, xAxis: 20),
                  DataPoint<double>(value: 47, xAxis: 25),
                  DataPoint<double>(value: 47, xAxis: 30),
                ],
              ),
              BezierLine(
                label: "Test2",
                lineColor: Colors.blue,
                data: [
                  DataPoint<double>(value: 20, xAxis: 0),
                  DataPoint<double>(value: 25, xAxis: 5),
                  DataPoint<double>(value: 75, xAxis: 10),
                  DataPoint<double>(value: 80, xAxis: 15),
                  DataPoint<double>(value: 20, xAxis: 20),
                  DataPoint<double>(value: 60, xAxis: 25),
                  DataPoint<double>(value: 47, xAxis: 30),
                ],
              ),
            ],
            config: BezierChartConfig(
              displayYAxis: true,
              displayLinesXAxis: true,
              startYAxisFromNonZeroValue: true,
              showDataPoints: true,
              stepsYAxis: 10,
              bubbleIndicatorColor: Colors.white.withOpacity(0.9),
              footerHeight: 30.0,
              xAxisTextStyle: TextStyle(
                color: Colors.white60,
                fontSize: 19,
              ),
              verticalIndicatorStrokeWidth: 3.0,
              verticalIndicatorColor: Colors.black45,
              showVerticalIndicator: true,
              verticalIndicatorFixedPosition: false,
              backgroundGradient: gradient,
              snap: false,
            ),
          ),
        ),
      ),
    );
  }
}
Hi, great package. Would it be possible to add more time scale options: daily, hourly and minutely please?
Hi there,
Is it possible to switch physics in ScrollView into BouncingScrollPhysics()?
How I'm can add a title to my chart?
Amazing looking graphs!
However I encountered the following errors when I copied the example:
Compiler message:
lib/StatsPage.dart:48:29: Error: Getter not found: 'BezierLineChartScale'.
      bezierLineChartScale: BezierLineChartScale.CUSTOM,
                            ^^^^^^^^^^^^^^^^^^^^
lib/StatsPage.dart:64:15: Error: Method not found: 'BezierLineChartConfig'.
      config: BezierLineChartConfig(
              ^^^^^^^^^^^^^^^^^^^^^
lib/StatsPage.dart:47:12: Error: Method not found: 'BezierLineChart'.
    return BezierLineChart(
           ^^^^^^^^^^^^^^^
lib/StatsPage.dart:47:12: Error: The method 'BezierLineChart' isn't defined for the class 'SimpleLineChart'.
 - 'SimpleLineChart' is from 'package:kakisg/StatsPage.dart' ('lib/StatsPage.dart').
Try correcting the name to the name of an existing method, or defining a method named 'BezierLineChart'.
    return BezierLineChart(
           ^^^^^^^^^^^^^^^
Here's my Flutter doctor
Doctor summary (to see all details, run flutter doctor -v):
[✓] Flutter (Channel stable, v1.7.8+hotfix.3, on Mac OS X 10.14.5 18F132, locale
    en-SG)

[✓] Android toolchain - develop for Android devices (Android SDK version 28.0.3)
[✓] Xcode - develop for iOS and macOS (Xcode 10.2.1)
[✓] iOS tools - develop for iOS devices
[✓] Android Studio (version 3.4)
[✓] Connected device (1 available)

• No issues found!
and my pubspec
bezier_chart: ^1.0.12
Hi there
Let's, have the following series:
        data: [
          DataPoint<DateTime>(value: 10, xAxis: date1),
          DataPoint<DateTime>(value: 50, xAxis: date2),
        ],
where date1 and date2 are within the same month. Then, if I switch to BezierChartScale.MONTHLY scale, for the specific month, I will see yAxis = 60, which essentially is the sum of the two values.
This works fine, in case y values meaning make sense to be summed up e.g. they are prices.
In my case however, each y value is measured weight for a specific day. Hence I would like for instance to have average value of all weights for the month, when switch to MONTHLY scale.
Is that possible and if not, can you direct me to the source lines, when this calculation takes place?
Thanks!
The problem is that when I start to scroll the chart, the Y axis labels are overlaying the chart line, making it hard to read the labels.
Problem:

How it should look:

I have been playing around with trying to have a desktop feature in which when you mouse over the indicator will automatically pop up and follow the mouse without having to click and hold. I added a bool called mouseHover = false by default. I almost have it working, but its behavior is quite peculiar, as you can see in the link below.
In this gif I am not clicking the mouse at all, the bubble keeps going up and down on its own, I am simply moving the mouse with snap off. At first when I mouseover, it goes at probably 20 times a second quickly than repeats slowly
https://i.imgur.com/1bLcMuc.gifv
I am not quite sure what needs to be changed. This is my first project trying to learn Dart/Flutter, I only started using them a week or two so ago, so I feel I just don't have the experience yet to narrow it down. Any input on it would be greatly appreciated.
Thanks,
-MH
:671   child: Listener(
        onPointerHover: (_displayIndicator && widget.config.mouseHover)
            ? (PointerHoverEvent details) =>
                _refreshPosition(LongPressMoveUpdateDetails(
                  globalPosition: details.localPosition,
                  offsetFromOrigin: Offset.zero,
                ))
            : null,
        onPointerEnter: (!_displayIndicator && widget.config.mouseHover)
            ? (PointerEnterEvent details) =>
                _onDisplayIndicator(LongPressStartDetails(
                  globalPosition: details.localPosition,
                ))
            : null,
This problem was only mentioned in #4 , but it was not the main problem of the issue.
Problem:

Desired output:
It would be nice to show only a number of labels choosed by the user.
Example:

When using my DateTime data for xAxisand bezierChartScale: BezierChartScale.CUSTOM, I get an error (accepts only doubles):
lib/ui/common/logchart.dart:141:40: Error: The argument type 'List' can't be assigned to the parameter type 'List'
How can i have my filters (querys) to scale ?
many thanks
Hi there!
I'm starting to work with your library and I'm trying to make a time series graph. In my screenshot below you can see your sample (found here) and then my attempt.
I'm trying to keep my entire graph on the screen and not have to scroll to see the whole graph, you were able to achieve this in your sample.
Is there a way to do this using DateTime? In your sample you use a BezierChartScale.CUSTOM, is that how you achieve this?

Here is your sample:
                    Container(
                        height: MediaQuery.of(context).size.height / 2,
                        width: MediaQuery.of(context).size.width * 0.9,
                        child: BezierChart(
                          bezierChartScale: BezierChartScale.CUSTOM,
                          xAxisCustomValues: const [0, 5, 10, 15, 20, 25, 30],
                          footerValueBuilder: (double value) {
                            return "$value\ndays";
                          },
                          series: const [
                            BezierLine(
                              label: "m",
                              data: const [
                                DataPoint<double>(value: 01, xAxis: 0),
                                DataPoint<double>(value: 130, xAxis: 5),
                                DataPoint<double>(value: 50, xAxis: 10),
                                DataPoint<double>(value: 150, xAxis: 15),
                                DataPoint<double>(value: 75, xAxis: 20),
                                DataPoint<double>(value: 0, xAxis: 25),
                                DataPoint<double>(value: 5, xAxis: 30),
                              ],
                            ),
                          ],
                          config: BezierChartConfig(
                            footerHeight: 40,
                            verticalIndicatorStrokeWidth: 3.0,
                            verticalIndicatorColor: Colors.black26,
                            showVerticalIndicator: true,
                            verticalIndicatorFixedPosition: false,
                            backgroundGradient: LinearGradient(
                              colors: [
                                Colors.red[300],
                                Colors.red[400],
                                Colors.red[400],
                                Colors.red[500],
                                Colors.red,
                              ],
                              begin: Alignment.topCenter,
                              end: Alignment.bottomCenter,
                            ),
                            snap: false,
                          ),
                        ),
                      ),
And here is mine. I'm trying to graph an entire month and my y values can range from -1.0 to 1.0.
                      Container(
                        color: Colors.red,
                        height: MediaQuery.of(context).size.height / 2,
                        width: MediaQuery.of(context).size.width * 0.9,
                        child: BezierChart(
                          fromDate: _getStartDate(state),
                          bezierChartScale: BezierChartScale.WEEKLY,
                          toDate: _getLastDate(state),
                          series: [
                            BezierLine(
                              label: "Duty",
                              onMissingValue: (dateTime) {
                                return 0.0;
                              },
                              data: [
                                DataPoint<DateTime>(
                                    value: 0.5, xAxis: DateTime.now()),
                                DataPoint<DateTime>(
                                    value: -0.1,
                                    xAxis: DateTime.now()
                                        .subtract(Duration(days: 1))),
                                DataPoint<DateTime>(
                                    value: -0.4,
                                    xAxis: DateTime.now()
                                        .subtract(Duration(days: 2))),
                              ],
                            ),
                          ],
                          config: BezierChartConfig(
                            footerHeight: 40,
                            verticalIndicatorStrokeWidth: 3.0,
                            verticalIndicatorColor: Colors.black26,
                            showVerticalIndicator: true,
                            verticalIndicatorFixedPosition: false,
                            backgroundGradient: LinearGradient(
                              colors: [
                                Colors.red[300],
                                Colors.red[400],
                                Colors.red[400],
                                Colors.red[500],
                                Colors.red,
                              ],
                              begin: Alignment.topCenter,
                              end: Alignment.bottomCenter,
                            ),
                            snap: false,
                          ),
                        ),
                      ),
My solution also pinches and zooms despite adding the pinchZoom: false to my BezierChartConfig. Your sample does not zoom when pinched and you didn't have to use pinchZoom. Is this also due to the custom BezierChartScale?
Thank you!
I would like to know when some point was selected and determine data of that point. Maybe you could add callback to BezierChartConfig?
A declarative, efficient, and flexible JavaScript library for building user interfaces.
🖖 Vue.js is a progressive, incrementally-adoptable JavaScript framework for building UI on the web.
TypeScript is a superset of JavaScript that compiles to clean JavaScript output.
An Open Source Machine Learning Framework for Everyone
The Web framework for perfectionists with deadlines.
A PHP framework for web artisans
Bring data to life with SVG, Canvas and HTML. 📊📈🎉
JavaScript (JS) is a lightweight interpreted programming language with first-class functions.
Some thing interesting about web. New door for the world.
A server is a program made to process requests and deliver data to clients.
Machine learning is a way of modeling and interpreting data that allows a piece of software to respond intelligently.
Some thing interesting about visualization, use data art
Some thing interesting about game, make everyone happy.
We are working to build community through open source technology. NB: members must have two-factor auth.
Open source projects and samples from Microsoft.
Google ❤️ Open Source for everyone.
Alibaba Open Source for everyone
Data-Driven Documents codes.
China tencent open source team.
