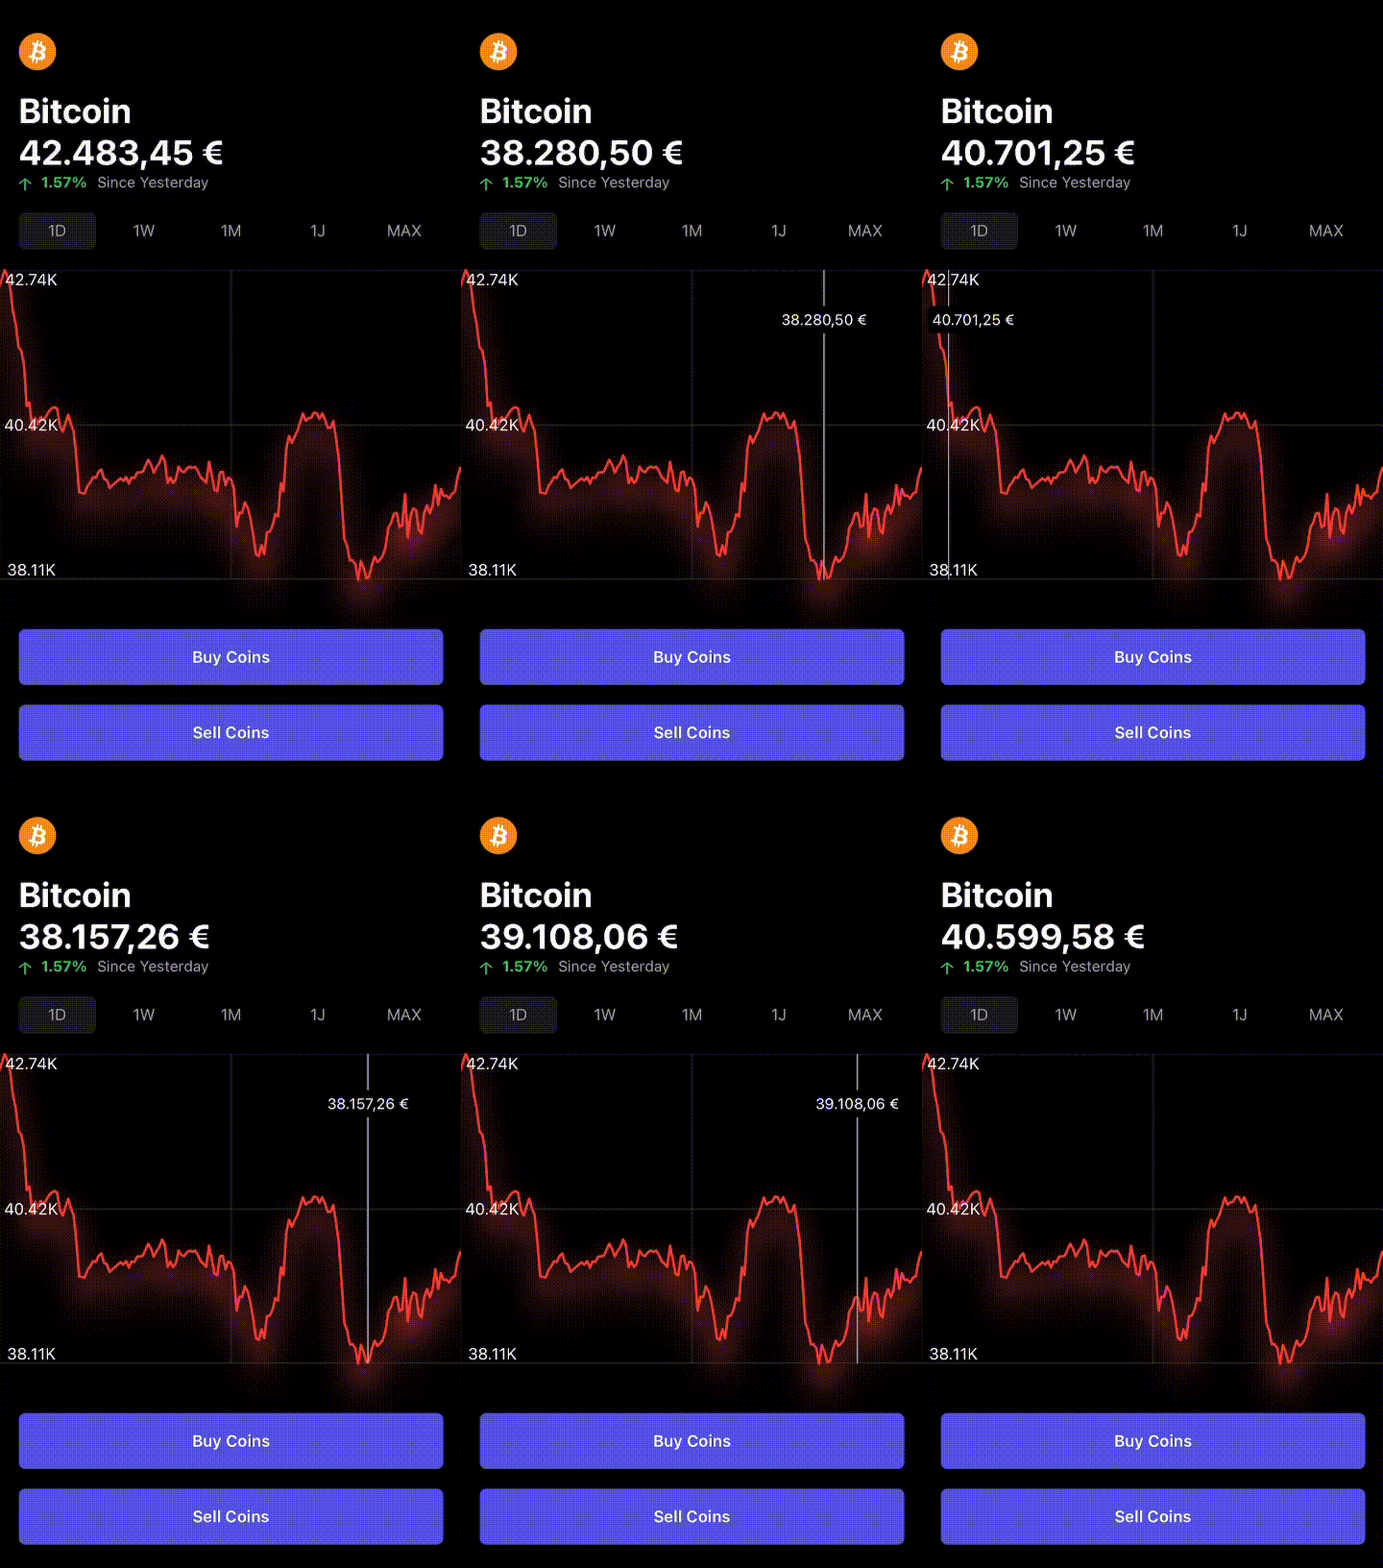
Create amazing Crypto and Stock charts 📈📉
Looking for an easy to use and fully customizable charting solution written in SwiftUI? Then check out CheesyChart – it’s a Swift Package that makes it simple to create beautiful charts in your own projects. With just a few lines of code, you can create prefect line charts. And if you need to display the current value of the chart, there’s an interactive label for that too. 😩
Since the latest update, you can use CheesyChart not only for stocks!
So whether you want to create a simple chart or a more complex one, CheesyChart has you covered!
CheesyChart requires iOS 14 and Xcode 12.
1️⃣ In Xcode go to File ➤ Add Packages...
2️⃣ In the top right corner, paste https://github.com/adri567/CheesyChart.git 🧀 and press Enter.
3️⃣ Choose CheesyChart from the list ➤ Add Package
This was easy, or? Now you can use CheesyChart in your project! 📈📉
Copy this code ⬇️
import CheesyChart/// You need a @State var if you want to use the tapPoint to show the current price of the stock or coin in a extra TextView
@State var value: Int? = 0
let setup = SetupChart(
name: (stock or coin name),
data: (price data),
image: UIImage(named: "Image"),
chartHeight: 250,
animateChart: true,
chartBackground: .cb5,
chartBackgroundColor: Color(UIColor.systemGroupedBackground).opacity(0.3),
showYAxiesStats: true,
yAxiesStatsColor: .black,
showShadow1: true,
showShadow2: true,
chartPriceLabelColor: Color(UIColor.systemGroupedBackground).opacity(0.3),
chartPriceLabelFontColor: .black
)
CheesyChart(setup: setup, tapPoint: $value)let setup = SetupChart(
data: data,
animateChart: true,
startAnimationAfterAppear: 0.2,
chartBackground: .cb2,
chartBackgroundColor: Color.theme.background,
showYAxiesStats: true,
yAxiesStatsColor: Color.theme.accent,
showShadow1: true,
showShadow2: true,
showShadow3: true,
showShadow4: true,
chartPriceLabelColor: Color.theme.background,
chartPriceLabelFontColor: Color.theme.accent,
chartPriceLabelShadow: Color.theme.accent
)
CheesyChart(setup: setup)name: String = "" // Name of the coin or stock
data: [Double] = [] // Price data
currencyIdentifier: String = "en_US" // Default is USD. For more information: https://developer.apple.com/library/archive/documentation/MacOSX/Conceptual/BPInternational/LanguageandLocaleIDs/LanguageandLocaleIDs.html
forCurrency: Bool = true // Default is set to a currency chart
label: String = "" // Is forCurrency = false, you can use your own ending
image: UIImage? = UIImage(systemName: "bitcoinsign.circle.fill") // Standart image if image is shown
showChartHeader: Bool = false // Default chart header
chartHeaderFontColor: Color = .black // Font color of the chart
chartHeaderColor: Color = .clear // Whole color of the chart
showHeaderImage: Bool = false // Show header image
chartWidth: Double = UIScreen.main.bounds.width // Width of the chart
chartHeight: Double = 200 // Height of the chart
animateChart: Bool = false // Line animation (from 0 to 1)
startAnimationAfterAppeariance: CGFloat = 0.1 // Animation after the appearance of the chart
chartAnimationDuration: CGFloat = 1.0 // Duration of the animation
chartBackground: Background = .none // Chart backgrounds (choose between .none, .cb1, .cb2, .cb3, .cb4, .cb5)
chartBackgroundColor: Color = .white // Whole background color of the chart
chartBackgroundDividerColor: Color = Color(UIColor.lightGray).opacity(0.2) // X axies divider color
showYAxiesStats: Bool = false // Price stats on the left across the y axies
yAxiesStatsColor: Color = .black // Color of the stats
yAxiesStatsAlignment: YAxiesAlignment = .leading // Position of the y axies stats
chartLineColorOnHigh: Color = .green // Chart color if the price goes up
chartLineColorOnLow: Color = .red // Chart color if the price goes down
chartLineWidth: CGFloat = 2 // Width of the chart line
showShadow1: Bool = false // Shadow 1 of the line
showShadow2: Bool = false // Shadow 2 of the line
showShadow3: Bool = false // Shadow 3 of the line
showShadow4: Bool = false // Shadow 4 of the line
chartPriceLabelColor: Color = .clear // Color of the drag price label
chartPriceLabelFontColor: Color = .black // Font color of the drag price label
chartPriceIndicatorColor: Color = Color(UIColor.lightGray) // Color of the price y axies indicator
chartPriceLabelYAxies: CGFloat = 40.0 // Position of the price label on the y axies
chartPriceLabelCornerRadius: CGFloat = 5 // Corner radius of the price label
chartPriceLabelShadow: Color = .clear // Shadow of the price label


