Coder Social home page Coder Social logo

adamouization / corona-virus-insights-dashboard Goto Github PK

View Code? Open in Web Editor NEW
2.0 3.0 1.0 4.32 MB

Coronavirus dashboard visualisations entirely designed in D3.JS

Home Page: https://corona-virus-insights.fly.dev/

License: MIT License

HTML 2.48% JavaScript 21.13% CSS 17.15% Less 28.21% SCSS 31.03%
coronavirus coronavirus-tracking coronavirus-analysis covid-19 covid19 covid19-data nodejs d3js d3 d3-visualization d3v5

corona-virus-insights-dashboard's Introduction

Coronavirus Insights Dashboard HitCount GitHub license GitHub language count GitHub top language

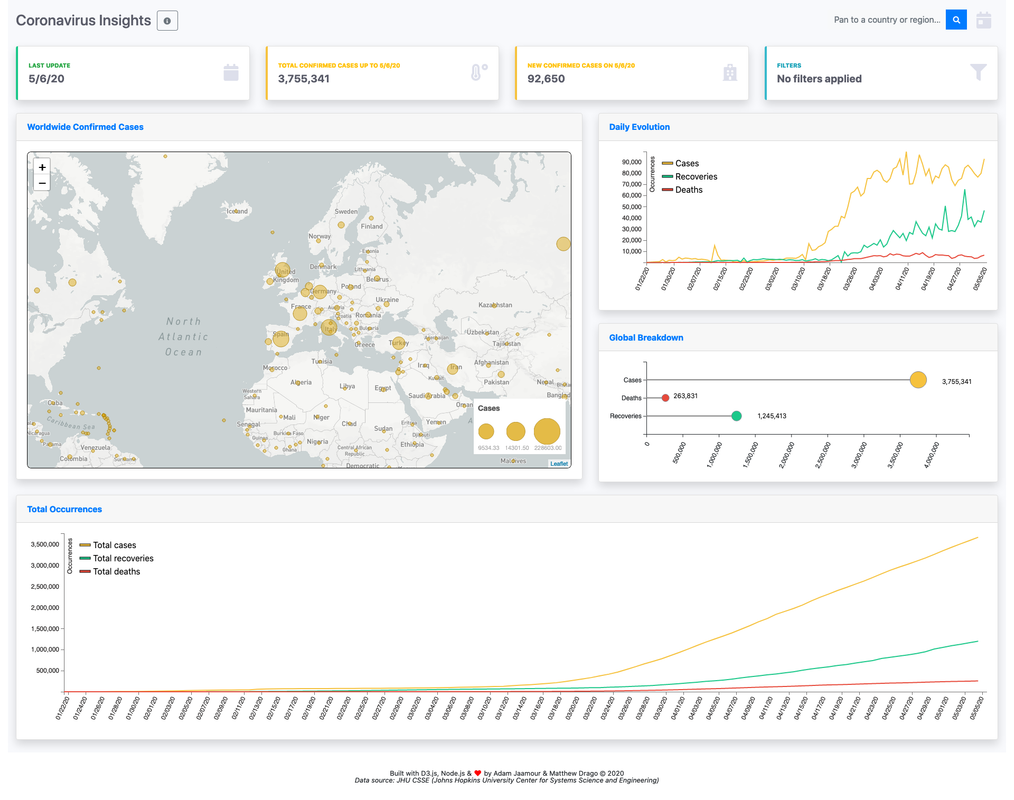
This website aims to provide insights into the 2019 Novel Coronavirus COVID-19 by visualising the Johns Hopkins University Centre for Systems Science and Engineering through the D3.js library. It was developed in the context of a practical for our Information Visualisation module, requiring us to visualise any dataset in D3.JS.

You can visit the website here: corona-virus-insights.fly.dev

Screenshots

screenshot

Usage

Clone the project, cd into the directory and run the following command:

npm install && npm start

Visit the local web app on the chosen port (3000 by default) at http://127.0.0.1:3000/

License

corona-virus-insights-dashboard's People

Contributors

adamouization avatar mdrago98 avatar

Stargazers

 avatar

Watchers

 avatar  avatar  avatar

Forkers

alinapia

corona-virus-insights-dashboard's Issues

Quick lollipop chart improvements

  • Make circles bigger (Malak recommendation)
  • Rename "total" to "cases". Total can be misleading.
  • Add a small label indicating the number (will also diminish unused white space in the chart - Malak recommendation)
  • Uppercase the y-axis labels

Layout & Theme

Organise the different visualisations layout and add a theme.

Map view

Create a basic extendible map of the world

Final polishing

  • Change the colour of the total number of confirmed cases card
  • Create new icon for date filter (place it next to country filter)
  • Add open-ended question to the modal
  • Download a local version of the 4 CSV files (in case they are removed online)
  • Rename Confirmed cases today card to Confirmed cases on XX/XX/XX
  • Increase margin in total line chart
  • Fix search bar reloading the page when enter is clicked
  • Fix map legend size (see screenshot below) - option is to remove the decimals to take up less space
  • Add tooltips in the line charts
  • Fix date bug

image

Chart automatic scaling

For now, widths for the SVG elements holding the charts are hardcoded: tried to dynamically adapt to screen size by using document.getElementById("id");, but the DOM has not loaded at this point in the node js code.

--> Find an alternative or get document.getElementById("id"); to work.

This will make website fully mobile friendly (Currently, everything is mobile friendly, the cards move accordingly to screen size, but the charts in the cards don't adapt)

Upgrade line chart

  • Add lines for recoveries and for deaths on the same chart

No longer considered: "Add shading under lines to turn it into an Area chart"

Quick map improvements to make

  • Move map-specific functions away from main.js to map.js (getGeoJsonFromCases and standardiseGeoJson functions)
  • In the map tooltip, multiply the "infections per 1000" by 1000 and round to 2 or 3 decimals and add a "per thousand symbol" (like % but with three circles)
  • Remove cases/recoveries/deaths info from the tooltip, the lollipop chart should show this instead.
  • Fix map legend duplication (see image below)

image

Recommend Projects

  • React photo React

    A declarative, efficient, and flexible JavaScript library for building user interfaces.

  • Vue.js photo Vue.js

    ๐Ÿ–– Vue.js is a progressive, incrementally-adoptable JavaScript framework for building UI on the web.

  • Typescript photo Typescript

    TypeScript is a superset of JavaScript that compiles to clean JavaScript output.

  • TensorFlow photo TensorFlow

    An Open Source Machine Learning Framework for Everyone

  • Django photo Django

    The Web framework for perfectionists with deadlines.

  • D3 photo D3

    Bring data to life with SVG, Canvas and HTML. ๐Ÿ“Š๐Ÿ“ˆ๐ŸŽ‰

Recommend Topics

  • javascript

    JavaScript (JS) is a lightweight interpreted programming language with first-class functions.

  • web

    Some thing interesting about web. New door for the world.

  • server

    A server is a program made to process requests and deliver data to clients.

  • Machine learning

    Machine learning is a way of modeling and interpreting data that allows a piece of software to respond intelligently.

  • Game

    Some thing interesting about game, make everyone happy.

Recommend Org

  • Facebook photo Facebook

    We are working to build community through open source technology. NB: members must have two-factor auth.

  • Microsoft photo Microsoft

    Open source projects and samples from Microsoft.

  • Google photo Google

    Google โค๏ธ Open Source for everyone.

  • D3 photo D3

    Data-Driven Documents codes.