- Installation
- Project Motivation
- Project Overview
- Submission
- Results
- Licensing, Authors, and Acknowledgements
You need to be able to work in a Jupyter Notebook on your computer. The following packages (libraries) need to be installed. You can install these packages via conda or pip.
- Pandas
- Matplotlib
- Seaborn
This is an Udacity Nanodegree project.I was interested in using No Show Appointments Data to better understand:
- Are there more no-shows with alcoholism or vice versa?
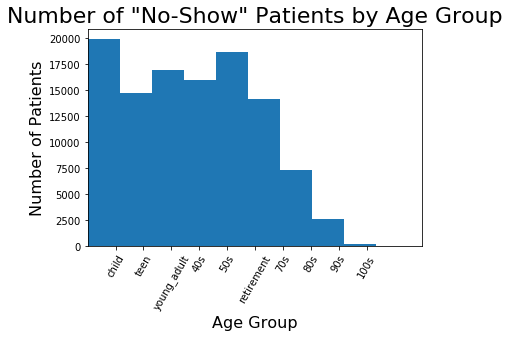
- How many patients were in each age group?
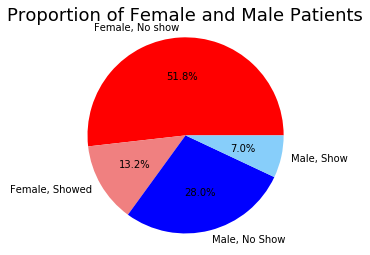
- Does a certain gender influence whether one shows up to appointments or not?
For the final project, you will conduct your own data analysis and create a file to share that documents your findings. You should start by taking a look at your dataset and brainstorming what questions you could answer using it. Then you should use pandas and NumPy to answer the questions you are most interested in, and create a report sharing the answers. You will not be required to use inferential statistics or machine learning to complete this project, but you should make it clear in your communications that your findings are tentative. This project is open-ended in that we are not looking for one right answer.
Click this link (available in a Google doc here) to open a document with links and information about data sets that you can investigate for this project. You must choose one of these datasets to complete the project.
Eventually you’ll want to submit your project (and share it with friends, family, and employers). Get organized before you begin. We recommend creating a single folder that will eventually contain:
- The report communicating your findings
- Any Python code you wrote as part of your analysis
- The data set you used (which you will not need to submit)
Brainstorm some questions you could answer using the data set you chose, then start answering those questions. You can find some questions in the data set options to help you get started.
Try and suggest questions that promote looking at relationships between multiple variables. You should aim to analyze at least one dependent variable and three independent variables in your investigation. Make sure you use NumPy and pandas where they are appropriate!
Once you have finished analyzing the data, create a report that shares the findings you found most interesting. If you use a Jupyter notebook, share your findings alongside the code you used to perform the analysis. Make sure that your report text is contained in Markdown cells to clearly distinguish your comments and findings from your code work. You should also feel free to use other tools and software to craft your final report, but make sure that you can submit your report as an HTML or PDF file so that it can be opened easily.
What to include in your submission
- A PDF or HTML file containing your analysis. This file should include:
- A note specifying which dataset you analyzed
- A statement of the question(s) you posed
- A description of what you did to investigate those questions
- Documentation of any data wrangling you did
- Summary statistics and plots communicating your final results
- Code you used to perform your analysis. If you used a Jupyter notebook, you can submit your .ipynb. Otherwise, you should submit the code separately in .py file(s).
- A list of Web sites, books, forums, blog posts, github repositories, etc. that you referred to or used in creating your submission (add N/A if you did not use any such resources).
- Of the 35422 patients that did receive text messages, 25698 patients did not show up for their appointments and 9784 patients did show up for their appointments. Receiving text messages did not influence patients to show up for their appointments.
- A great number of patients in their childhood, 50s, and retirement age group did not show up to appointments.
Must give credit to Kaggle for the data. You can find the Licensing for the data and other descriptive information at the Udacity Webpage.


