![]()


AAChartKit is an elegant and friendly (user-friendly && enviroment-friendly) chart framework for iOS, based on the open source Highcharts JS libraries. AAChartKit is extremely powerful, easy to configure and a pleasure to use. Currently AAChartKit includes support for the following chart types: column chart, bar chart, area chart, area spline chart, line chart, spline chart, radar chart, polar chart, pie chart, bubble chart, pyramid chart, funnel chart, column range and area range chart. More chart types are planned to be supported. AAChartKit gives you easy and fast access to a wide range of chart types, hassle-free and quick to integrate into your own project.
-
🎂 Environment friendly. Support
iOS、iPadOSandmacOS. Totally supportObjective-Clanguage, and there are more types version such asSwiftlanguage version AAInfographics 、Javalanguage version AAChartCore 、Kotlinlanguage version AAInfographics . To get more details you can see the source code links list. -
🚀 Powerful and easy to use. It supports
column chart,bar chart,area chart,areaspline chart,line chart,spline chart,radar chart,polar chart,pie chart,bubble chart,pyramid chart,funnel chart,columnrange chart,arearange chart,mixed chartand other graphics. Support for more chart types is planned. -
📝 Modern Declarative Syntax. Unlike previous imperative programming techniques, drawing any custom chart in AAChartKit, you don't need to care about the inner implementation details which is annoying && boring. Describe what you want, you will get what you described.
-
🎮 Interactive and animated. The charts
animationeffect is exquisite, delicate, smooth and beautiful. -
⛓ Chain programming. Supports
chain programming syntaxlike Masonry . -
🦋 Minimalist.
AAChartView + AAChartModel = Chart. The AAChartKit follows a minimalist formula: Chart view + Chart model = The chart you want, just like the powerful and beautiful charts lib AAInfographics. -
🖱 Interaction event callback. Support for monitoring user click events and single finger move over events, which can be used to achieve double charts linked-working and even multiple charts linkage, as well as other more complex custom user interaction effects.
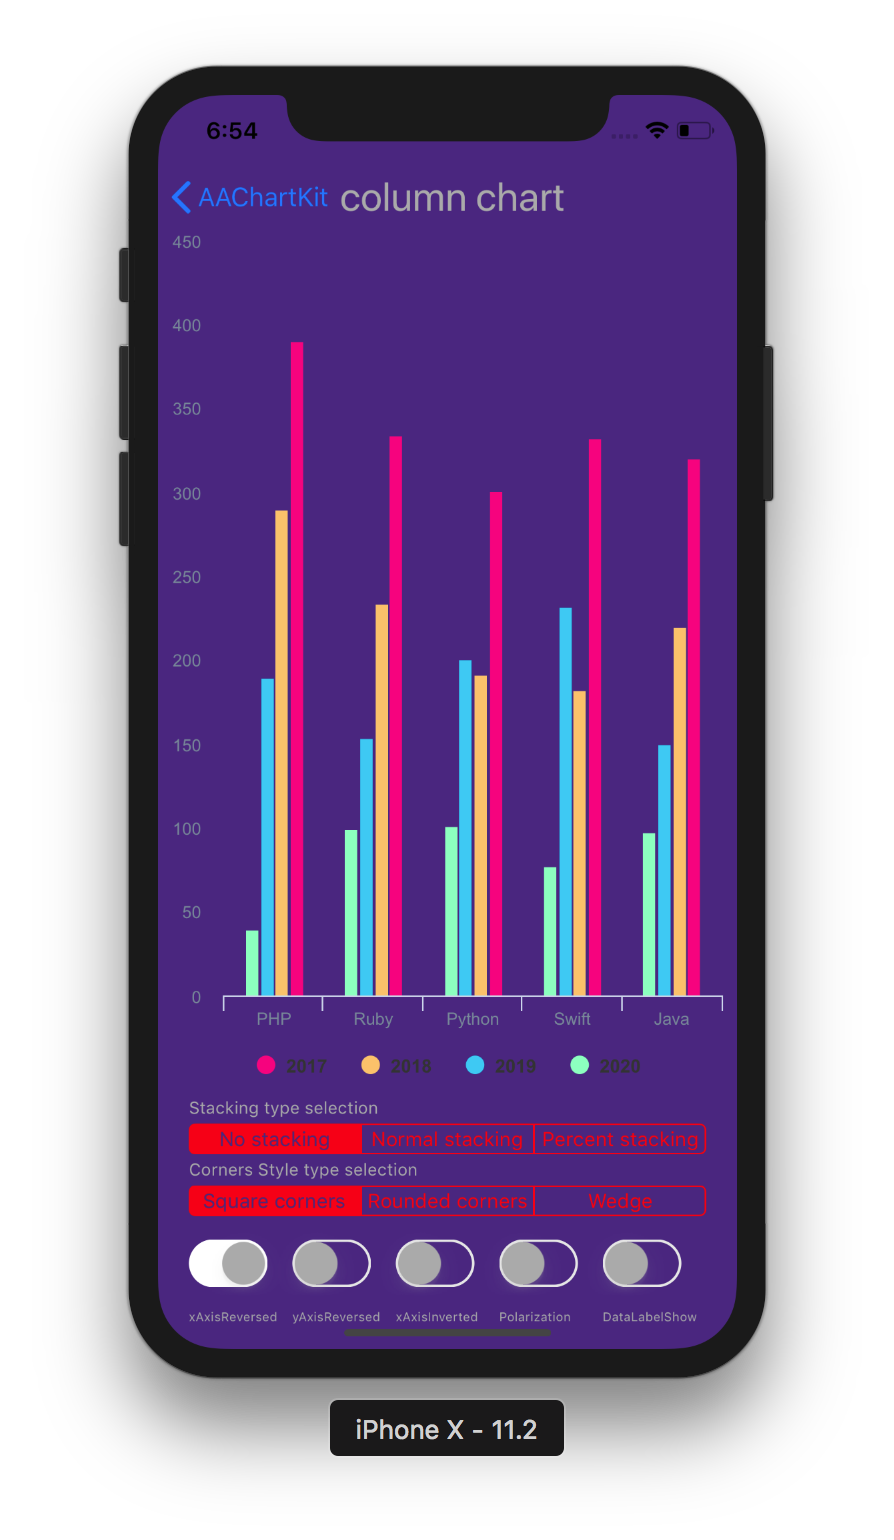
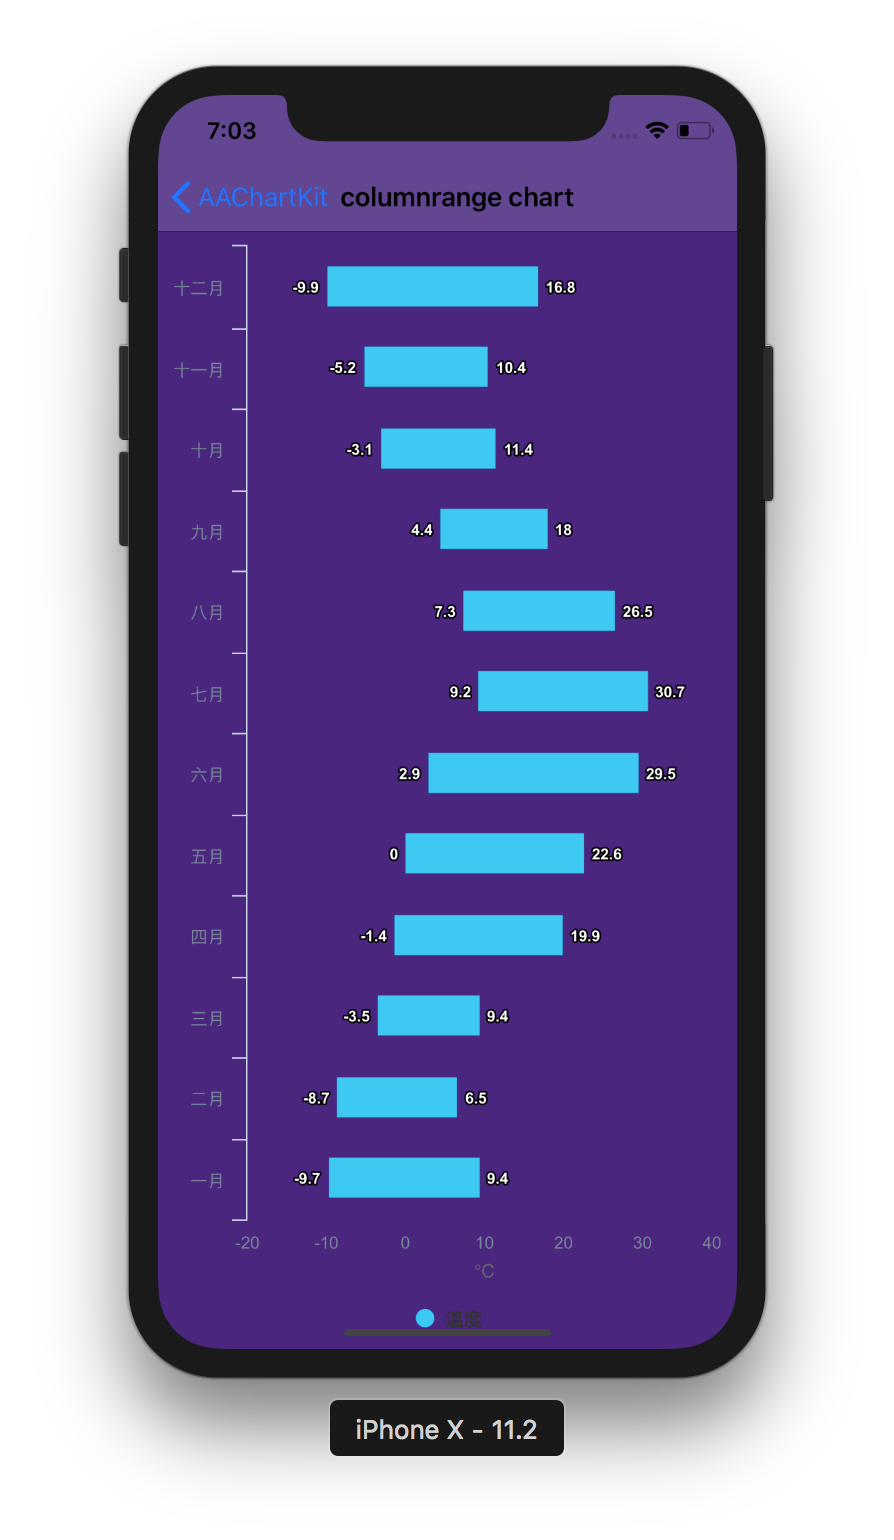
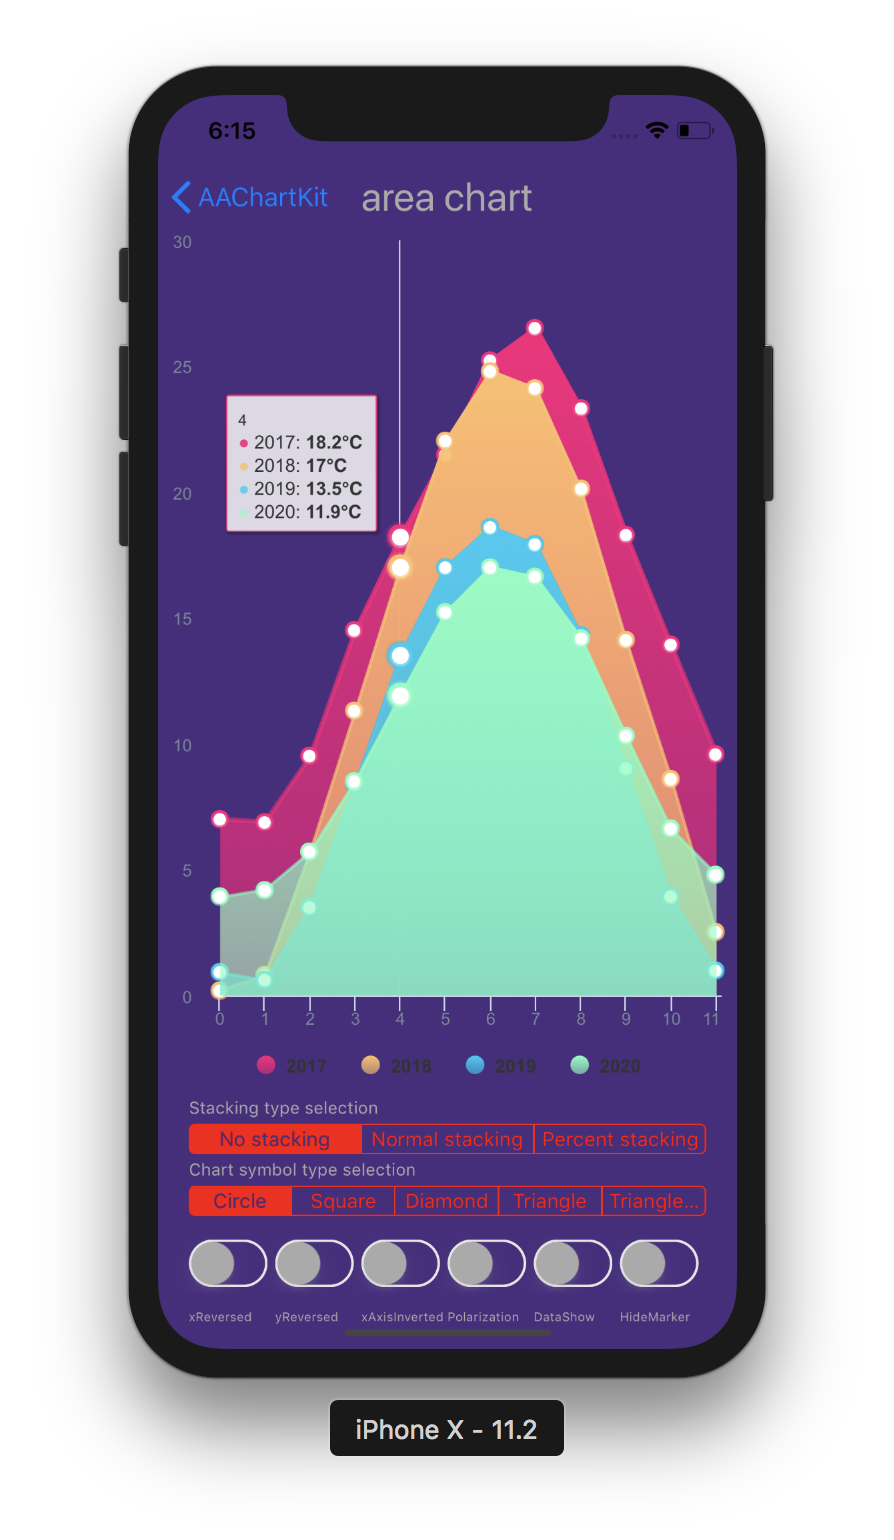
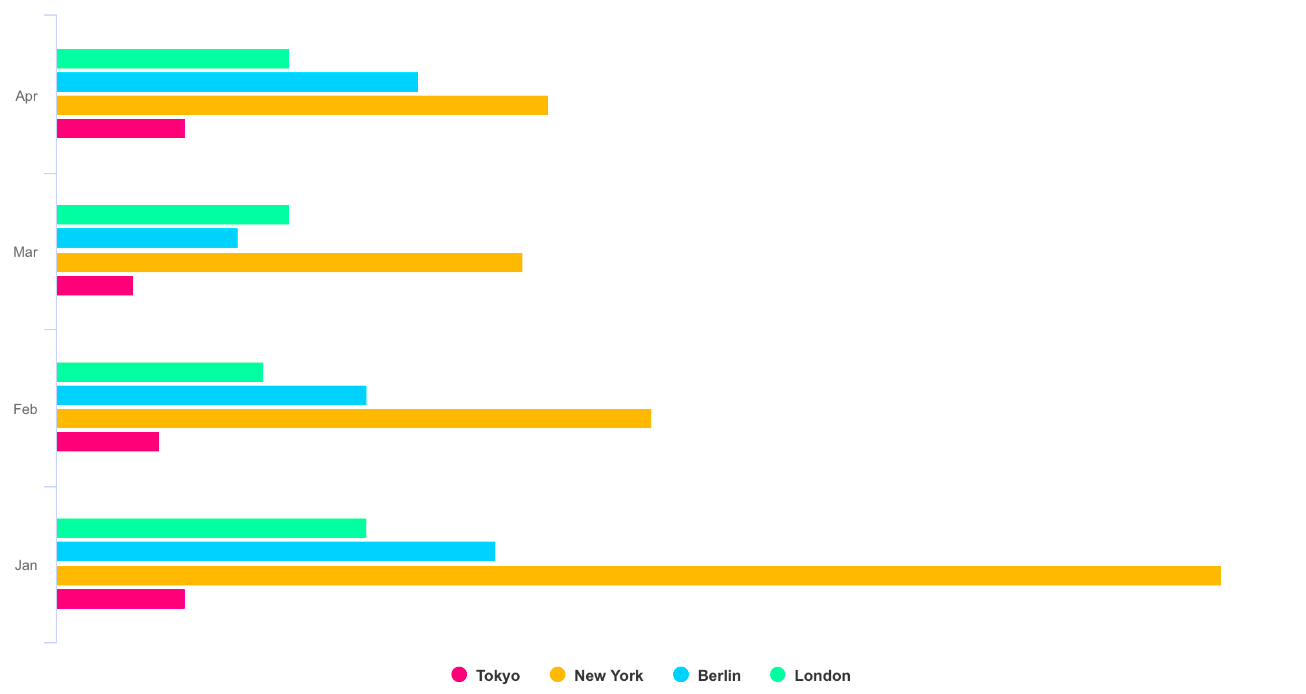
| Column Chart | Column Range Chart | Area Chart |
|---|---|---|
 |
 |
 |
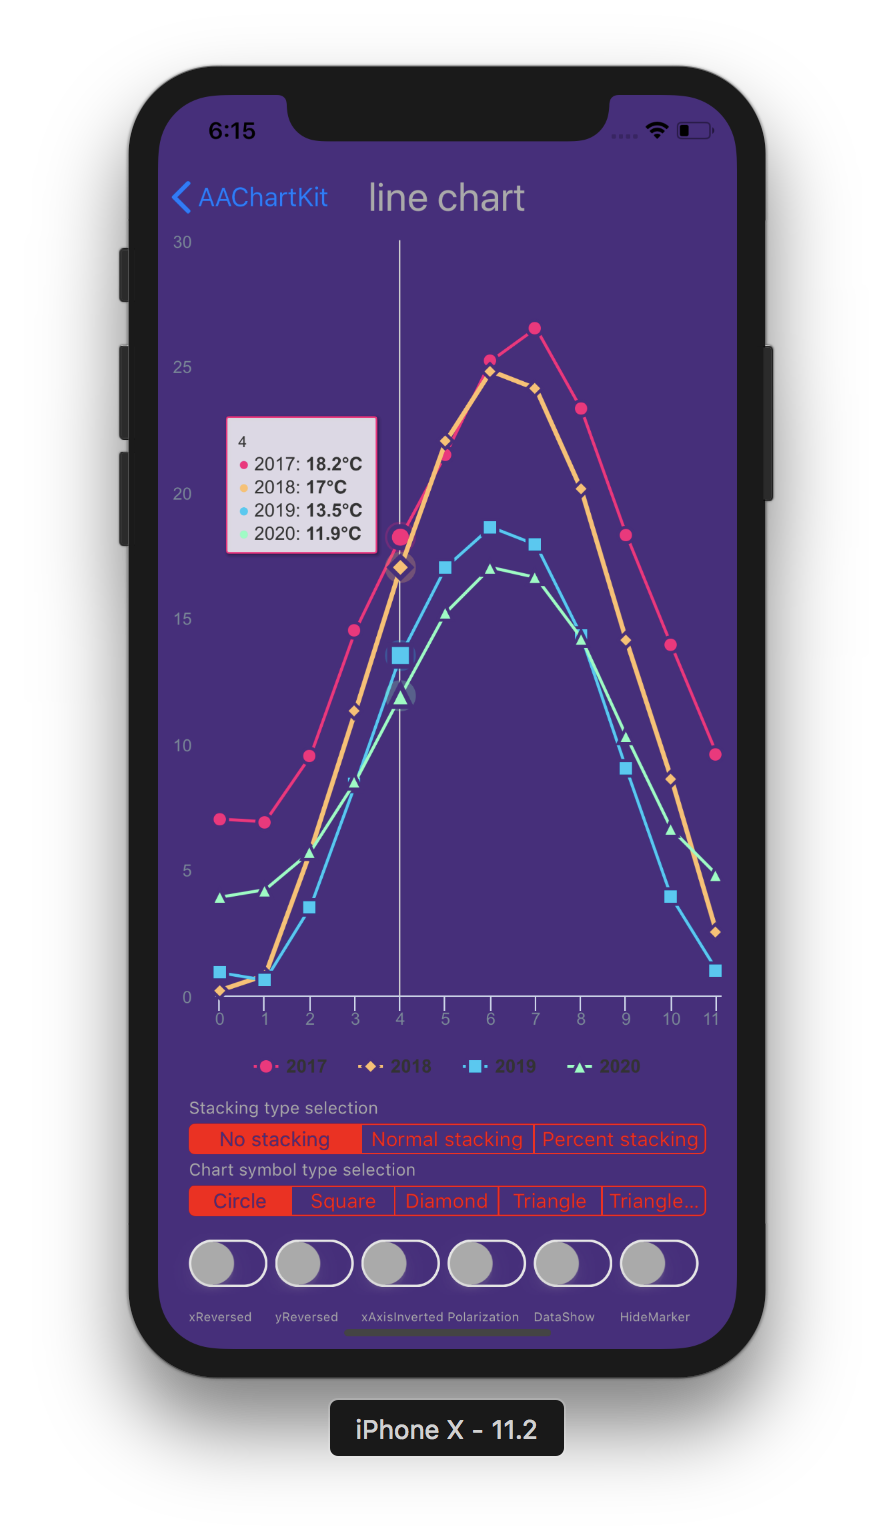
| Line Chart | Step Area Chart | Step Line Chart |
|---|---|---|
 |
 |
 |
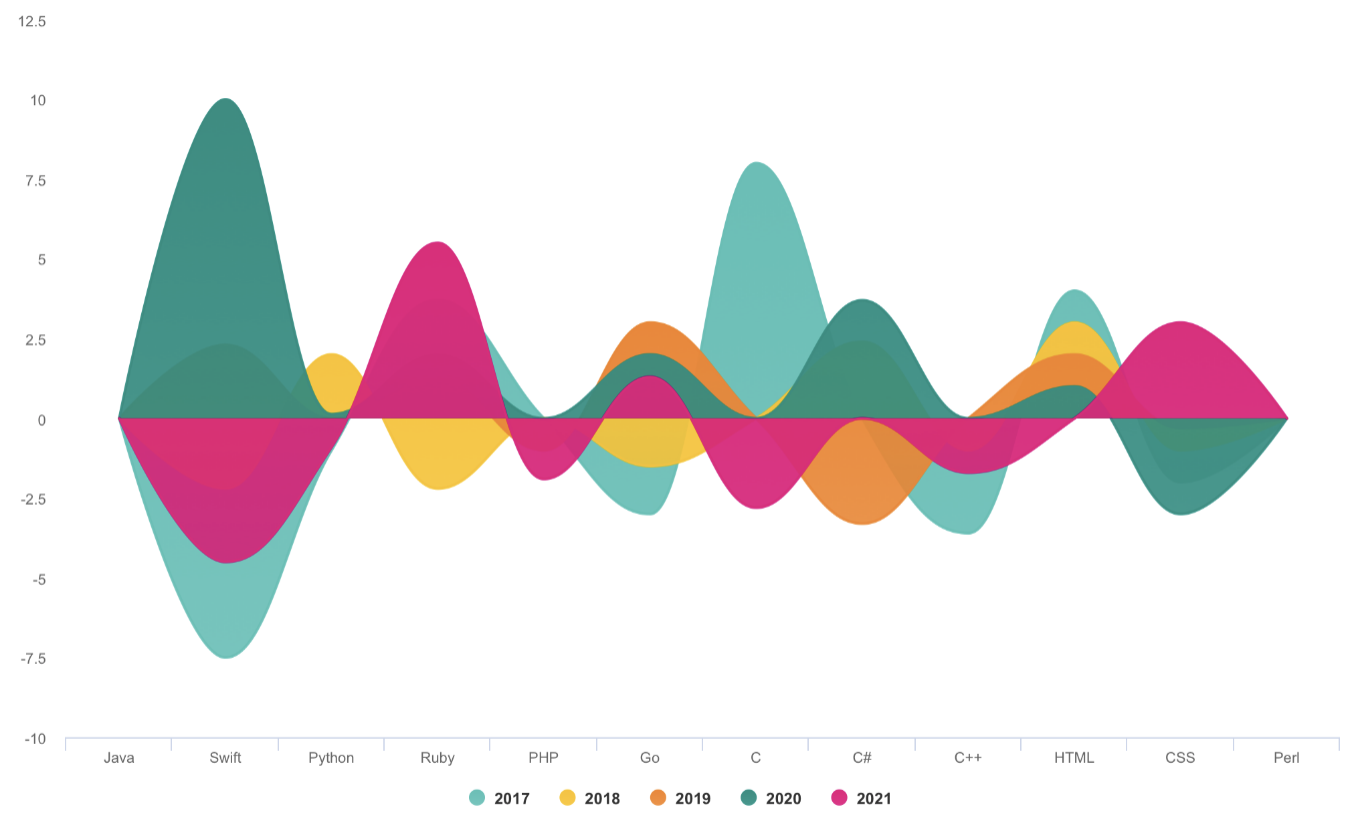
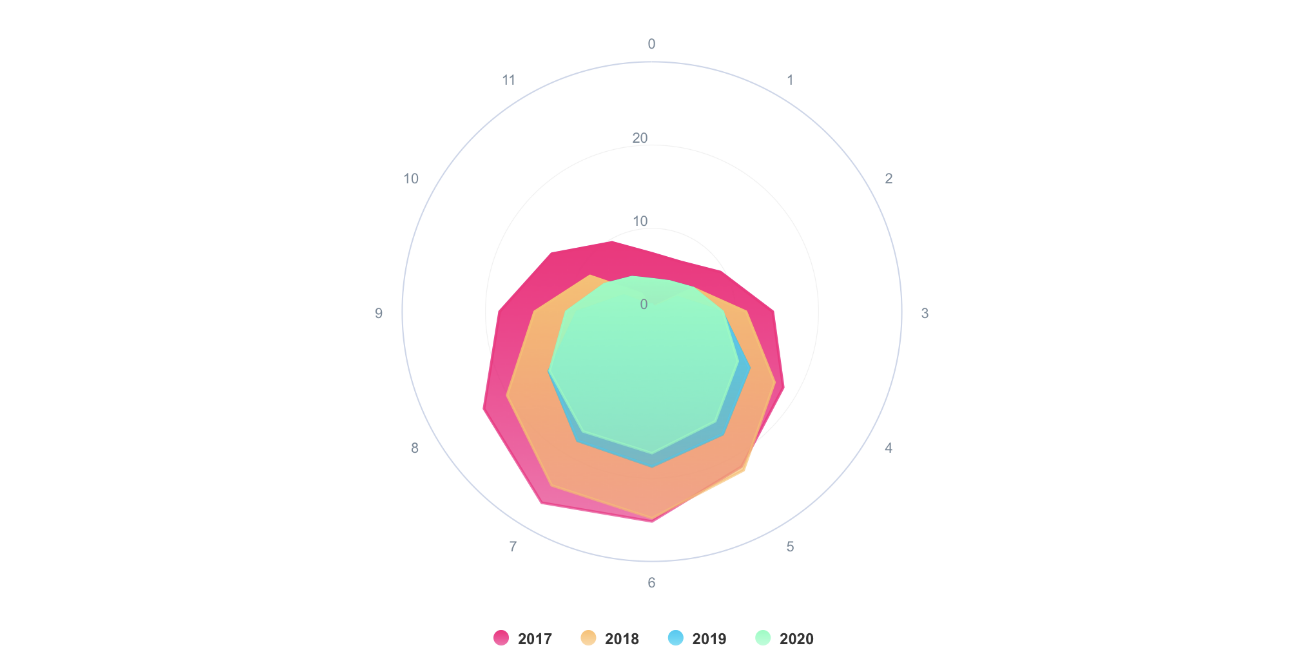
| Spline Chart | Areaspline Chart | Stacked Polar Chart |
|---|---|---|
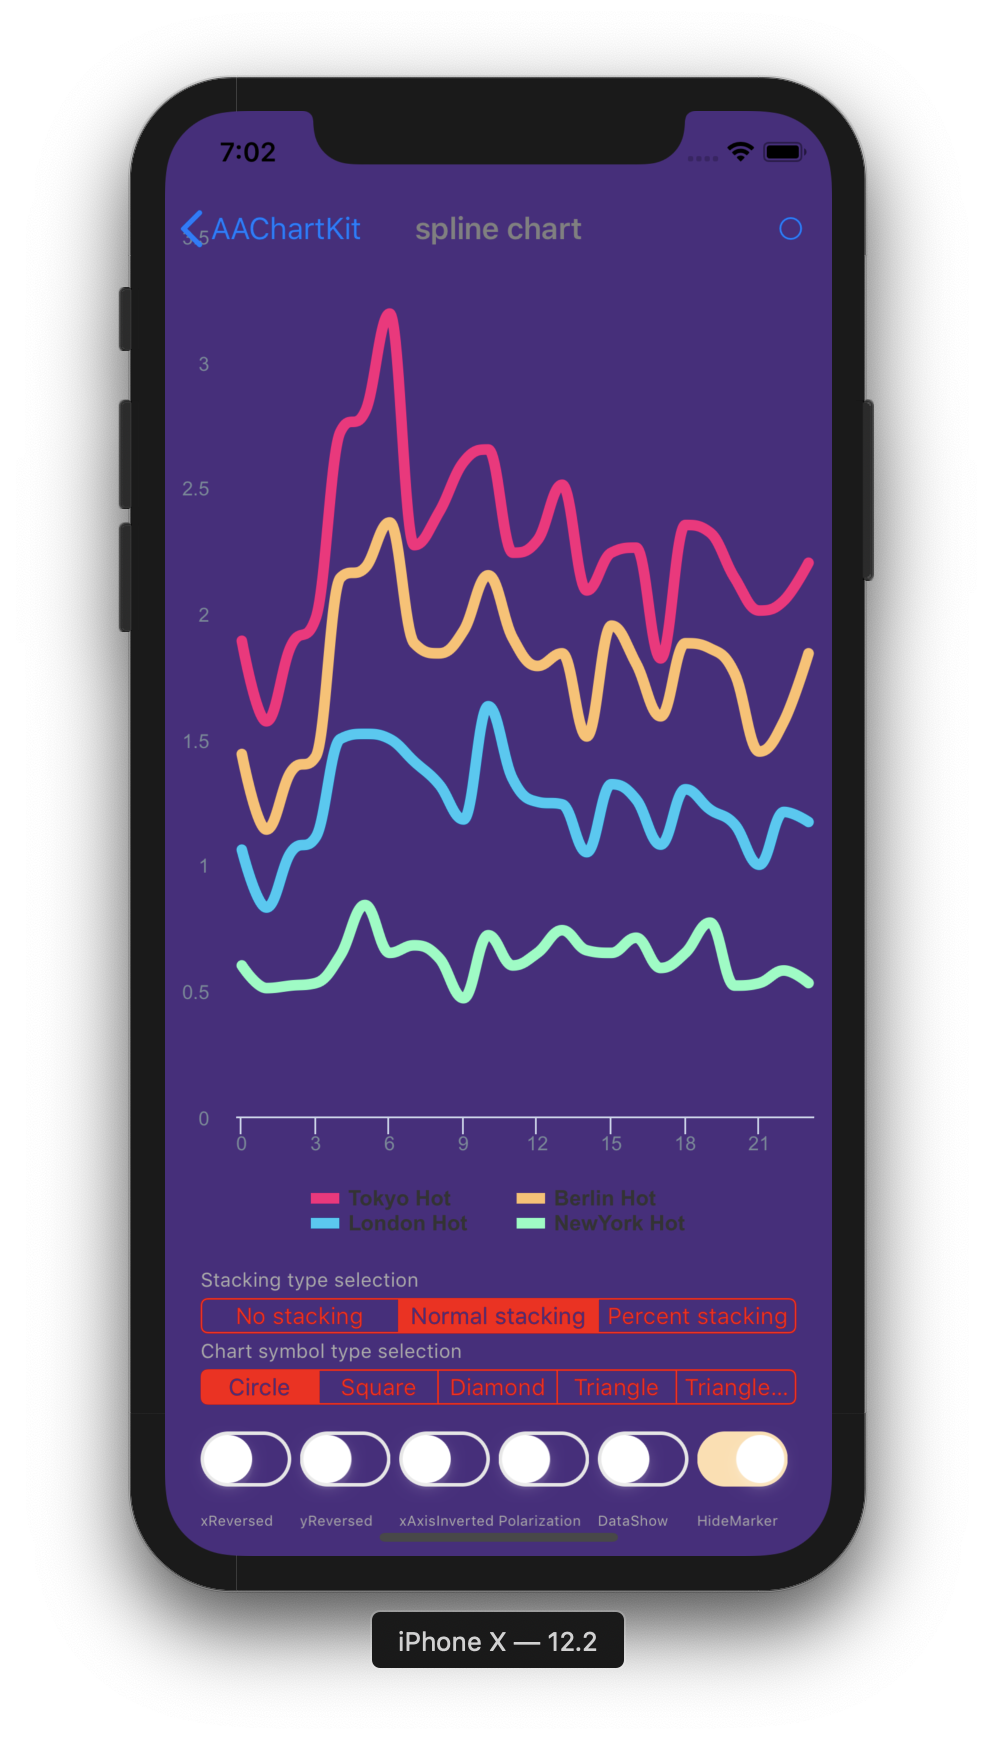 |
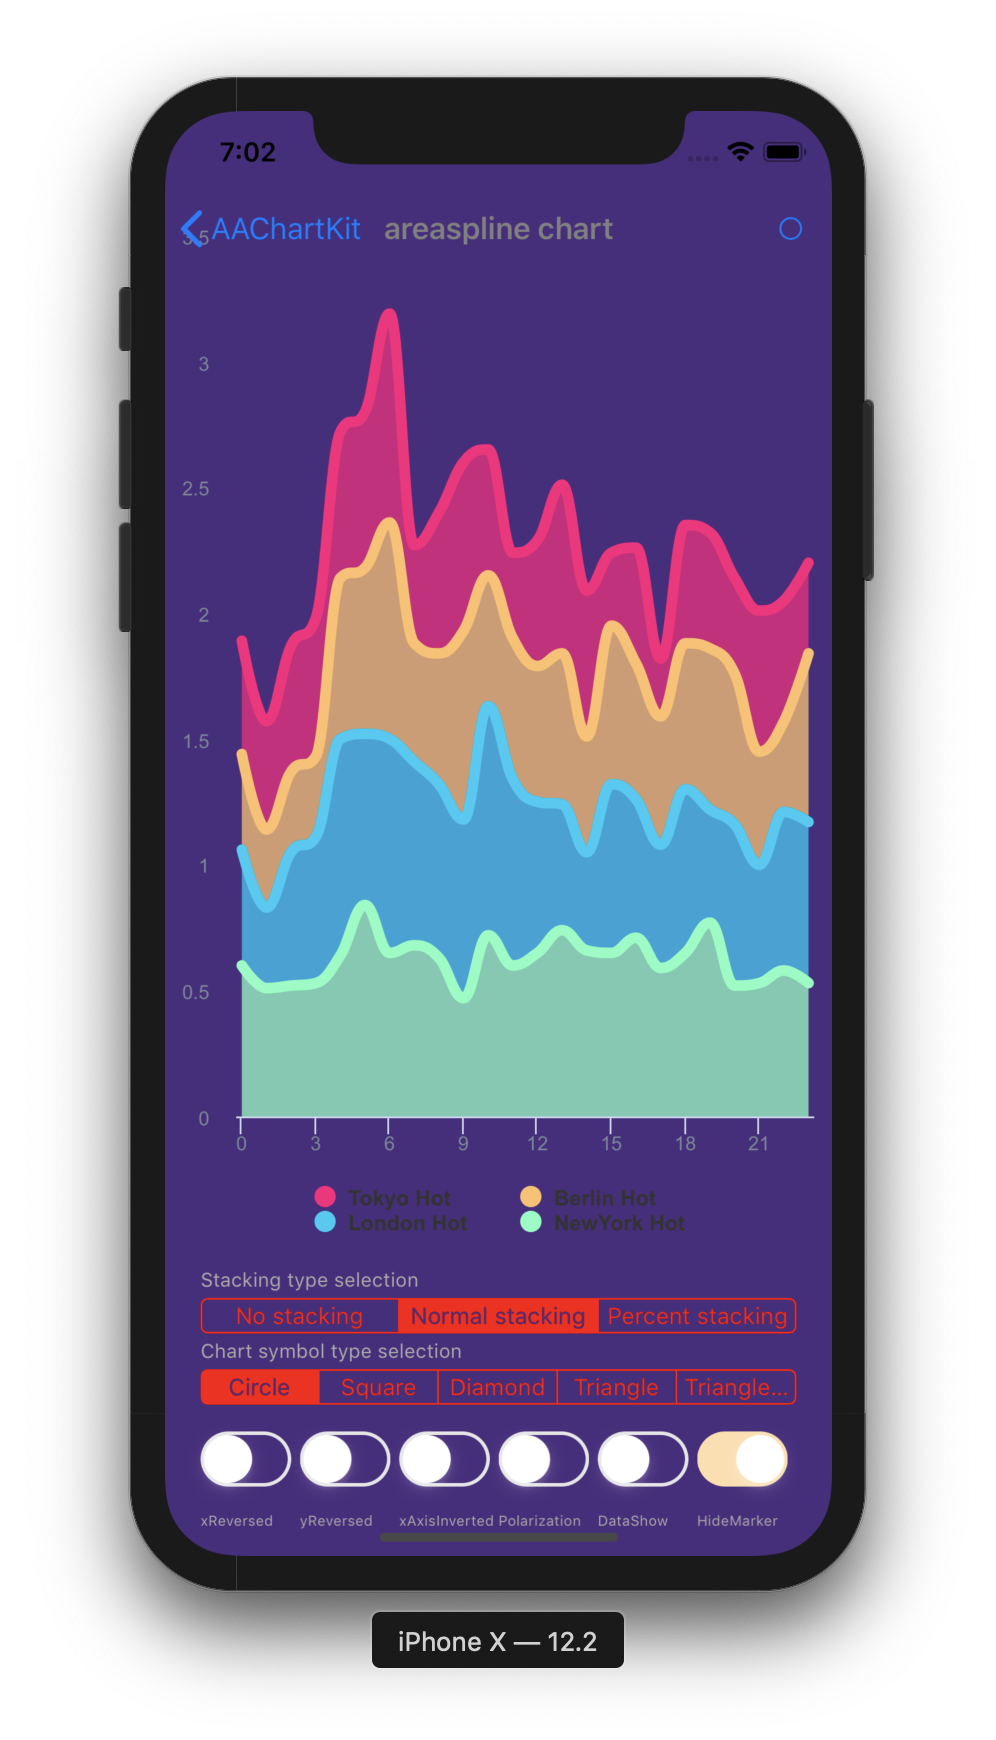 |
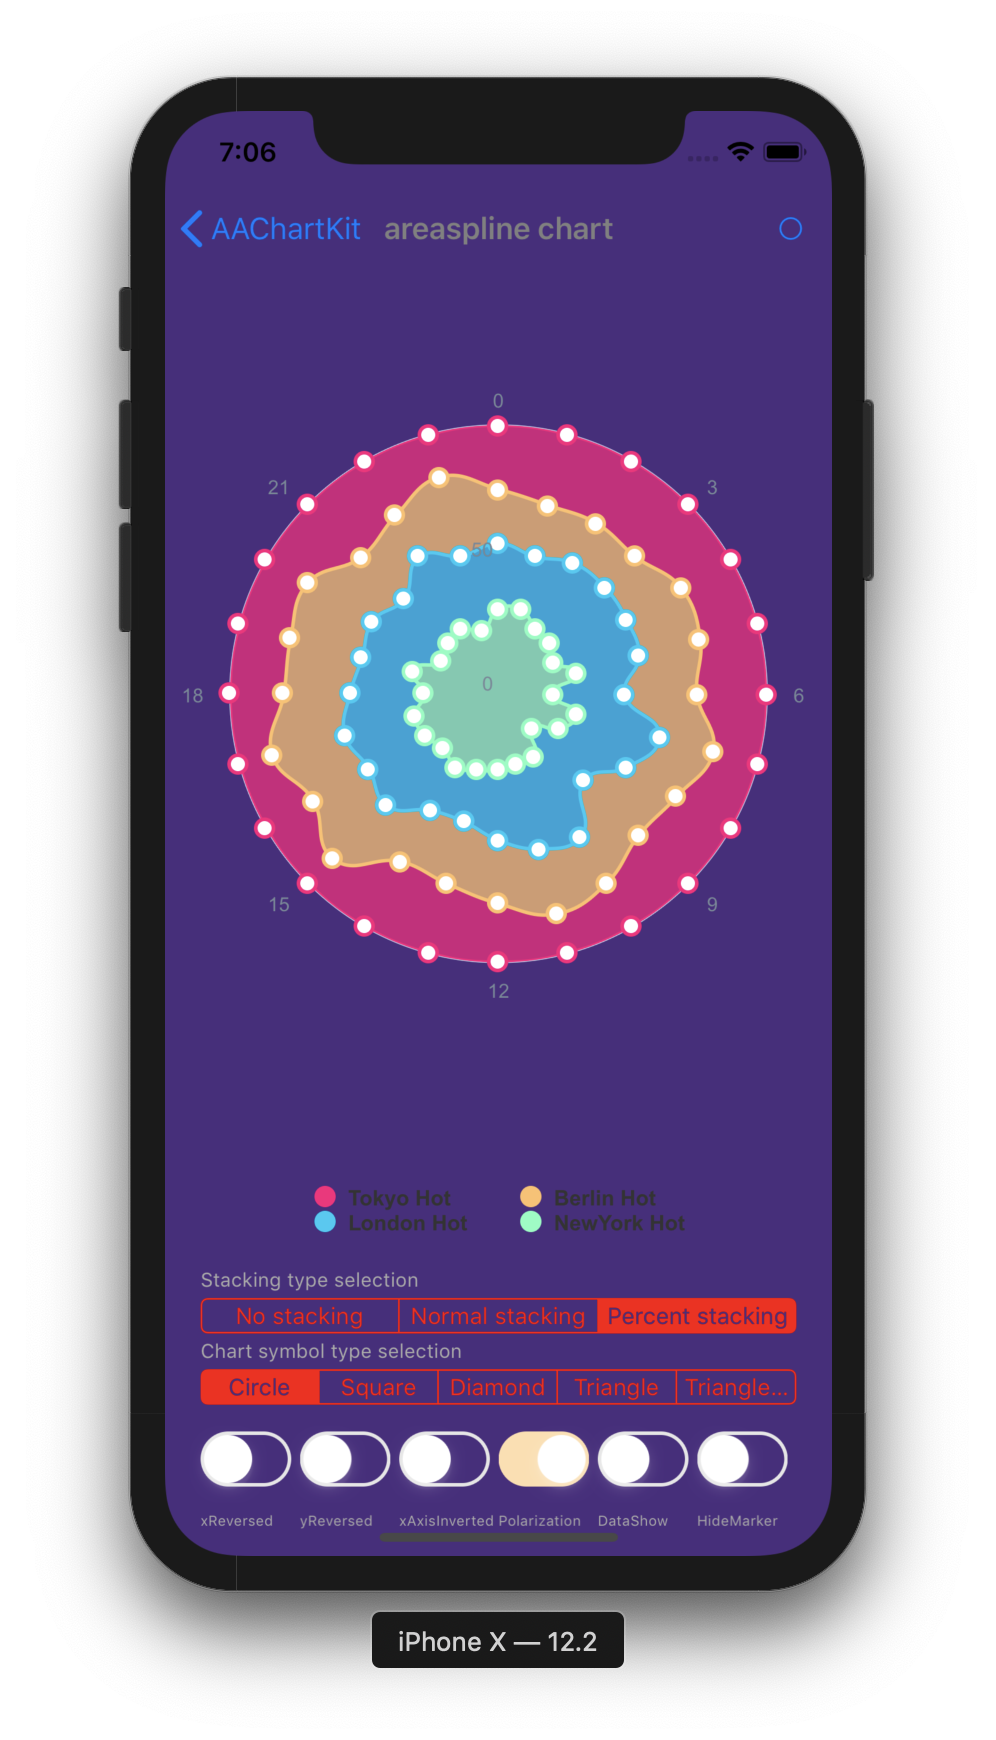 |
| Bubble Chart | Arearange Average Value Chart | Column Mixed Line Chart |
|---|---|---|
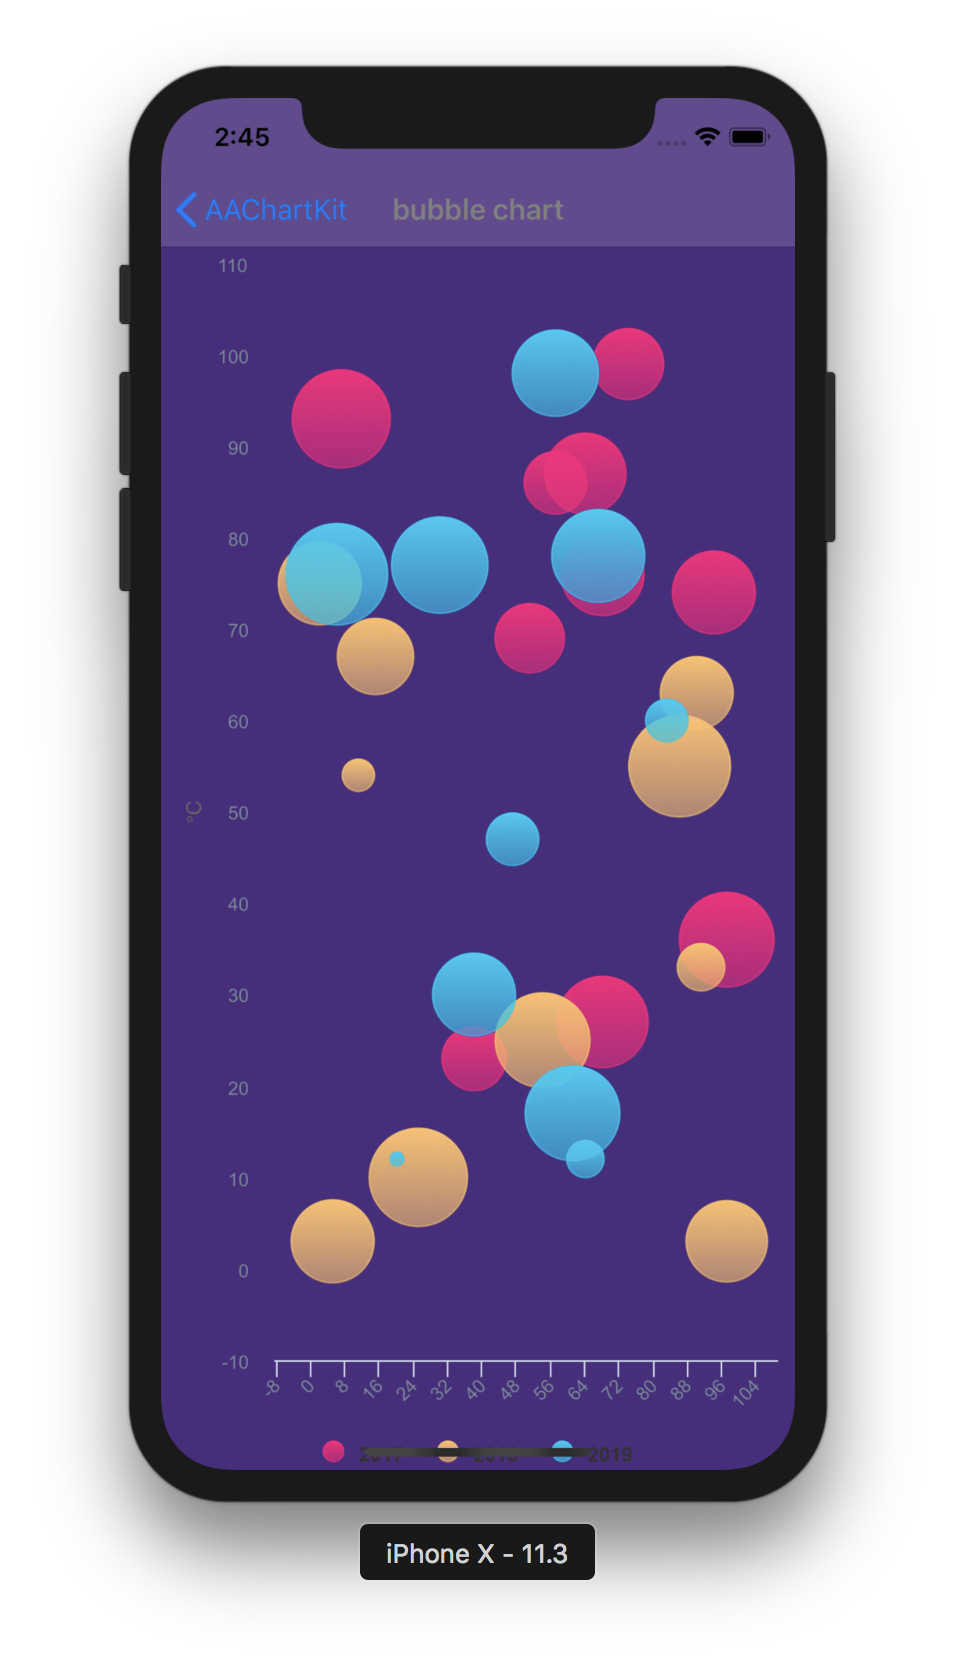 |
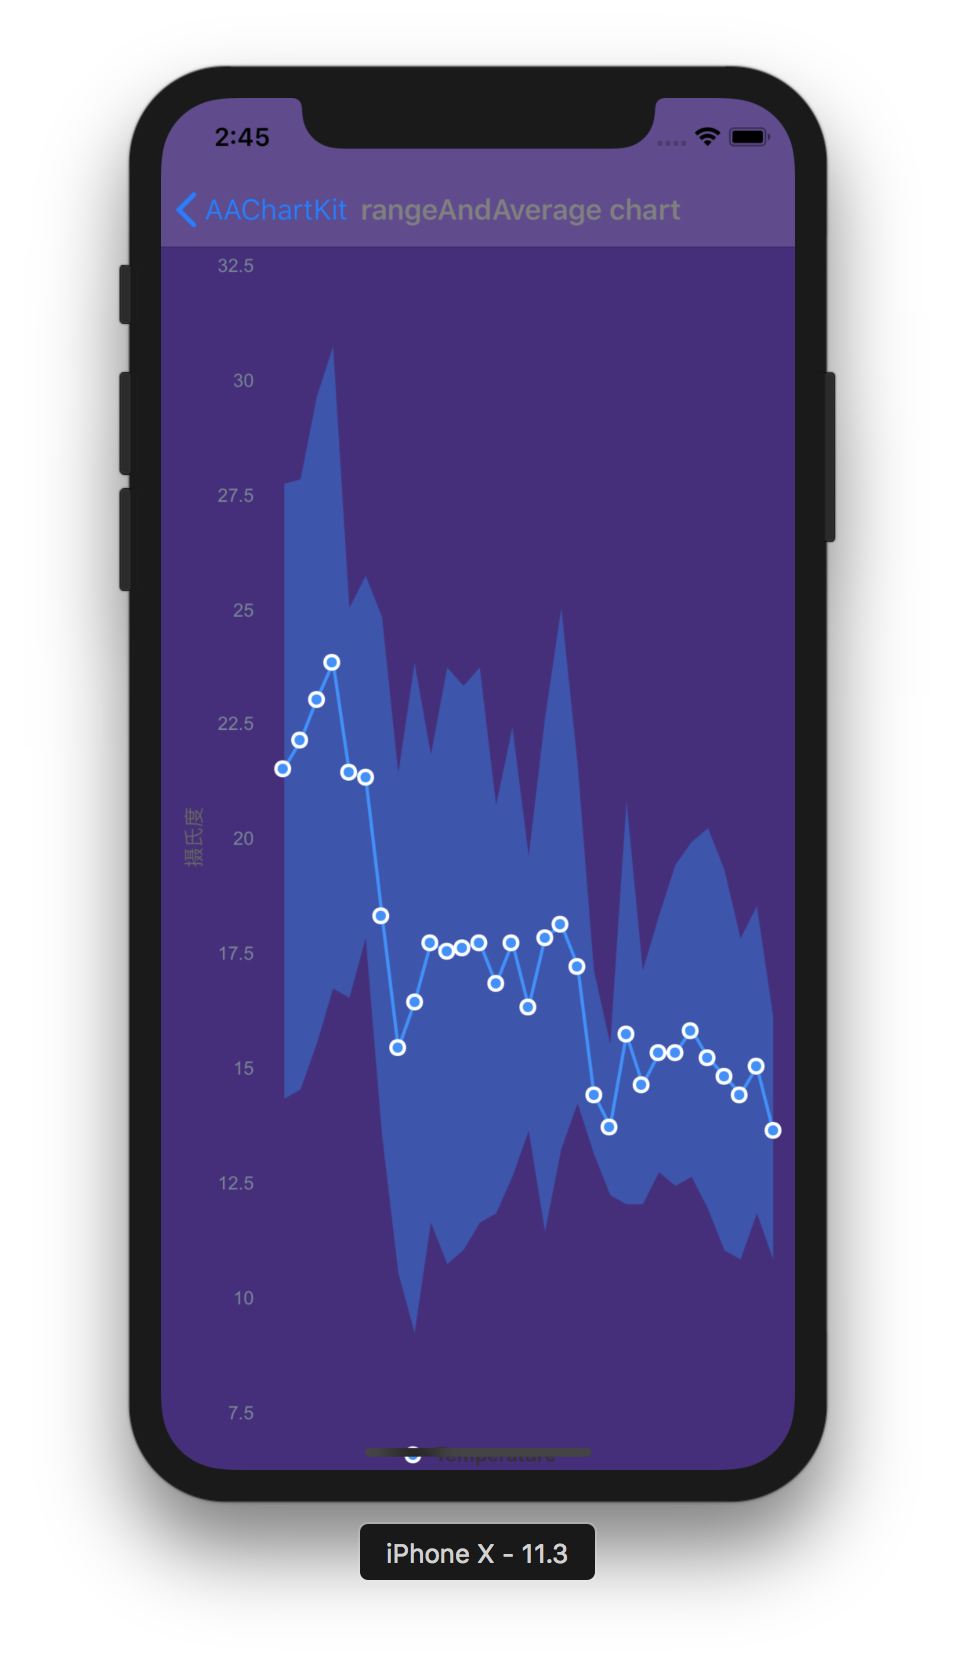 |
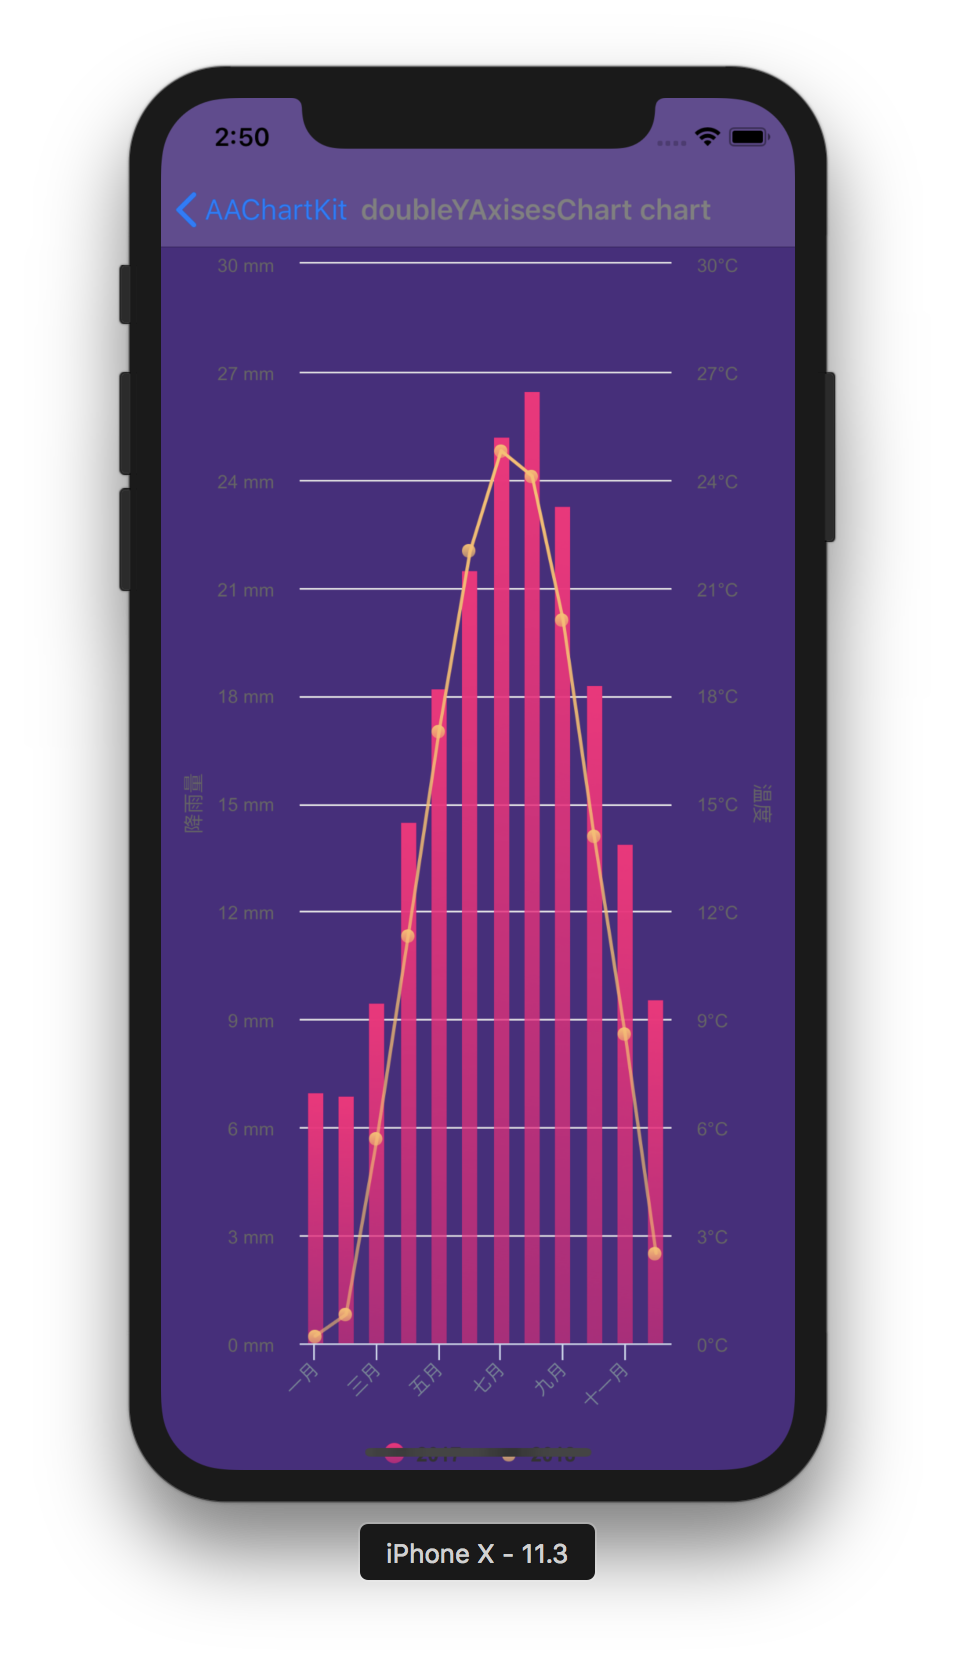 |
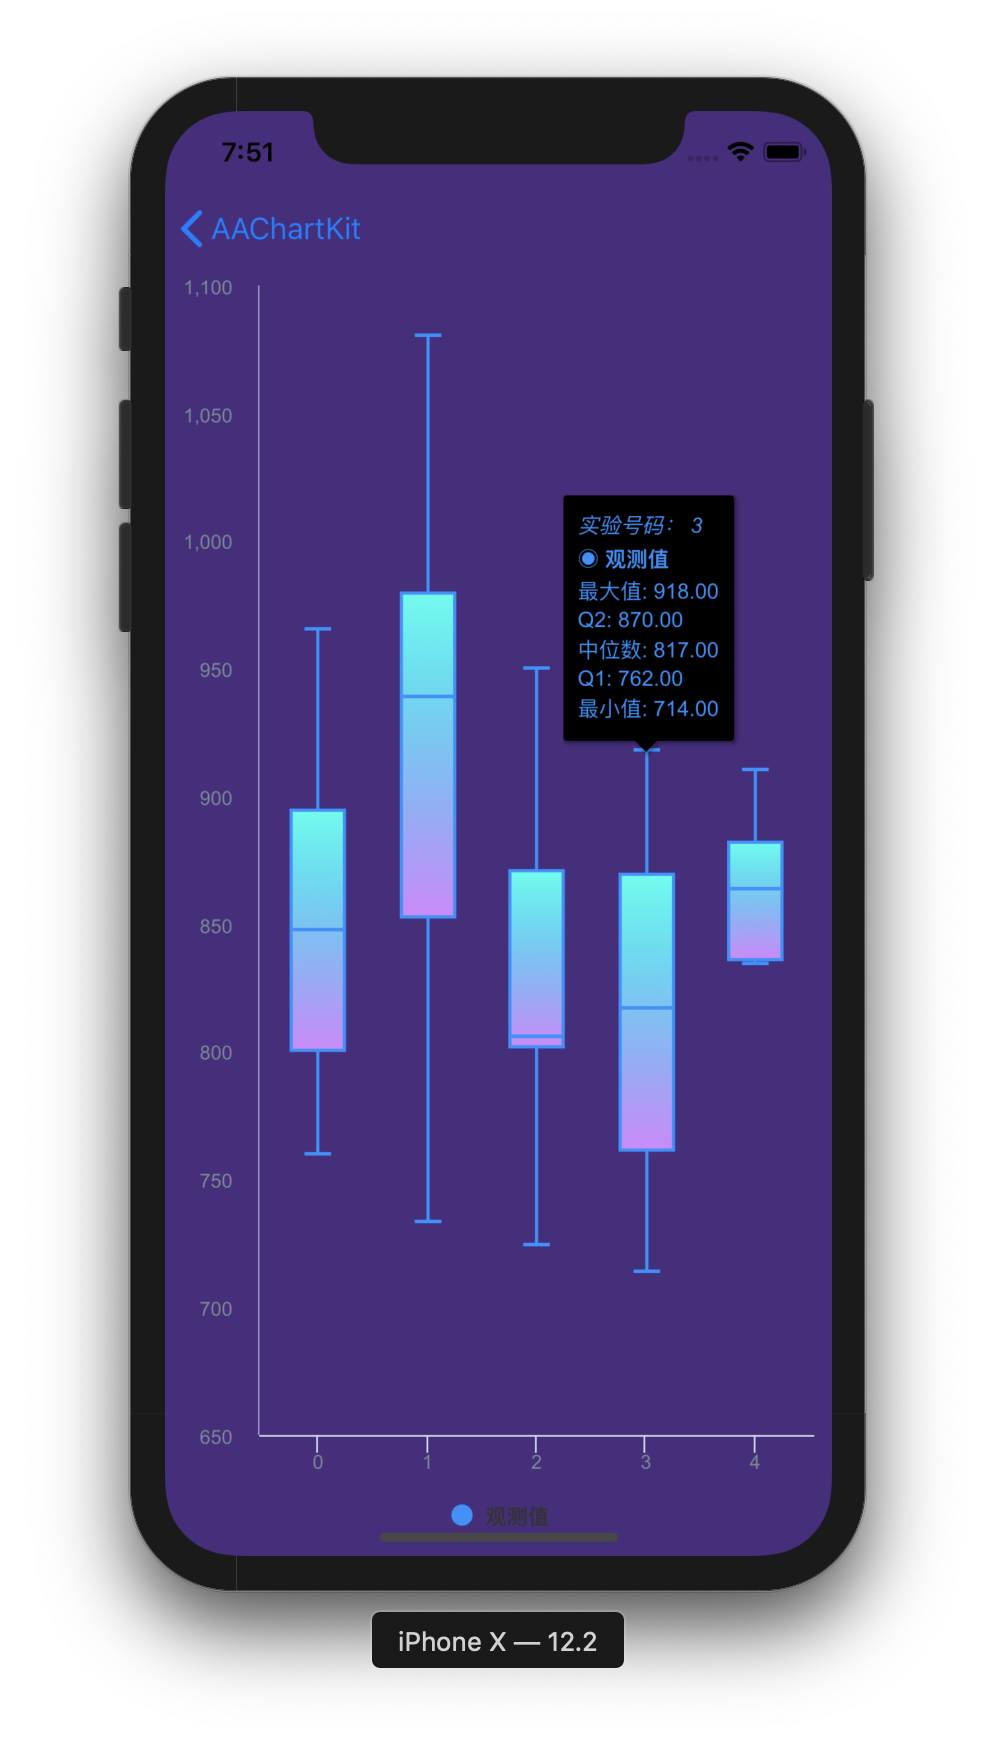
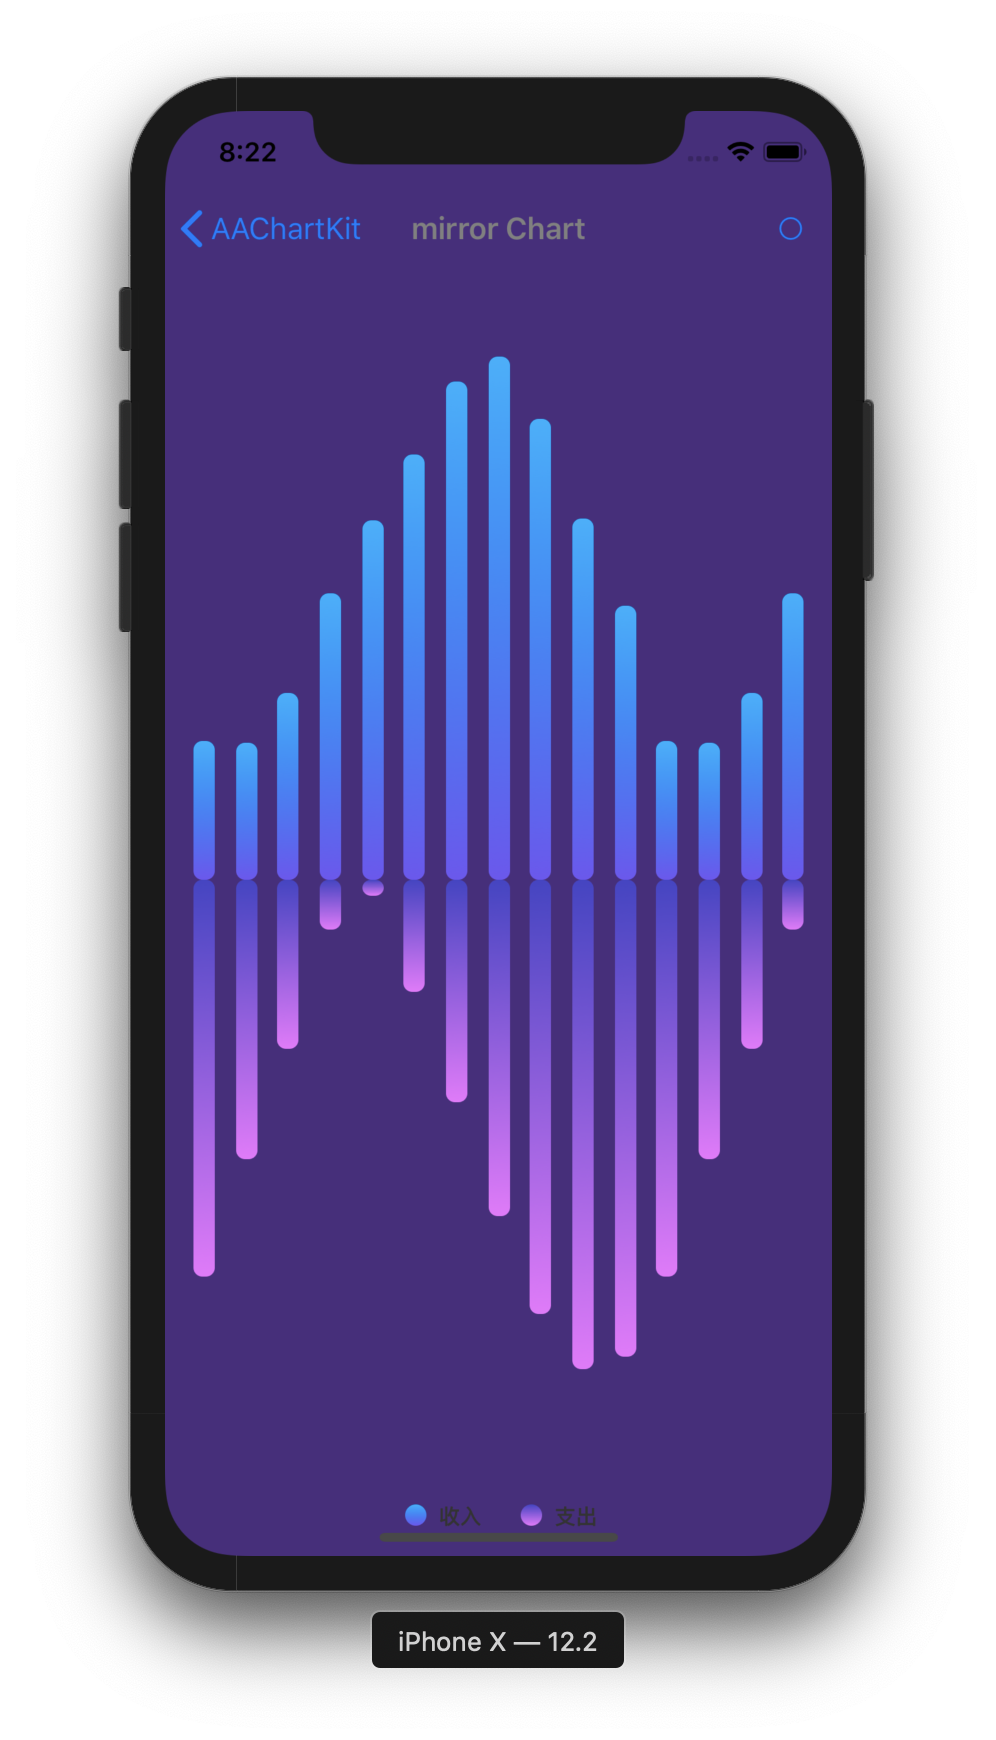
| Scatter Chart | Boxplot Chart | Mirror Column Chart |
|---|---|---|
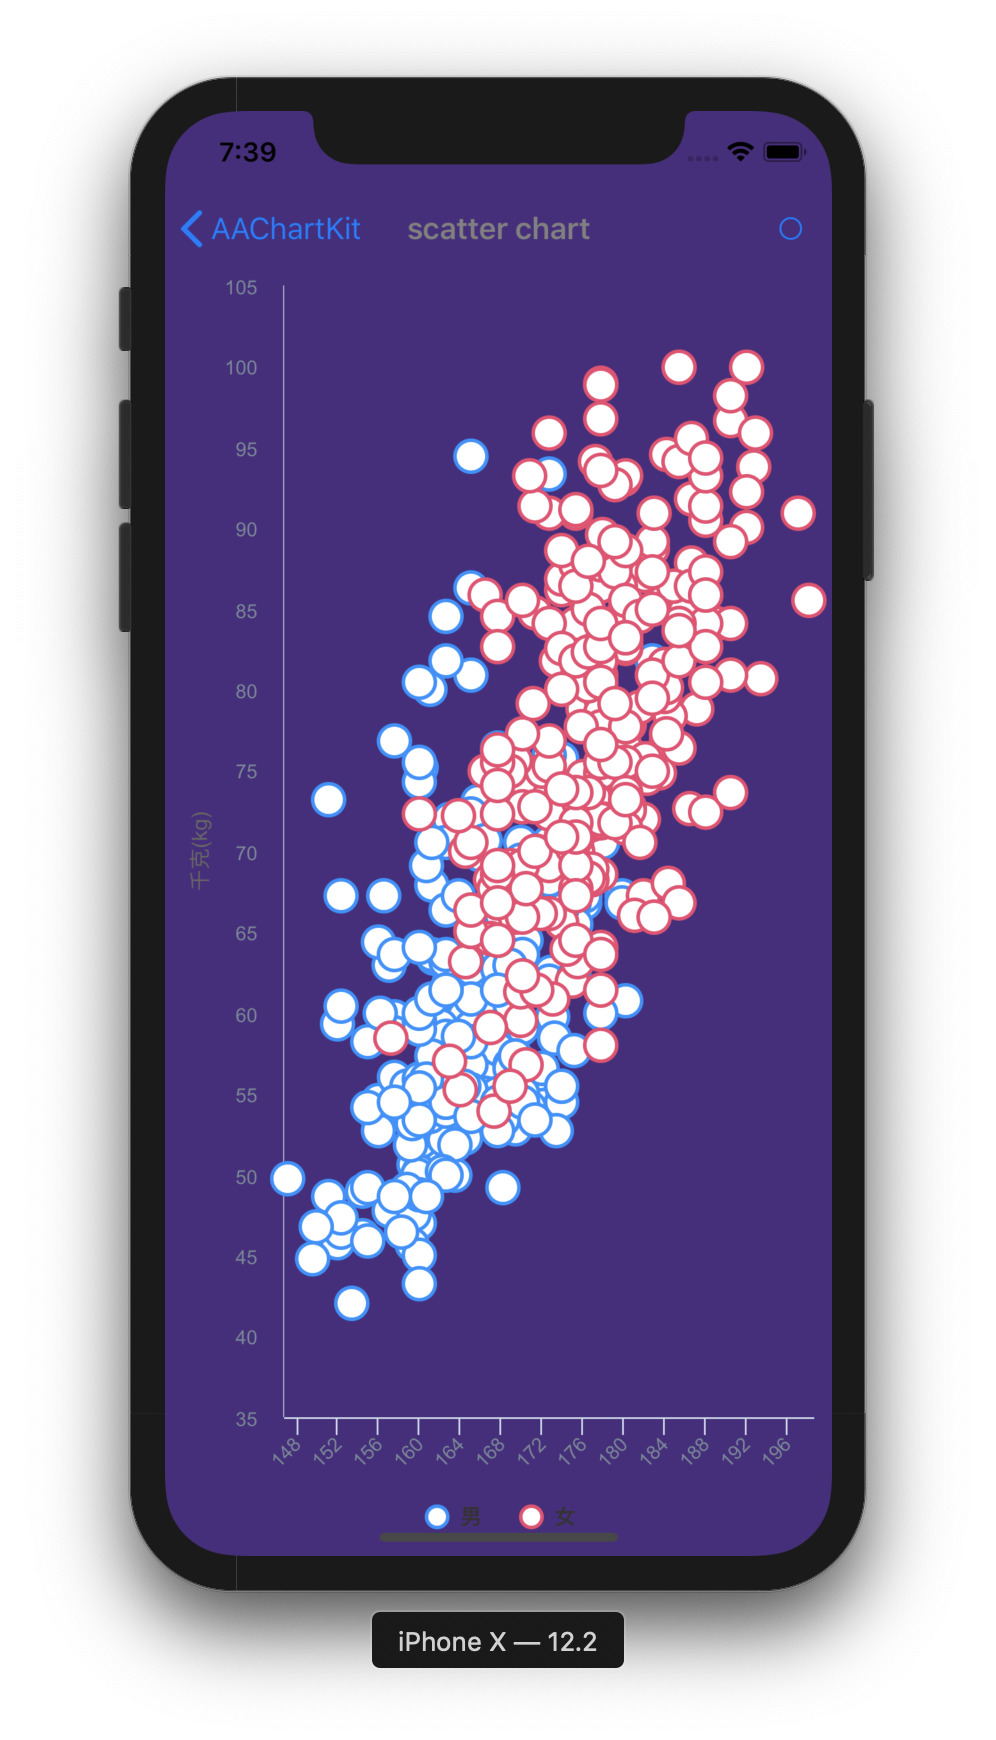 |
 |
 |
- Add following content
pod 'AAChartKit', :git => 'https://github.com/AAChartModel/AAChartKit.git'to your Podfile.
- Run
pod installorpod update.
-
Drag the
AAChartKitLibfolder into your project. -
Add the following to your
.pchfile.
#import "AAGlobalMacro.h"- Add the following to your view controller file:
#import "AAChartKit.h"- Create an instance object of chart view:
AAChartView
CGFloat chartViewWidth  = self.view.frame.size.width;
CGFloat chartViewHeight = self.view.frame.size.height - 250;
_aaChartView = [[AAChartView alloc]init];
_aaChartView.frame = CGRectMake(0, 60, chartViewWidth, chartViewHeight);
//_aaChartView.scrollEnabled = NO;
[self.view addSubview:_aaChartView];- Configure the chart model properties:
AAChartModel
AAChartModel *aaChartModel = AAChartModel.new
.chartTypeSet(AAChartTypeArea)
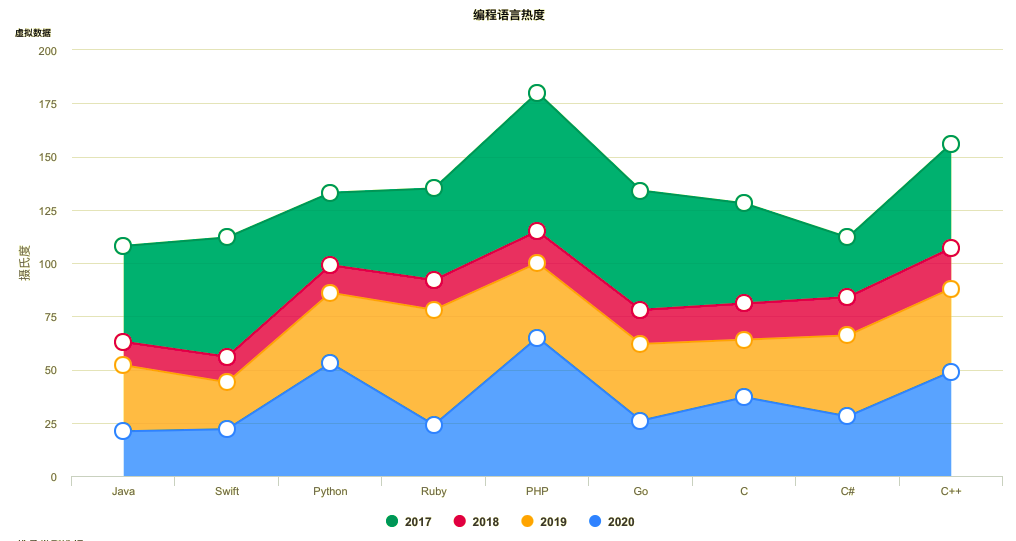
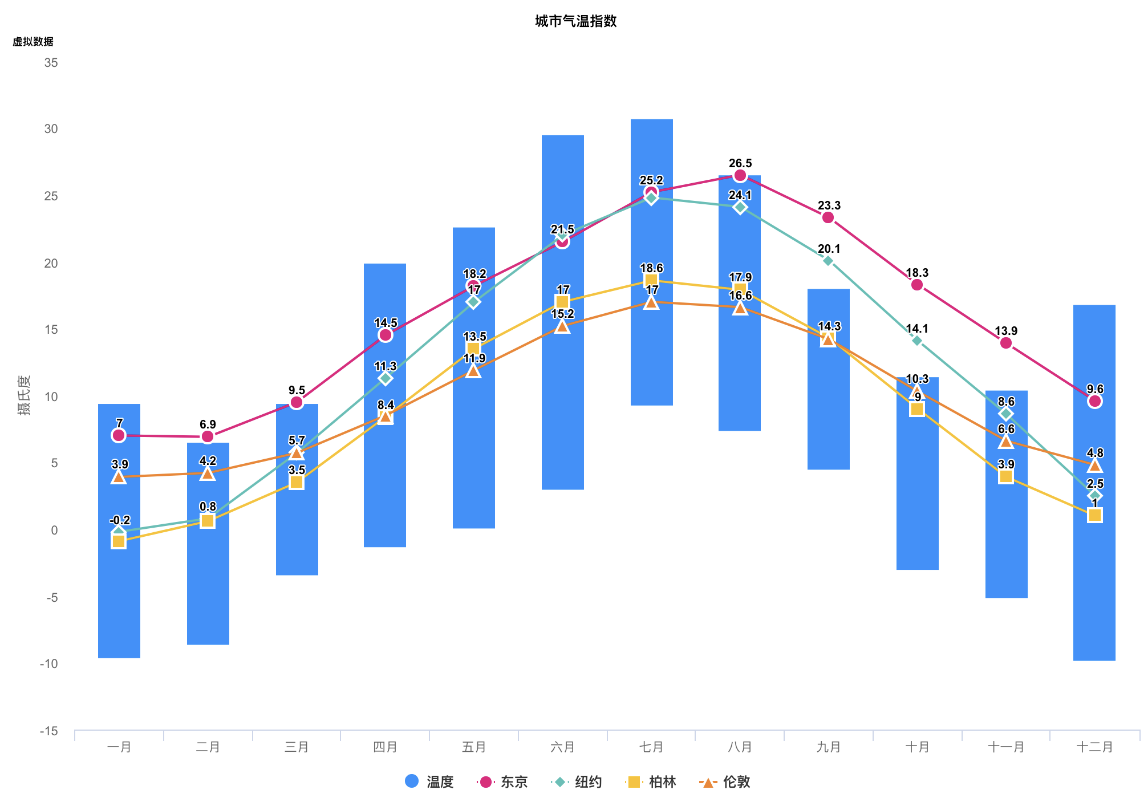
.titleSet(@"THE HEAT OF PROGRAMMING LANGUAGE")
.subtitleSet(@"Virtual Data")
.categoriesSet(@[@"Java",@"Swift",@"Python",@"Ruby", @"PHP",@"Go",@"C",@"C#",@"C++"])
.yAxisTitleSet(@"Degrees Celsius")
.seriesSet(@[
AASeriesElement.new
.nameSet(@"2017")
.dataSet(@[@7.0, @6.9, @9.5, @14.5, @18.2, @21.5, @25.2, @26.5, @23.3, @18.3, @13.9, @9.6]),
AASeriesElement.new
.nameSet(@"2018")
.dataSet(@[@0.2, @0.8, @5.7, @11.3, @17.0, @22.0, @24.8, @24.1, @20.1, @14.1, @8.6, @2.5]),
AASeriesElement.new
.nameSet(@"2019")
.dataSet(@[@0.9, @0.6, @3.5, @8.4, @13.5, @17.0, @18.6, @17.9, @14.3, @9.0, @3.9, @1.0]),
AASeriesElement.new
.nameSet(@"2020")
.dataSet(@[@3.9, @4.2, @5.7, @8.5, @11.9, @15.2, @17.0, @16.6, @14.2, @10.3, @6.6, @4.8]),
]);- Draw the chart (this method is only called the first time you create an AAChartView instance object)
//The chart view object calls the instance object of AAChartModel and draws the final graphic
[_aaChartView aa_drawChartWithChartModel:aaChartModel];
🎉🎉🎉 Congratulations! Everything was done!!! You will get what you want!!! 🌈🌈🌈
If you want to refresh chart content, you should do something as follow. According to your actual needs, select the function that fits you.
- Refresh the chart data (this method is recommended for updating the series data dynamically)
//Refresh the chart dynamically only when the series attribute of the AAChartModel object is updated
[_aaChartView aa_onlyRefreshTheChartDataWithChartModelSeries:aaChartModelSeriesArray];- Refresh the chart, minus the chart data (this method is recommended for subsequent refreshes after the first drawing of graphics has completed. If you want to update the chart data only, you should use the function
aa_onlyRefreshTheChartDataWithChartModelSeries)
//Refresh the chart after the AAChartModel content is updated
[_aaChartView aa_refreshChartWithChartModel:aaChartModel];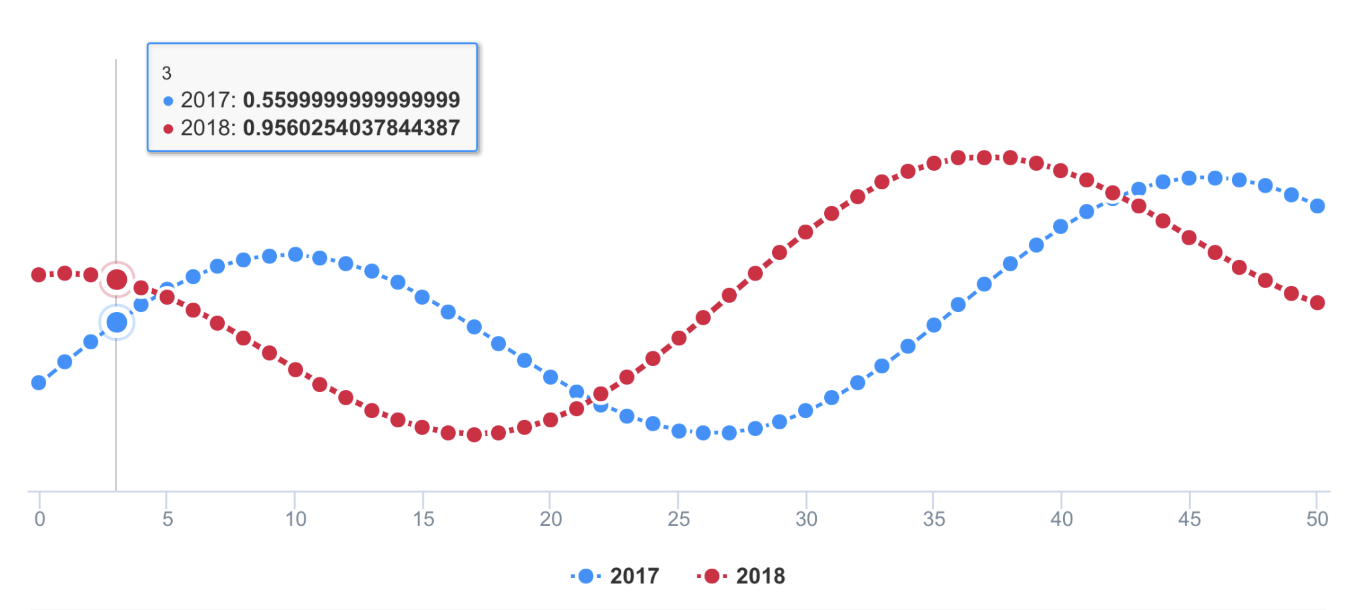

- Note: The following
DEMO pictureis aGIF dynamic picturewhich has a size of around 6M. If you don't see any dynamic preview, then this is because the picture resources were not fully loaded. In such a case please be patient and wait for the contents to finish loading. Maybe you need to reload this page.
you can monitor the user touch events message through implementing delegate function for AAChartView instance object
 //Set AAChartView events delegate
 self.aaChartView.delegate = self;

 //implement AAChartView user touch events delegate function
 #pragma mark -- AAChartView delegate
 - (void)aaChartView:(AAChartView *)aaChartView moveOverEventWithMessage:(AAMoveOverEventMessageModel *)message {
 NSLog(@"🚀selected point series element name: %@",message.name);
 }
The received touch events message contain following content
@interface AAMoveOverEventMessageModel : NSObject
@property (nonatomic, copy) NSString *name;
@property (nonatomic, strong) NSNumber *x;
@property (nonatomic, strong) NSNumber *y;
@property (nonatomic, copy) NSString *category;
@property (nonatomic, strong) NSDictionary *offset;
@property (nonatomic, assign) NSUInteger index;
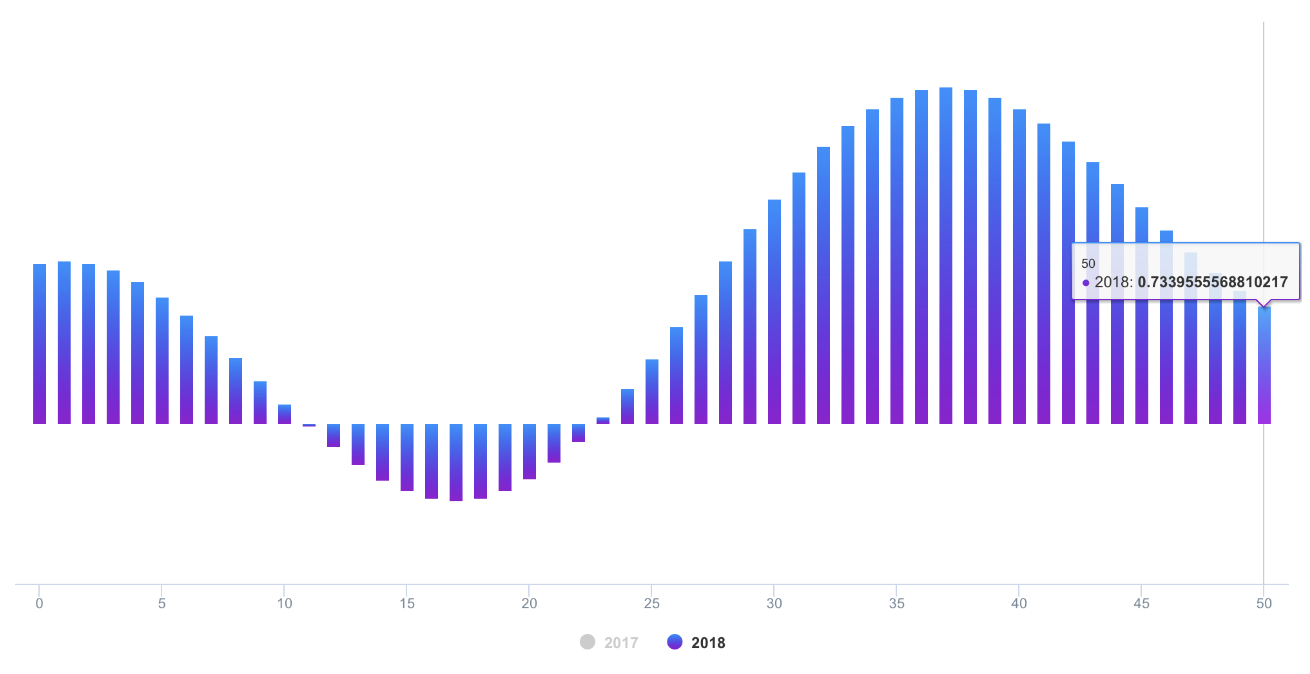
@endMonitoring user click events can achieve a variety of custom functions. For example, you can implement Double Charts Linkage through user click event callbacks. The example effects are as follows
As we all know, AAChartKit support using HTML String. Most of time, the headerFormat 、pointFormat、footerFormat HTML string is enough for customizing chart tooltip string content, However, sometimes the needs of APP is so weird to satified, in this time, you can even customize the chart tooltip style via formatter JavaScript function.
For example
- configuring AATooltip instance object properties as follow:
 /*Custom Tooltip Style ---*/
    AATooltip *tooltip = aaOptions.tooltip;
    tooltip
    .useHTMLSet(true)
    .formatterSet(@AAJSFunc(function () {
        return ' 🌕 🌖 🌗 🌘 🌑 🌒 🌓 🌔 <br/> '
        + ' Support JavaScript Function Just Right Now !!! <br/> '
        + ' The Gold Price For <b>2020 '
        +  this.x
        + ' </b> Is <b> '
        +  this.y
        + ' </b> Dollars ';
    }))
    .valueDecimalsSet(@2)
    .backgroundColorSet(@"#000000")
    .borderColorSet(@"#000000")
    .styleSet(AAStyleColorSize(@"#FFD700", 12))
    ;
you can get the customized tooltip style chart like this👇

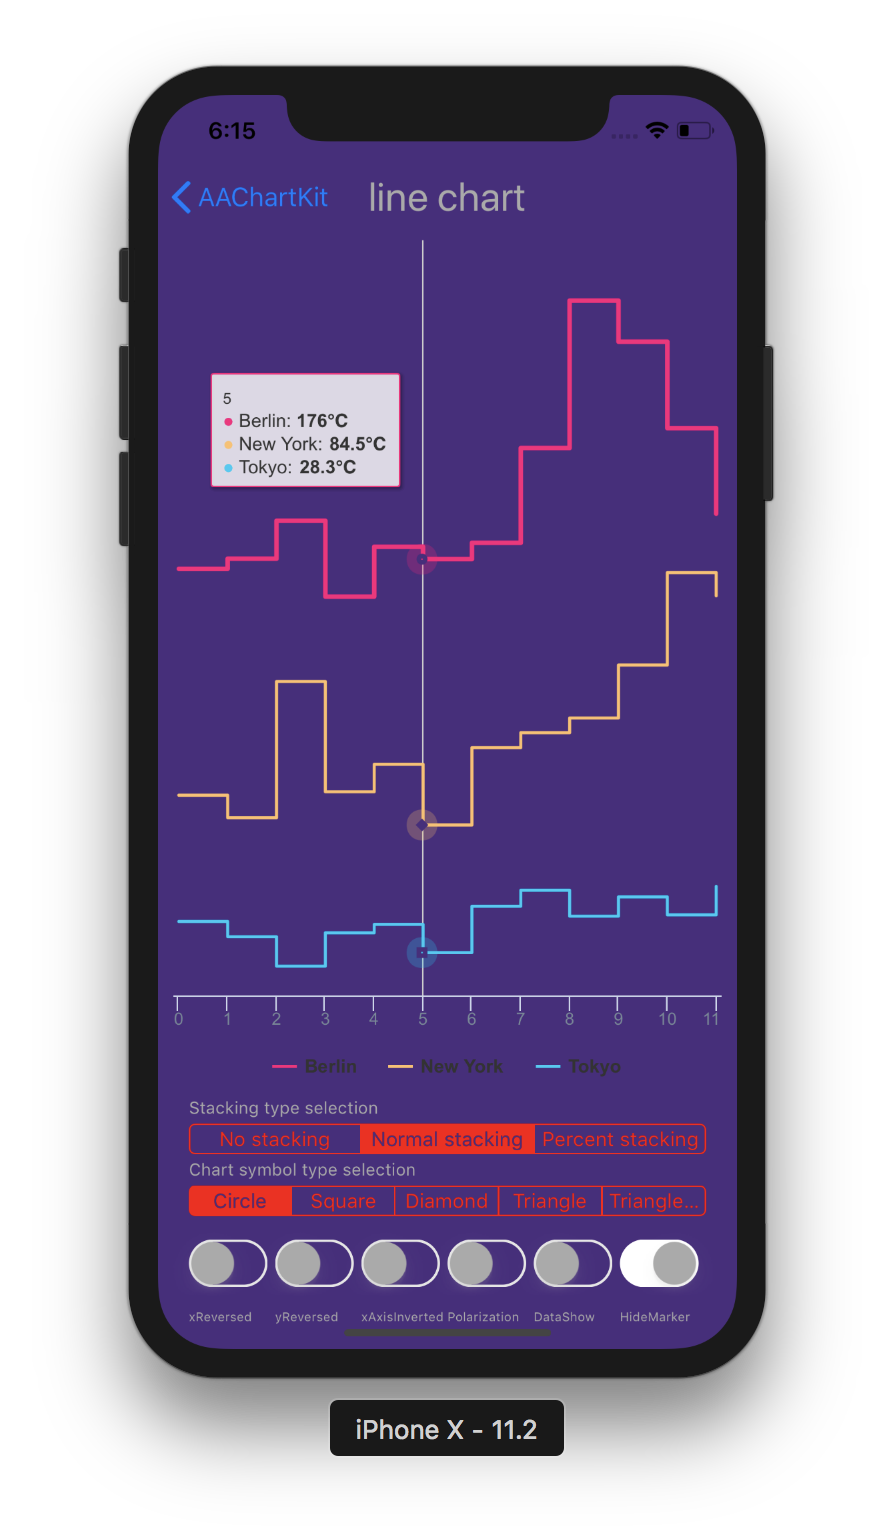
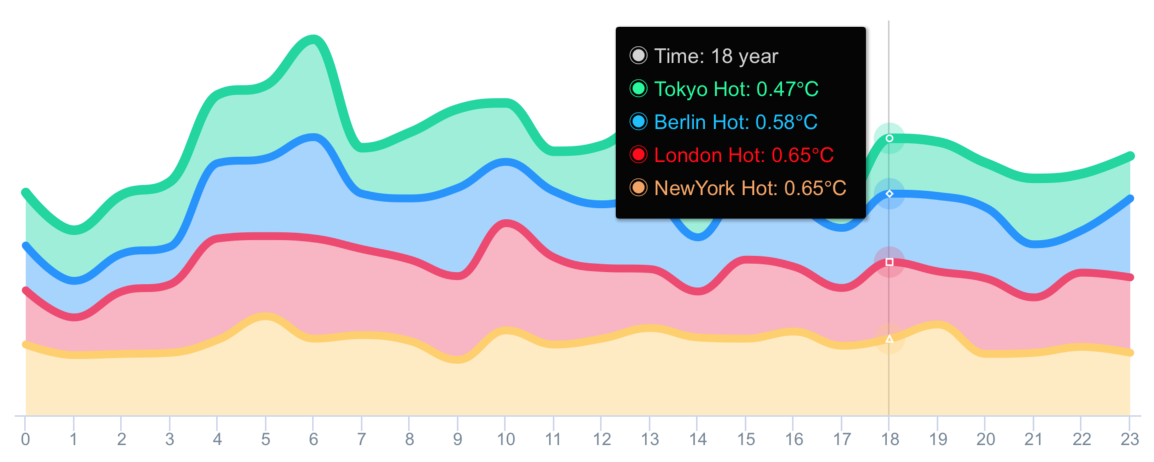
- configuring AATooltip instance object properties as follow:
    aaOptions.tooltip
    .useHTMLSet(true)
    .formatterSet(@AAJSFunc(function () {
        let wholeContentStr ='<span style=\"' + 'color:lightGray; font-size:13px\"' + '>◉ Time: ' + this.x + ' year</span><br/>';
        let length = this.points.length;
        for (let i = 0; i < length; i++) {
            let thisPoint = this.points[i];
            let yValue = thisPoint.y;
            if (yValue != 0) {
                let spanStyleStartStr = '<span style=\"' + 'color:'+ thisPoint.color + '; font-size:13px\"' + '>◉ ';
                let spanStyleEndStr = '</span> <br/>';
                wholeContentStr += spanStyleStartStr + thisPoint.series.name + ': ' + thisPoint.y + '℃' + spanStyleEndStr;
            }
        }
        return wholeContentStr;
    }))
    .backgroundColorSet(@"#050505")
    .borderColorSet(@"#050505")
    ;
you can get the customized tooltip style chart like this👇
-
chart with value range segmentation
bands 🎀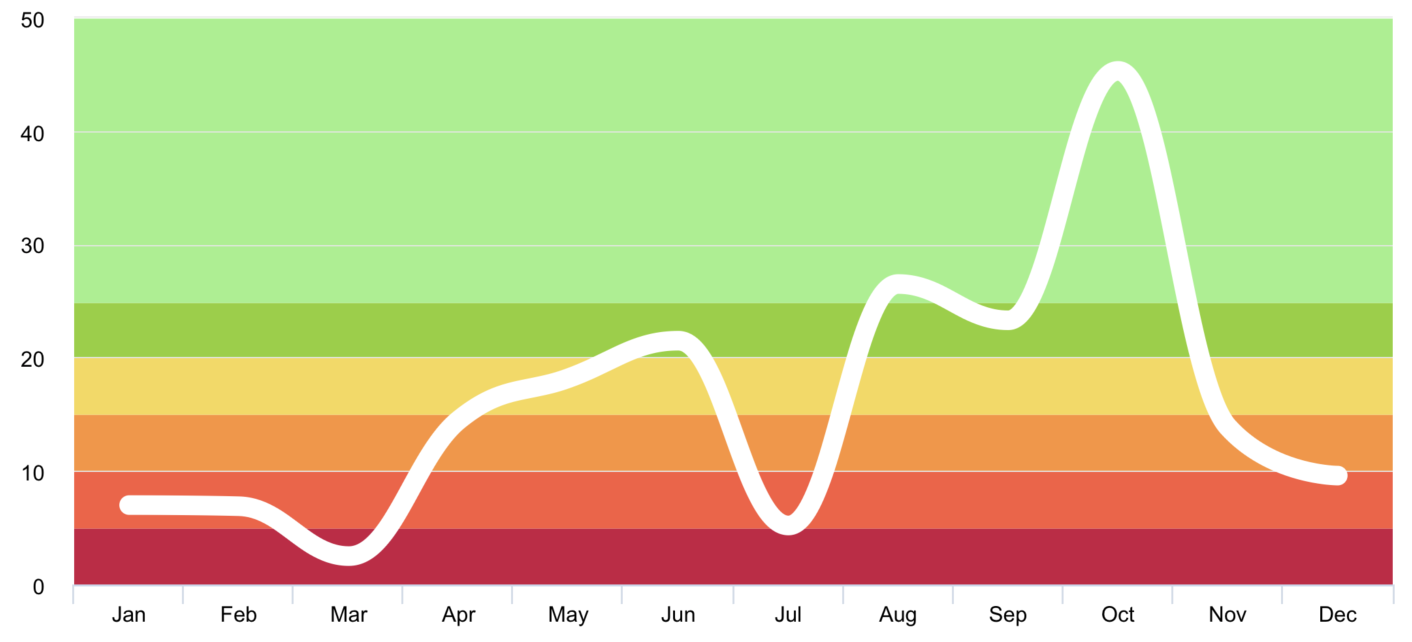
-
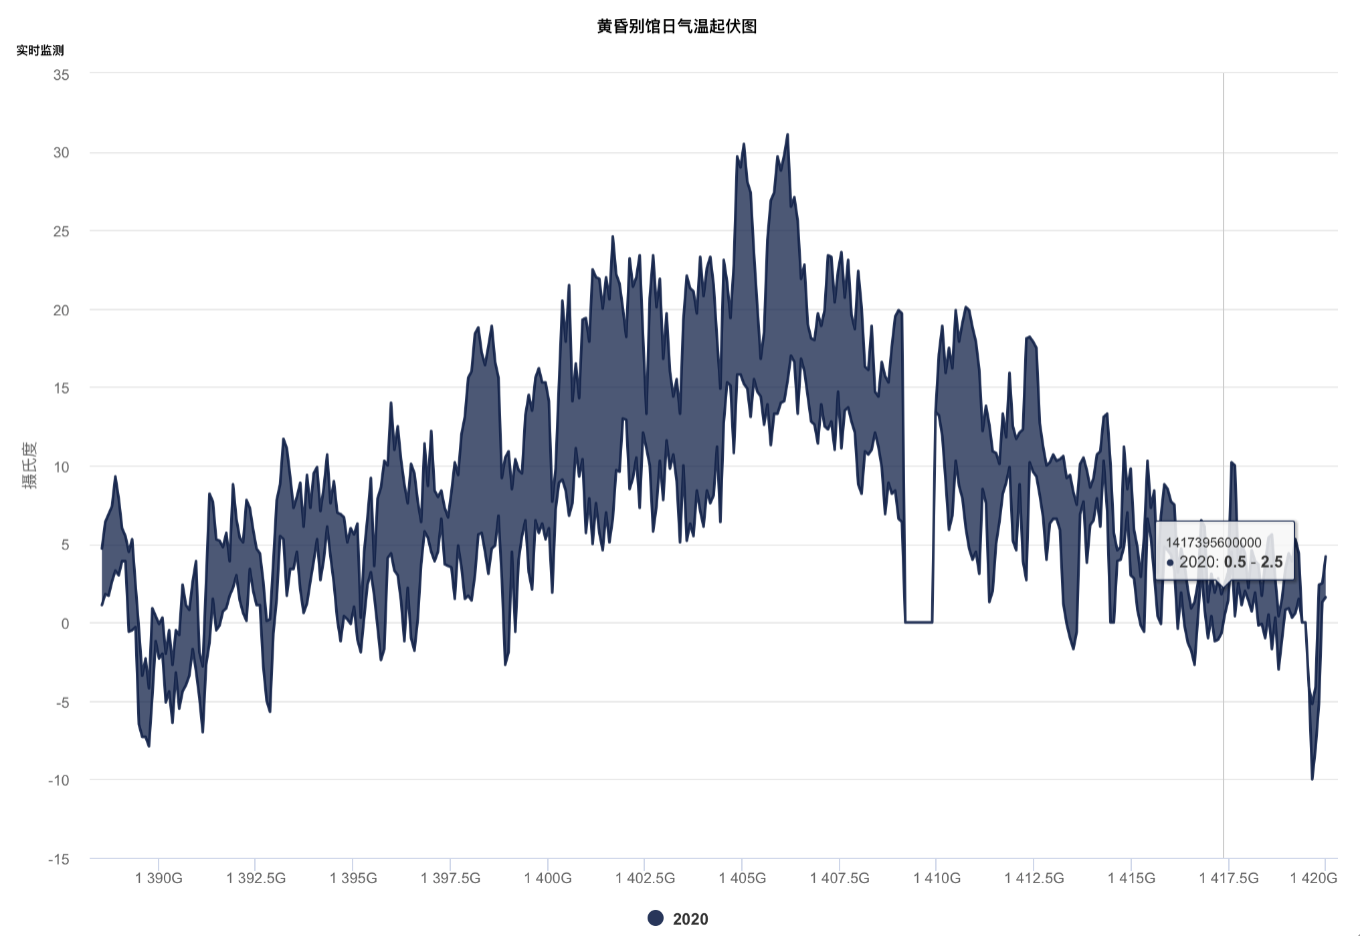
chart with value range segmentation
lines 🧶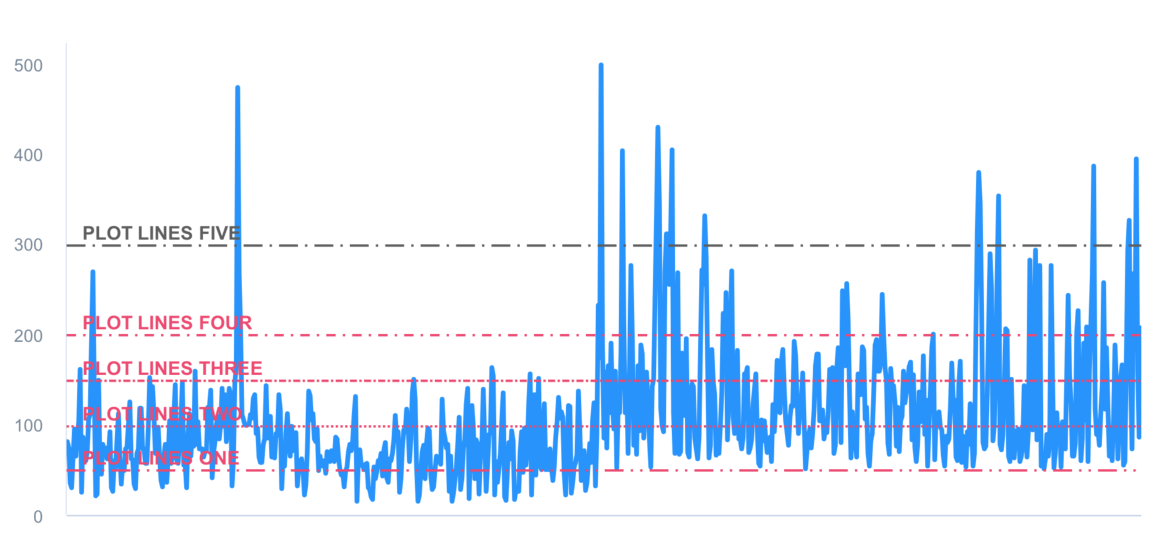
-
chart with value range segmentation
zones 🧱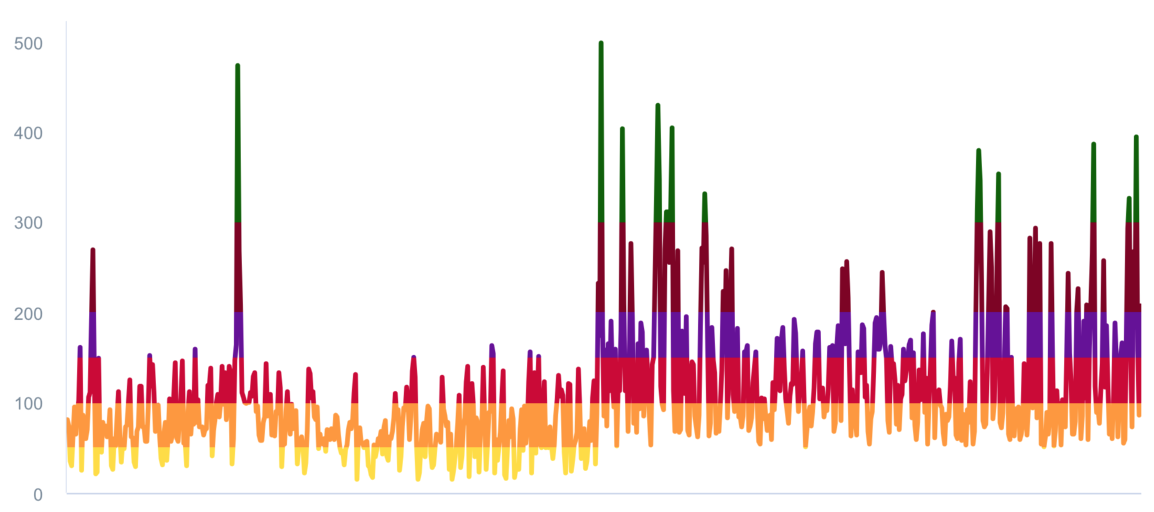
typedef NSString *AAChartType;
AACHARTKIT_EXTERN AAChartType const AAChartTypeColumn; //column chart
AACHARTKIT_EXTERN AAChartType const AAChartTypeBar; //bar chart
AACHARTKIT_EXTERN AAChartType const AAChartTypeArea; //area chart
AACHARTKIT_EXTERN AAChartType const AAChartTypeAreaspline; //area spline chart
AACHARTKIT_EXTERN AAChartType const AAChartTypeLine; //line chart
AACHARTKIT_EXTERN AAChartType const AAChartTypeSpline; //spline chart
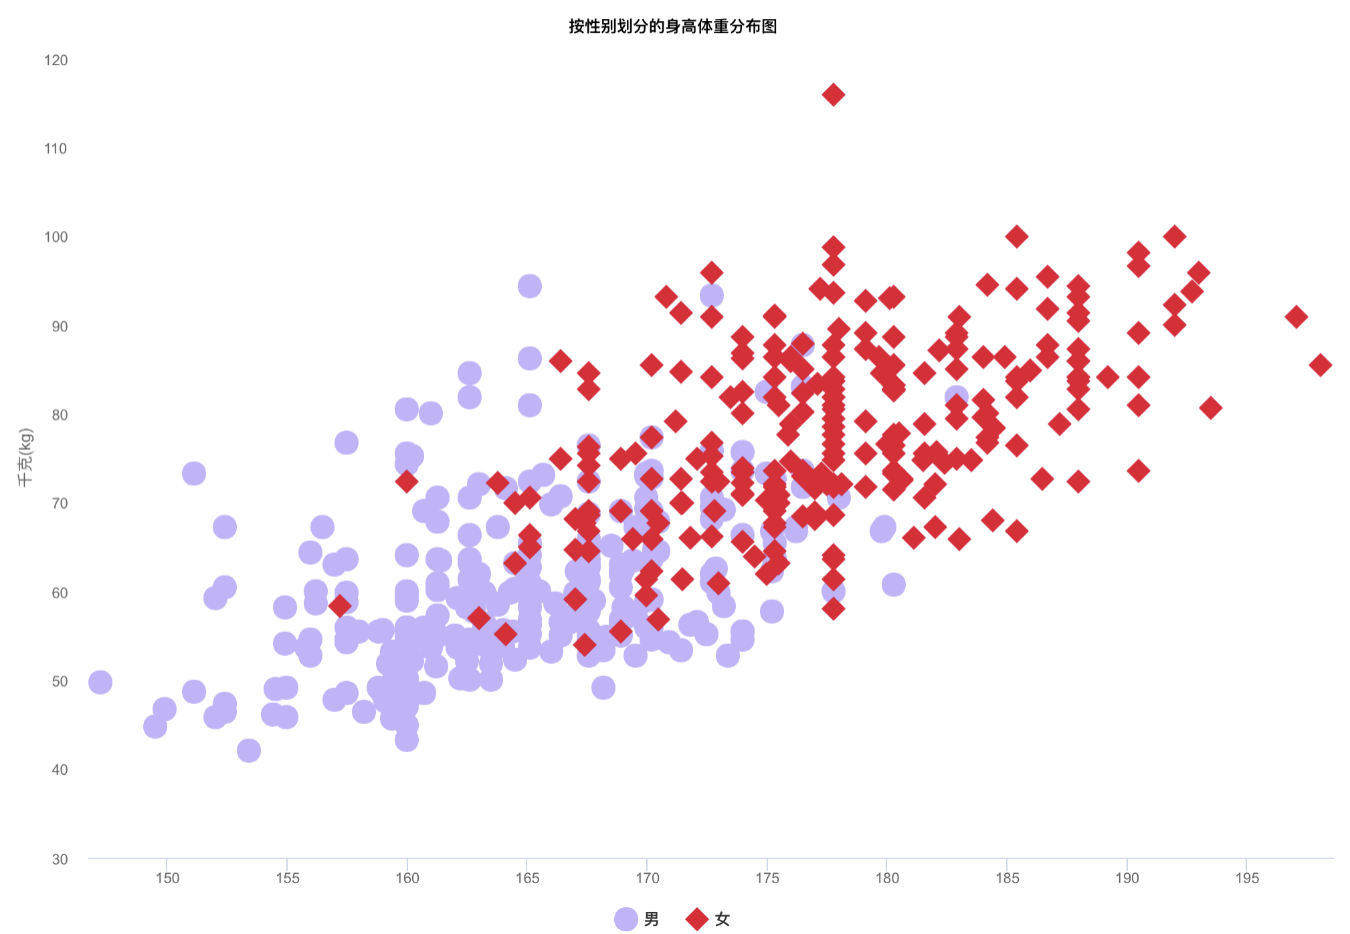
AACHARTKIT_EXTERN AAChartType const AAChartTypeScatter; //scatter chart
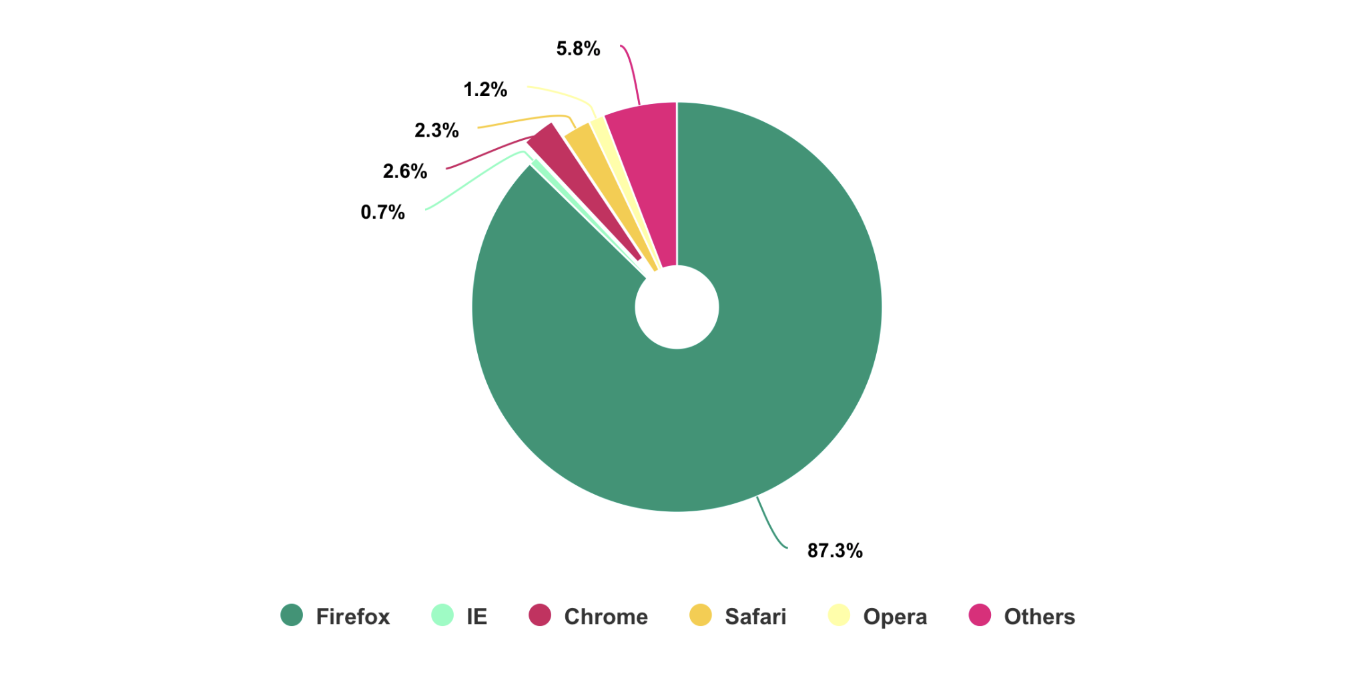
AACHARTKIT_EXTERN AAChartType const AAChartTypePie; //pie chart
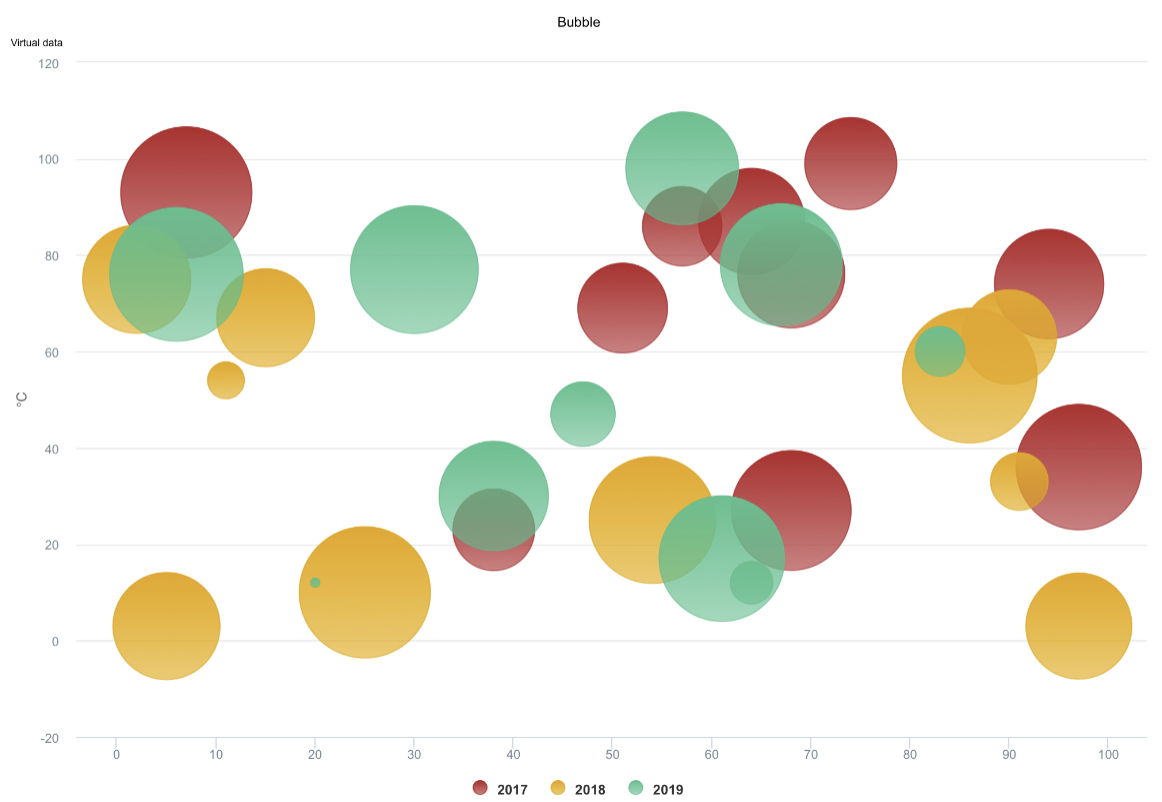
AACHARTKIT_EXTERN AAChartType const AAChartTypeBubble; //bubble chart
AACHARTKIT_EXTERN AAChartType const AAChartTypePyramid; //pyramid chart
AACHARTKIT_EXTERN AAChartType const AAChartTypeFunnel; //funnel chart
AACHARTKIT_EXTERN AAChartType const AAChartTypeColumnrange; //column range chart
AACHARTKIT_EXTERN AAChartType const AAChartTypeArearange; //area range chart
AACHARTKIT_EXTERN AAChartType const AAChartTypeAreasplinerange; //area spline range chart
AACHARTKIT_EXTERN AAChartType const AAChartTypeBoxplot; //box plot chart
AACHARTKIT_EXTERN AAChartType const AAChartTypeWaterfall; //Waterfall chart
AACHARTKIT_EXTERN AAChartType const AAChartTypePolygon; //polygon chart
AACHARTKIT_EXTERN AAChartType const AAChartTypeGauge; //gauge chart
AACHARTKIT_EXTERN AAChartType const AAChartTypeErrorbar; //error bar charttypedef NSString *AAChartZoomType;
AACHARTKIT_EXTERN AAChartZoomType const AAChartZoomTypeNone;
AACHARTKIT_EXTERN AAChartZoomType const AAChartZoomTypeX;
AACHARTKIT_EXTERN AAChartZoomType const AAChartZoomTypeY;
AACHARTKIT_EXTERN AAChartZoomType const AAChartZoomTypeXY;AACHARTKIT_EXTERN AAChartLineDashStyleType const AAChartLineDashStyleTypeSolid; //———————————————————————————————————
AACHARTKIT_EXTERN AAChartLineDashStyleType const AAChartLineDashStyleTypeShortDash; //— — — — — — — — — — — — — — — — — —
AACHARTKIT_EXTERN AAChartLineDashStyleType const AAChartLineDashStyleTypeShortDot; //ⵈⵈⵈⵈⵈⵈⵈⵈⵈⵈⵈⵈⵈⵈⵈⵈⵈⵈⵈⵈⵈⵈⵈⵈⵈⵈⵈⵈ
AACHARTKIT_EXTERN AAChartLineDashStyleType const AAChartLineDashStyleTypeShortDashDot; //—‧—‧—‧—‧—‧—‧—‧—‧—‧—‧—‧—‧—‧—‧—‧—‧—‧—‧
AACHARTKIT_EXTERN AAChartLineDashStyleType const AAChartLineDashStyleTypeShortDashDotDot; //—‧‧—‧‧—‧‧—‧‧—‧‧—‧‧—‧‧—‧‧—‧‧—‧‧—‧‧—‧‧
AACHARTKIT_EXTERN AAChartLineDashStyleType const AAChartLineDashStyleTypeDot; //‧‧‧‧‧‧‧‧‧‧‧‧‧‧‧‧‧‧‧‧‧‧‧‧‧‧‧‧‧‧‧‧‧‧‧
AACHARTKIT_EXTERN AAChartLineDashStyleType const AAChartLineDashStyleTypeDash; //—— —— —— —— —— —— —— —— —— —— —— ——
AACHARTKIT_EXTERN AAChartLineDashStyleType const AAChartLineDashStyleTypeLongDash; //——— ——— ——— ——— ——— ——— ——— ——— ———
AACHARTKIT_EXTERN AAChartLineDashStyleType const AAChartLineDashStyleTypeDashDot; //——‧——‧——‧——‧——‧——‧——‧——‧——‧——‧——‧——‧
AACHARTKIT_EXTERN AAChartLineDashStyleType const AAChartLineDashStyleTypeLongDashDot; //———‧———‧———‧———‧———‧———‧———‧———‧———‧
AACHARTKIT_EXTERN AAChartLineDashStyleType const AAChartLineDashStyleTypeLongDashDotDot; //———‧‧———‧‧———‧‧———‧‧———‧‧———‧‧———‧‧typedef NS_ENUM(NSInteger,AAChartAnimation) {
AAChartAnimationLinear = 0,
AAChartAnimationEaseInQuad,
AAChartAnimationEaseOutQuad,
AAChartAnimationEaseInOutQuad,
AAChartAnimationEaseInCubic,
AAChartAnimationEaseOutCubic,
AAChartAnimationEaseInOutCubic,
AAChartAnimationEaseInQuart,
AAChartAnimationEaseOutQuart,
AAChartAnimationEaseInOutQuart,
AAChartAnimationEaseInQuint,
AAChartAnimationEaseOutQuint,
AAChartAnimationEaseInOutQuint,
AAChartAnimationEaseInSine,
AAChartAnimationEaseOutSine,
AAChartAnimationEaseInOutSine,
AAChartAnimationEaseInExpo,
AAChartAnimationEaseOutExpo,
AAChartAnimationEaseInOutExpo,
AAChartAnimationEaseInCirc,
AAChartAnimationEaseOutCirc,
AAChartAnimationEaseInOutCirc,
AAChartAnimationEaseOutBounce,
AAChartAnimationEaseInBack,
AAChartAnimationEaseOutBack,
AAChartAnimationEaseInOutBack,
AAChartAnimationElastic,
AAChartAnimationSwingFromTo,
AAChartAnimationSwingFrom,
AAChartAnimationSwingTo,
AAChartAnimationBounce,
AAChartAnimationBouncePast,
AAChartAnimationEaseFromTo,
AAChartAnimationEaseFrom,
AAChartAnimationEaseTo,
};
Here are the ten concrete animation types of AAChartKit
| Back | Bounce | Circ | Cubic | Elastic |
|---|---|---|---|---|
 |
 |
 |
 |
 |
| Expo | Quad | Quart | Quint | Sine |
|---|---|---|---|---|
 |
 |
 |
 |
 |
AAPropStatementAndPropSetFuncStatement(copy,   AAChartModel, NSString *, title)
AAPropStatementAndPropSetFuncStatement(strong, AAChartModel, AAStyle  *, titleStyle)

AAPropStatementAndPropSetFuncStatement(copy,   AAChartModel, NSString *, subtitle)
AAPropStatementAndPropSetFuncStatement(strong, AAChartModel, AAStyle  *, subtitleStyle)
AAPropStatementAndPropSetFuncStatement(copy,   AAChartModel, AAChartAlignType, subtitleAlign)

AAPropStatementAndPropSetFuncStatement(copy,   AAChartModel, NSString *, backgroundColor)
AAPropStatementAndPropSetFuncStatement(strong, AAChartModel, NSArray  *, colorsTheme)
AAPropStatementAndPropSetFuncStatement(strong, AAChartModel, NSArray     <NSString *>*, categories)
AAPropStatementAndPropSetFuncStatement(strong, AAChartModel, NSArray  *, series)

AAPropStatementAndPropSetFuncStatement(copy,   AAChartModel, AAChartType,            chartType)
AAPropStatementAndPropSetFuncStatement(copy,   AAChartModel, AAChartStackingType,    stacking)
AAPropStatementAndPropSetFuncStatement(copy,   AAChartModel, AAChartSymbolType,      markerSymbol)
AAPropStatementAndPropSetFuncStatement(assign, AAChartModel, AAChartSymbolStyleType, markerSymbolStyle)
AAPropStatementAndPropSetFuncStatement(copy,   AAChartModel, AAChartZoomType,        zoomType)

AAPropStatementAndPropSetFuncStatement(assign, AAChartModel, AAChartAnimation,       animationType)
AAPropStatementAndPropSetFuncStatement(strong, AAChartModel, NSNumber *, animationDuration)
AAPropStatementAndPropSetFuncStatement(assign, AAChartModel, BOOL,       inverted)
AAPropStatementAndPropSetFuncStatement(assign, AAChartModel, BOOL,       polar)
AAPropStatementAndPropSetFuncStatement(strong, AAChartModel, NSArray  *, margin)

AAPropStatementAndPropSetFuncStatement(assign, AAChartModel, BOOL,       dataLabelsEnabled)
AAPropStatementAndPropSetFuncStatement(strong, AAChartModel, AAStyle  *, dataLabelsStyle)

AAPropStatementAndPropSetFuncStatement(assign, AAChartModel, BOOL,       xAxisVisible)
AAPropStatementAndPropSetFuncStatement(assign, AAChartModel, BOOL,       xAxisReversed)
AAPropStatementAndPropSetFuncStatement(assign, AAChartModel, BOOL,       xAxisLabelsEnabled)
AAPropStatementAndPropSetFuncStatement(strong, AAChartModel, AAStyle  *, xAxisLabelsStyle)
AAPropStatementAndPropSetFuncStatement(strong, AAChartModel, NSNumber *, xAxisTickInterval)
AAPropStatementAndPropSetFuncStatement(strong, AAChartModel, AALineStyle *, xAxisGridLineStyle)
AAPropStatementAndPropSetFuncStatement(strong, AAChartModel, AACrosshair *, xAxisCrosshair)

AAPropStatementAndPropSetFuncStatement(assign, AAChartModel, BOOL,       yAxisVisible)
AAPropStatementAndPropSetFuncStatement(assign, AAChartModel, BOOL,       yAxisReversed)
AAPropStatementAndPropSetFuncStatement(assign, AAChartModel, BOOL,       yAxisLabelsEnabled)
AAPropStatementAndPropSetFuncStatement(strong, AAChartModel, AAStyle  *, yAxisLabelsStyle)
AAPropStatementAndPropSetFuncStatement(copy,   AAChartModel, NSString *, yAxisTitle)
AAPropStatementAndPropSetFuncStatement(strong, AAChartModel, NSNumber *, yAxisLineWidth)
AAPropStatementAndPropSetFuncStatement(assign, AAChartModel, BOOL,       yAxisAllowDecimals)
AAPropStatementAndPropSetFuncStatement(strong, AAChartModel, NSArray  *, yAxisPlotLines)
AAPropStatementAndPropSetFuncStatement(strong, AAChartModel, NSNumber *, yAxisMax)
AAPropStatementAndPropSetFuncStatement(strong, AAChartModel, NSNumber *, yAxisMin)
AAPropStatementAndPropSetFuncStatement(strong, AAChartModel, NSNumber *, yAxisTickInterval)
AAPropStatementAndPropSetFuncStatement(strong, AAChartModel, NSArray  *, yAxisTickPositions)
AAPropStatementAndPropSetFuncStatement(strong, AAChartModel, AALineStyle *, yAxisGridLineStyle)
AAPropStatementAndPropSetFuncStatement(strong, AAChartModel, AACrosshair *, yAxisCrosshair)

AAPropStatementAndPropSetFuncStatement(assign, AAChartModel, BOOL,       tooltipEnabled)
AAPropStatementAndPropSetFuncStatement(assign, AAChartModel, BOOL,       tooltipShared)
AAPropStatementAndPropSetFuncStatement(copy,   AAChartModel, NSString *, tooltipValueSuffix)

AAPropStatementAndPropSetFuncStatement(assign, AAChartModel, BOOL,       connectNulls)
AAPropStatementAndPropSetFuncStatement(assign, AAChartModel, BOOL,       legendEnabled)
AAPropStatementAndPropSetFuncStatement(strong, AAChartModel, NSNumber *, borderRadius)
AAPropStatementAndPropSetFuncStatement(strong, AAChartModel, NSNumber *, markerRadius)
AAPropStatementAndPropSetFuncStatement(strong, AAChartModel, AAScrollablePlotArea *, scrollablePlotArea)

                         _0_
                       _oo0oo_
                      o8888888o
                      88" . "88
                      (| -_- |)
                      0\  =  /0
                    ___/`---'\___
                  .' \\|     |// '.
                 / \\|||  :  |||// \
                / _||||| -:- |||||- \
               |   | \\\  -  /// |   |
               | \_|  ''\---/''  |_/ |
               \  .-\__  '-'  ___/-. /
             ___'. .'  /--.--\  `. .'___
          ."" '<  `.___\_<|>_/___.' >' "".
         | | :  `- \`.;`\ _ /`;.`/ - ` : | |
         \  \ `_.   \_ __\ /__ _/   .-` /  /
     =====`-.____`.___ \_____/___.-`___.-'=====
                       `=---='
*****************************************************
     ¥¥¥¥¥¥¥¥¥¥¥¥¥¥¥¥¥¥¥¥¥¥¥¥¥¥¥¥¥¥¥¥¥¥¥¥¥¥¥¥¥¥¥
         €€€€€€€€€€€€€€€€€€€€€€€€€€€€€€€€€€
               $$$$$$$$$$$$$$$$$$$$$$$
                   BUDDHA_BLESS_YOU
                      AWAY_FROM
BUG| Language Version | Project Name | Target Platform | Source Code Link |
|---|---|---|---|
| Swift | AAInfographics | iOS | https://github.com/AAChartModel/AAChartKit-Swift |
| Objective C | AAChartKit | iOS | https://github.com/AAChartModel/AAChartKit |
| Kotlin | AAInfographics | Android | https://github.com/AAChartModel/AAChartCore-Kotlin |
| Java | AAChartCore | Android | https://github.com/AAChartModel/AAChartCore |
Pro Versions are more powerful data visualization frameworks that support more types beautiful chart like bellcurve, bullet, columnpyramid, cylinder, dependencywheel, heatmap, histogram, networkgraph, organization, packedbubble, pareto, sankey, series, solidgauge, streamgraph, sunburst, tilemap, timeline, treemap, variablepie, variwide, vector, venn, windbarb, wordcloud, xrange charts and so on.
| Language | Project Name | Target Platform | Source Code Link |
|---|---|---|---|
| Swift | AAInfographics-Pro | iOS | https://github.com/AAChartModel/AAChartKit-Swift-Pro |
| Objective C | AAChartKit-Pro | iOS | https://github.com/AAChartModel/AAChartKit-Pro |
| Kotlin | AAInfographics-Pro | Android | Coming Soon... |
| Java | AAChartCore-Pro | Android | Coming Soon... |
AAChartKit is available under the MIT license. See the LICENSE file for more information.
- 🌕 🌖 🌗 🌘 WARM TIPS!!! 🌑 🌒 🌓 🌔
- Please contact me on GitHub, if there are any problems encountered in use.
- GitHub Issues : https://github.com/AAChartModel/AAChartKit/issues
- And if you want to contribute for this project, please contact me as well
- GitHub : https://github.com/AAChartModel
- StackOverflow : https://stackoverflow.com/users/12302132
- JianShu : http://www.jianshu.com/u/f1e6753d4254
- SegmentFault : https://segmentfault.com/u/huanghunbieguan
- Support user to add delegate events after the graphics content loading was completed
- Support graphics to refresh global content dynamically
- Support graphics to refresh pure data (
series) content dynamically - Support graphics to refresh pure data in real time and scroll dynamically
- Support color layer gradient effects
- Support 3D graphics effects, valid only for partial graphics such as
column chart、bar chart、pie charts、scatterplot chart、bubble chart, etc. - Support
CocoaPods - Support
Carthage - Support setting graphics rendering animation freely
- Support user to configure
AAOptionsmodel object properties freely - Support stacking the graphics
- Support reversing the graphics axis
- Support rendering scatter chart
- Support rendering column range map
- Support rendering area range graph
- Support rendering the polar chart
- Support rendering the step line chart
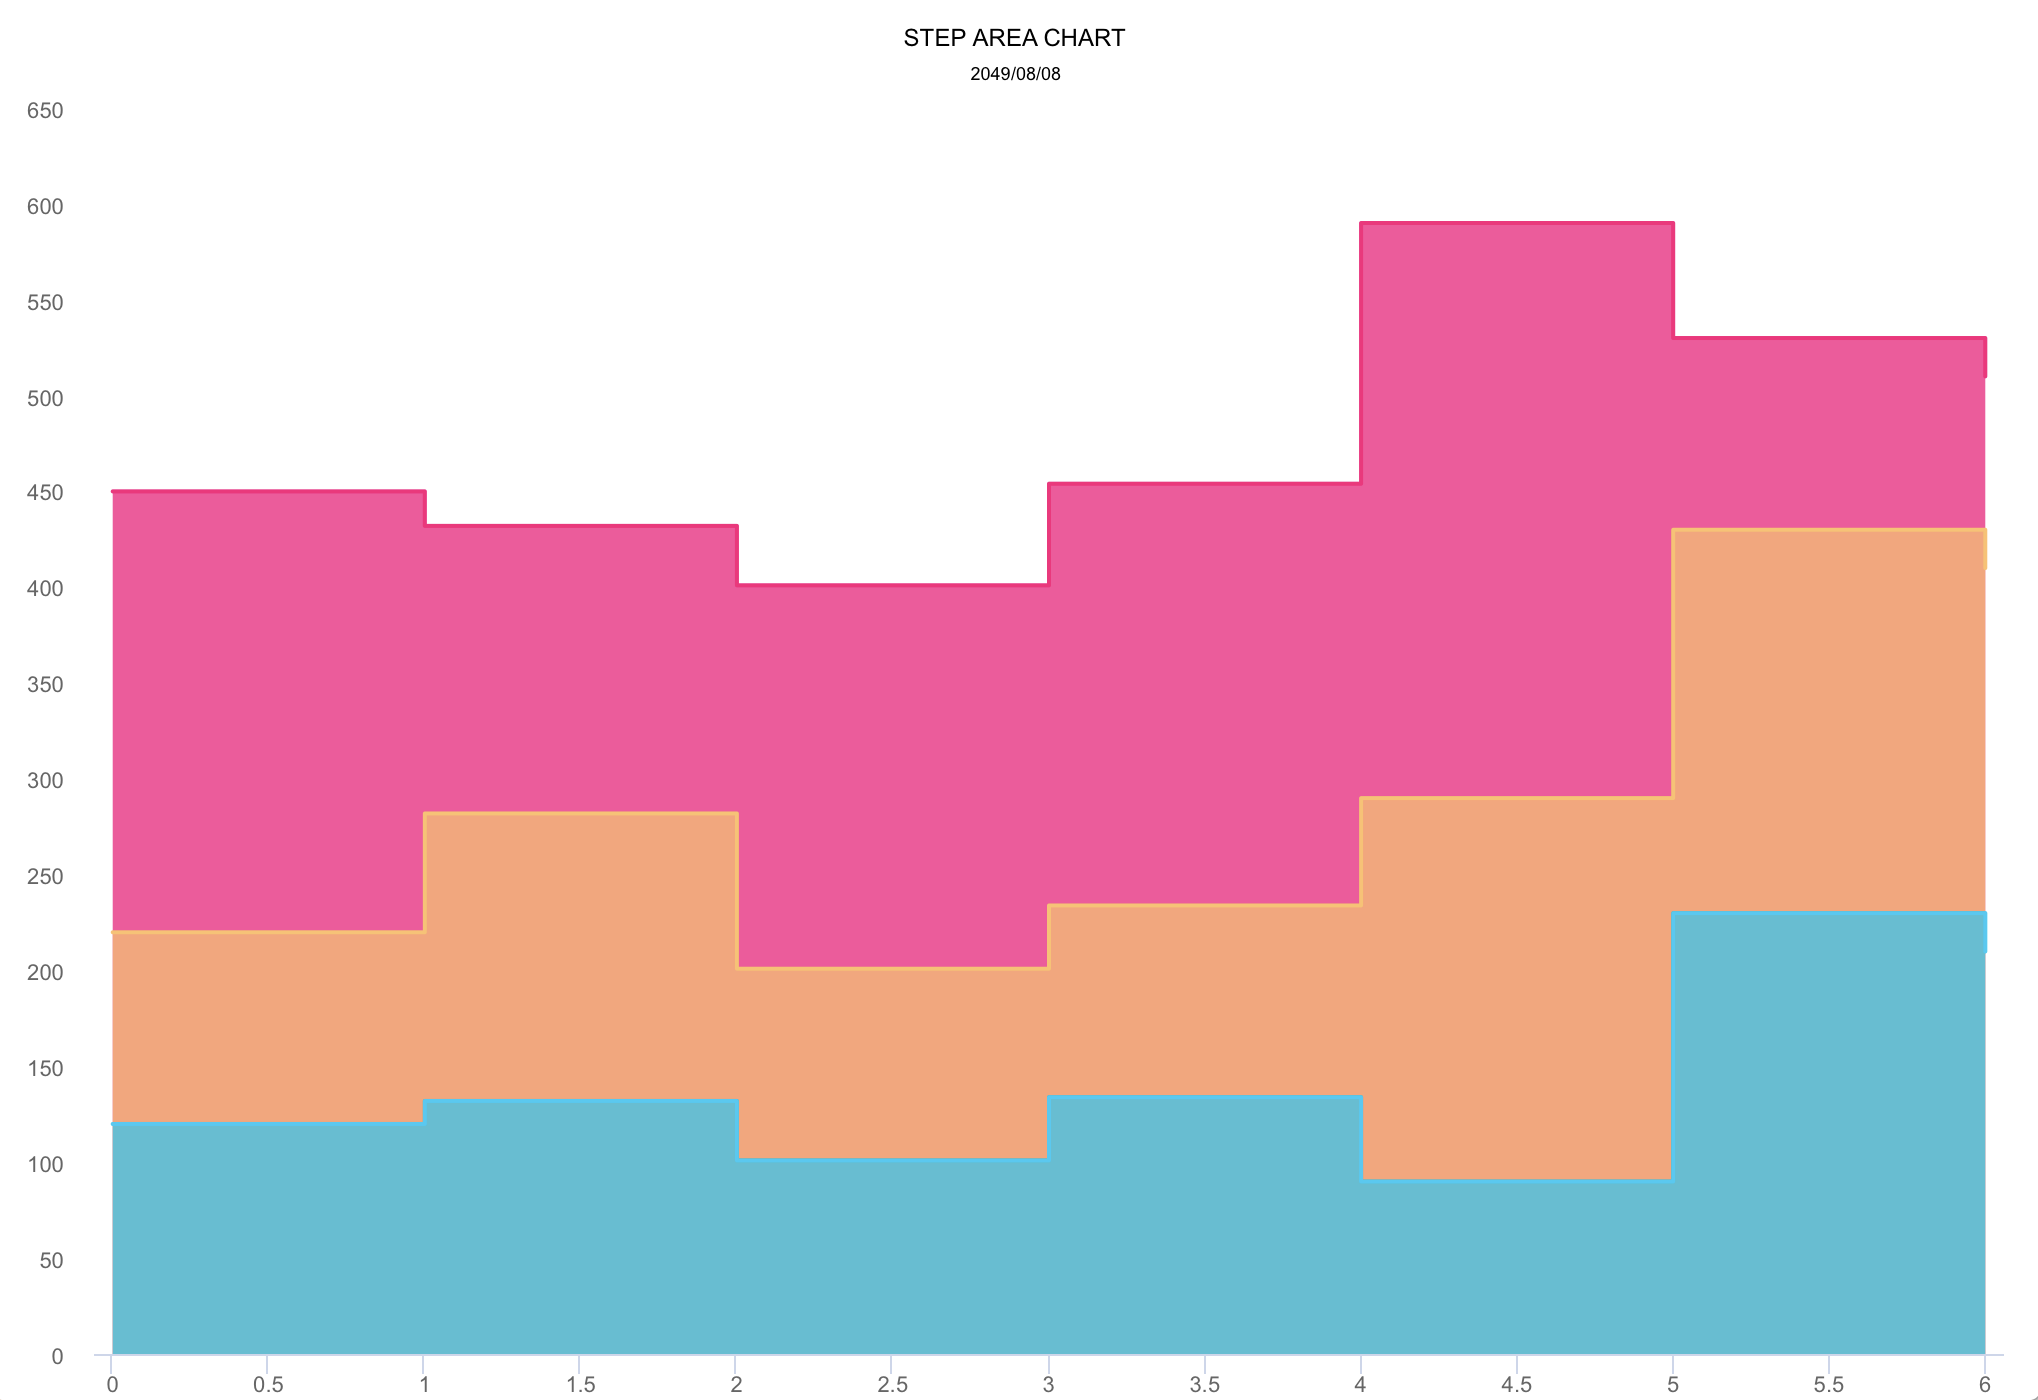
- Support rendering the step area chart
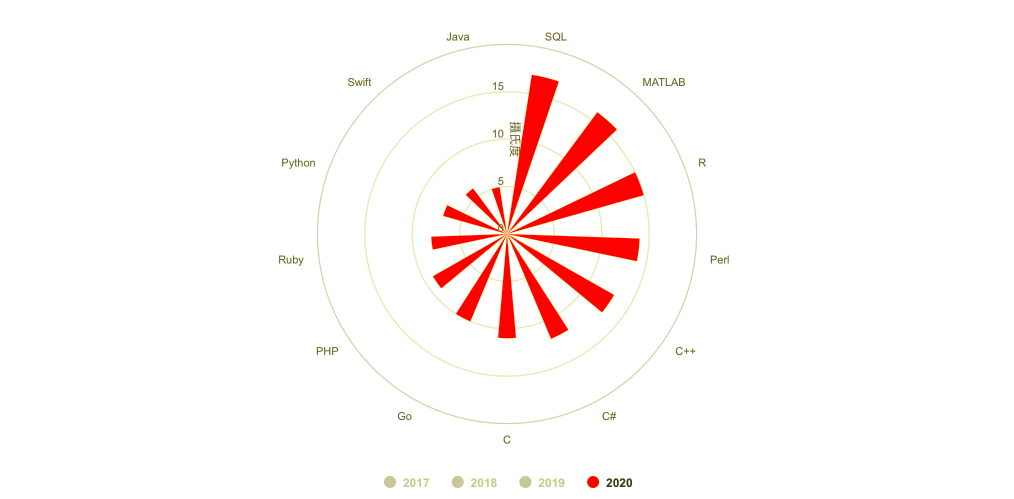
- Support rendering the Nightingale rose 🌹chart
- Support rendering the circular progress bar chart
- Support adding clicked event callbacks for graphics
- Support adding finger✋🏻 or mouse🖱 move over event callbacks for graphics
- Support code coverage test