Coder Social home page Coder Social logo

r-lidar / lidr Goto Github PK

View Code? Open in Web Editor NEW
565.0 51.0 129.0 37.44 MB

Airborne LiDAR data manipulation and visualisation for forestry application

Home Page: https://CRAN.R-project.org/package=lidR

License: GNU General Public License v3.0

R 78.03% C++ 21.95% C 0.02%
point-cloud lidar las laz r als forestry remote-sensing

lidr's Introduction

lidR

license R build status Codecov test coverage

R package for Airborne LiDAR Data Manipulation and Visualization for Forestry Applications

The lidR package provides functions to read and write .las and .laz files, plot point clouds, compute metrics using an area-based approach, compute digital canopy models, thin LiDAR data, manage a collection of LAS/LAZ files, automatically extract ground inventories, process a collection of tiles using multicore processing, segment individual trees, classify points from geographic data, and provides other tools to manipulate LiDAR data in a research and development context.

📖 Read the book to get started with the lidR package. See changelogs on NEW.md

To cite the package use citation() from within R:

citation("lidR")
#> Roussel, J.R., Auty, D., Coops, N. C., Tompalski, P., Goodbody, T. R. H., Sánchez Meador, A., Bourdon, J.F., De Boissieu, F., Achim, A. (2021). lidR : An R package for analysis of Airborne Laser Scanning (ALS) data. Remote Sensing of Environment, 251 (August), 112061. <doi:10.1016/j.rse.2020.112061>.
#> Jean-Romain Roussel and David Auty (2023). Airborne LiDAR Data Manipulation and Visualization for Forestry Applications. R package version 3.1.0. https://cran.r-project.org/package=lidR

Key features

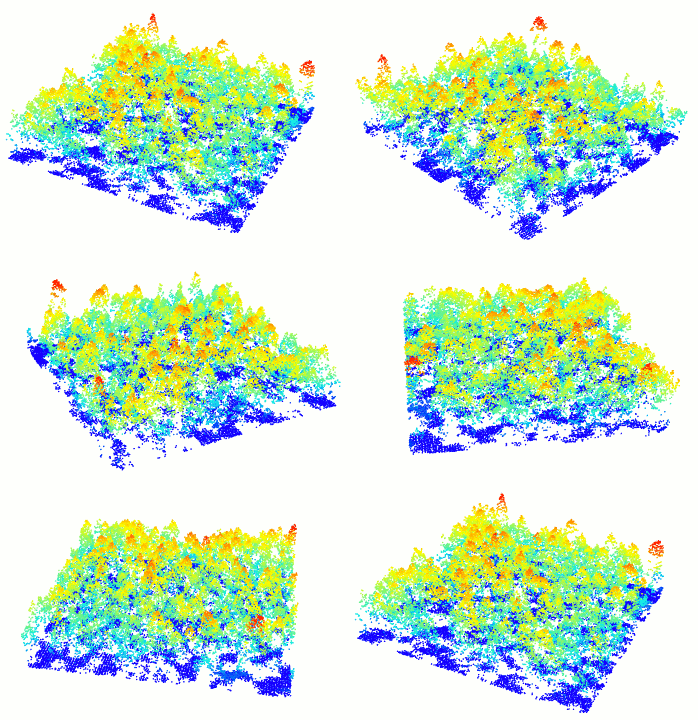
Read and display a las file

In R-fashion style the function plot, based on rgl, enables the user to display, rotate and zoom a point cloud. Because rgl has limited capabilities with respect to large datasets, we also made a package lidRviewer with better display capabilities.

las <- readLAS("<file.las>")
plot(las)

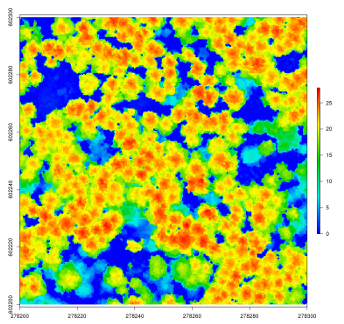
Compute a canopy height model

lidR has several algorithms from the literature to compute canopy height models either point-to-raster based or triangulation based. This allows testing and comparison of some methods that rely on a CHM, such as individual tree segmentation or the computation of a canopy roughness index.

las <- readLAS("<file.las>")

# Khosravipour et al. pitfree algorithm
thr <- c(0,2,5,10,15)
edg <- c(0, 1.5)
chm <- rasterize_canopy(las, 1, pitfree(thr, edg))

plot(chm)

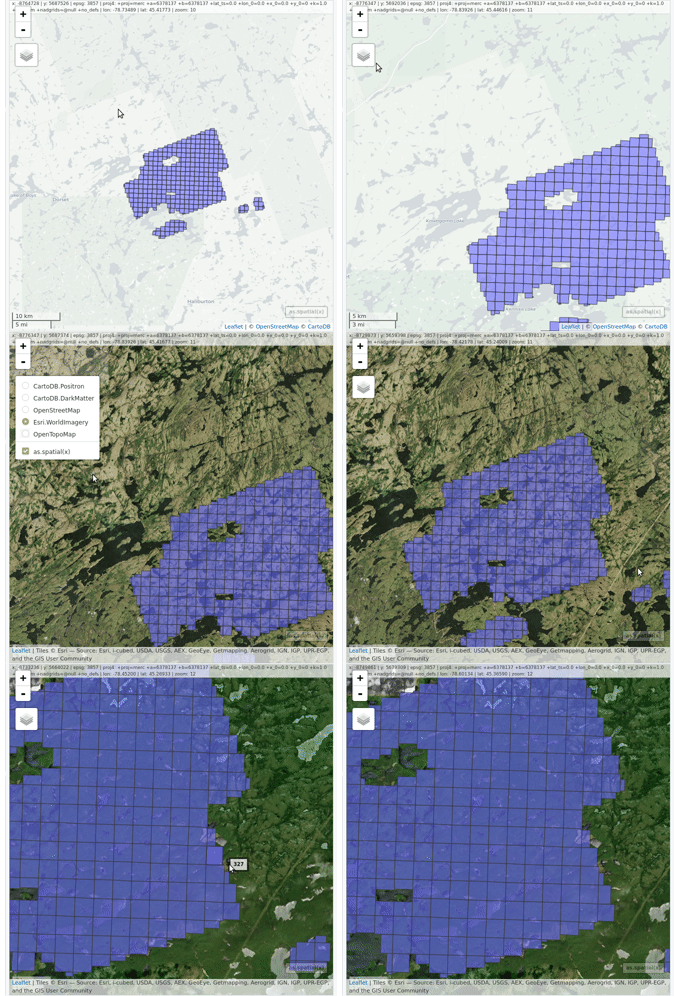
Read and display a catalog of las files

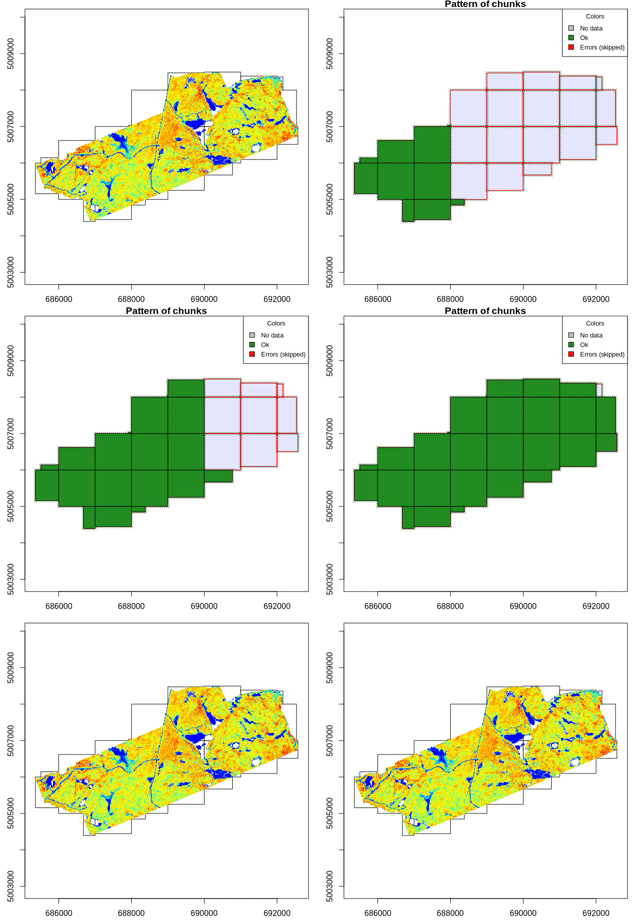
lidR enables the user to manage, use and process a collection of las files. The function readLAScatalog builds a LAScatalog object from a folder. The function plot displays this collection on an interactive map using the mapview package (if installed).

ctg <- readLAScatalog("<folder/>")
plot(ctg, map = TRUE)

From a LAScatalog object the user can (for example) extract some regions of interest (ROI) with clip_roi(). Using a catalog for the extraction of the ROI guarantees fast and memory-efficient clipping. LAScatalog objects allow many other manipulations that can be done with multicore processing.

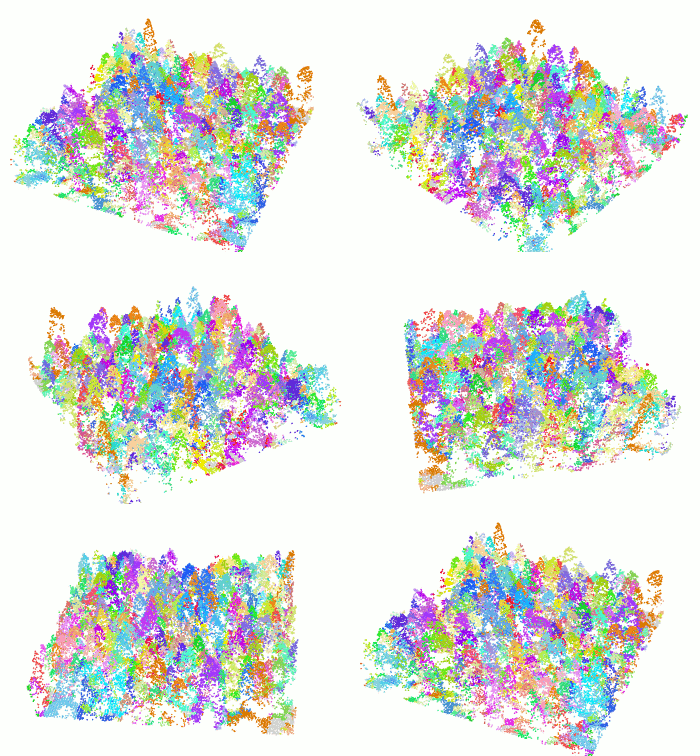
Individual tree segmentation

The segment_trees() function has several algorithms from the literature for individual tree segmentation, based either on the digital canopy model or on the point-cloud. Each algorithm has been coded from the source article to be as close as possible to what was written in the peer-reviewed papers. Our goal is to make published algorithms usable, testable and comparable.

las <- readLAS("<file.las>")

las <- segment_trees(las, li2012())
col <- random.colors(200)
plot(las, color = "treeID", colorPalette = col)

Wall-to-wall dataset processing

Most of the lidR functions can seamlessly process a set of tiles and return a continuous output. Users can create their own methods using the LAScatalog processing engine via the catalog_apply() function. Among other features the engine takes advantage of point indexation with lax files, takes care of processing tiles with a buffer and allows for processing big files that do not fit in memory.

# Load a LAScatalog instead of a LAS file
ctg <- readLAScatalog("<path/to/folder/>")

# Process it like a LAS file
chm <- rasterize_canopy(ctg, 2, p2r())
col <- random.colors(50)
plot(chm, col = col)

Full waveform

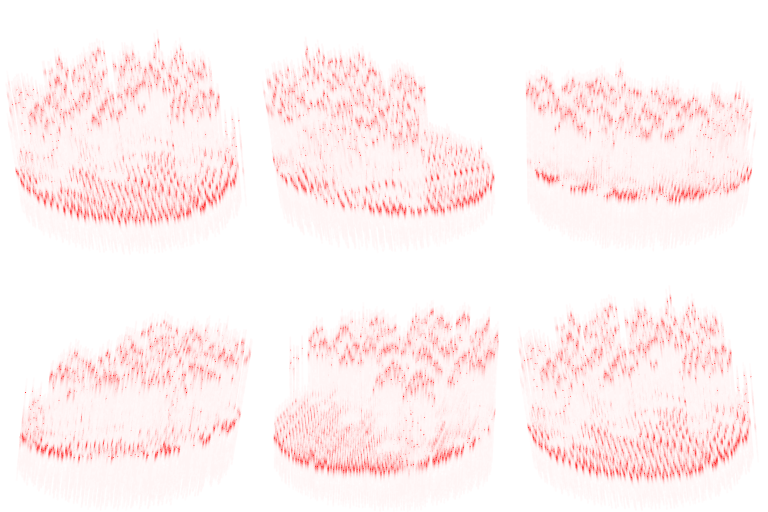
lidR can read full waveform data from LAS files and provides interpreter functions to convert the raw data into something easier to manage and display in R. The support of FWF is still in the early stages of development.

fwf <- readLAS("<fullwaveform.las>")

# Interpret the waveform into something easier to manage
las <- interpret_waveform(fwf)

# Display discrete points and waveforms
x <- plot(fwf, colorPalette = "red", bg = "white")
plot(las, color = "Amplitude", add = x)

About

lidR is developed openly at Laval University.

Install lidR dependencies on GNU/Linux

# Ubuntu
sudo add-apt-repository ppa:ubuntugis/ubuntugis-unstable
sudo apt-get update
sudo apt-get install libgdal-dev libgeos++-dev libudunits2-dev libproj-dev libx11-dev libgl1-mesa-dev libglu1-mesa-dev libfreetype6-dev libxt-dev libfftw3-dev

# Fedora
sudo dnf install gdal-devel geos-devel udunits2-devel proj-devel mesa-libGL-devel mesa-libGLU-devel freetype-devel libjpeg-turbo-devel


lidr's People

Contributors

bi0m3trics avatar bw4sz avatar cjber avatar daveauty avatar dmurdoch avatar floriandeboissieu avatar jean-romain avatar jfbourdon avatar lenostatos avatar marcfletcher-hqp avatar mikoontz avatar neteler avatar ptompalski avatar rsbivand avatar waltersom avatar

Stargazers

 avatar  avatar  avatar  avatar  avatar  avatar  avatar  avatar  avatar  avatar  avatar  avatar  avatar  avatar  avatar  avatar  avatar  avatar  avatar  avatar  avatar  avatar  avatar  avatar  avatar  avatar  avatar  avatar  avatar  avatar  avatar  avatar  avatar  avatar  avatar  avatar  avatar  avatar  avatar  avatar  avatar  avatar  avatar  avatar  avatar  avatar  avatar  avatar  avatar  avatar  avatar  avatar  avatar  avatar  avatar  avatar  avatar  avatar  avatar  avatar  avatar  avatar  avatar  avatar  avatar  avatar  avatar  avatar  avatar  avatar  avatar  avatar  avatar  avatar  avatar  avatar  avatar  avatar  avatar  avatar  avatar  avatar  avatar  avatar  avatar  avatar  avatar  avatar  avatar  avatar  avatar  avatar  avatar  avatar  avatar  avatar  avatar  avatar  avatar  avatar

Watchers

 avatar  avatar  avatar  avatar  avatar  avatar  avatar  avatar  avatar  avatar  avatar  avatar  avatar  avatar  avatar  avatar  avatar  avatar  avatar  avatar  avatar  avatar  avatar  avatar  avatar  avatar  avatar  avatar  avatar  avatar  avatar  avatar  avatar  avatar  avatar  avatar  avatar  avatar  avatar  avatar  avatar  avatar  avatar  avatar  avatar  avatar  avatar  avatar  avatar  avatar  avatar

lidr's Issues

writeLAS and `Header Size`

Hi,

I have a tile with a 'header size of 235. However when i save this file using writeLAS it is changing the 'Header size to 227. This is creating errors when i re-import the tile:

WARNING: for LAS 1.� header_size should at least be 235 but it is only 227
Warning messages:
1: Invalid file: header states the file contains 11221946 1st returns but 16096836 were found. Header has been updated.
2: Invalid file: header states the file contains 8310139 2nd returns but 9559154 were found. Header has been updated.
3: Invalid file: header states the file contains 4354005 3rd returns but 0 were found. Header has been updated.
4: Invalid file: header states the file contains 1439017 4th returns but 0 were found. Header has been updated.
5: Invalid file: header states the file contains 288440 5th returns but 0 were found. Header has been updated.

I have tried to re-import the file using LASTools, so I suspect the header size is being changed during writeLAS. The result is a corrupted file when saving.

The tile causing the issue is new (Version 1.3). We spoke with Martin Isenburg and he recommended the writeLAS needs to be set at Version 1.2 to avoid this error. We are wondering what the current setup is for writeLAS in the lidR package.

Thanks.

Missing argument in function stdmetrics

Hi I use lidR 1.10, and noticed that the cumulated intensity below height percentiles are different if you obtain them with stdmetrics or directly with stdmetrics_i. Maybe it is because of missing z argument in stdmetrics:

I = stdmetrics_i(i, z, class, rn)

instead of

I = stdmetrics_i(i, class, rn)

methods instaead of functions

Hi Jean-Romain,
the use of stopifnotlas is preventing from any class inheritance. Is there any reason you do not define them as methods for LAS object?
Cheers,
Florian

Readme argument inconsistency

Just been going through the read me and noticed that the argument res is listed as resolution for the function lasdecimate.

Tom

plot

When plotting it seems that by default all points are plotted, which seems a little impractical for even moderately sized las files. It might be better to decimate as standard for files over a certain size and include an argument to override this.

Tom

Review documentation for v1.2.1

  • NEWS.md
  • grid_tincanopy.r
  • metrics.r
  • metric_canopy_roughness.r
  • option.r
  • tree_metrics.r

In addition there are several messages spread in the codes and displayed when the option verbose = TRUE. Find them all with grep "verbose" *.r

gapFractionProfile for some dz

i like this function.

it works for for some dz, but for others i get this error.

Error in hist.default(z, breaks = bk, plot = F) :
some 'x' not counted; maybe 'breaks' do not span range of 'x'

for example the function would work for dz=1.9 and dz=2.1, but not for dz=2.

looking at code this error is coming from the hist() function. im not sure what the trigger is.

Bug in lastrees on CRAN for windows oldrel

See lidR results. Not able to reproduce the bug.

running examples for arch 'x64' ... ERROR
Running examples in 'lidR-Ex.R' failed
The error most likely occurred in:

> ### Name: lastrees
> ### Title: Individual tree segmentation
> ### Aliases: lastrees
>
> ### ** Examples
>
> LASfile <- system.file("extdata", "Tree.laz", package="lidR")
> las = readLAS(LASfile, XYZonly = TRUE, filter = "-drop_z_below 0")

[...]

> # segmentation (default parameters but th = 4 + extra output)
> extra = lastrees(las, "dalponte2016", chm, th = 4, extra = TRUE)
Error in as.vector(data) :
  no method for coercing this S4 class to a vector
Calls: lastrees -> dalponte2012 -> matrix -> as.vector
Execution halted

Error while trying to load lidar files with RGB values

When trying to read a .las file that contains RGB attributes the following error occurs:

> a <- readLAS("data/a_3410263_20_20.las")
Error in grDevices::rgb(R/255, G/255, B/255) :
color intensity 54.2118, not in [0,1]

Enable parallel computing for Windows

Parallel computing is currently enable only for GNU/Linux because M$ Windows does not support forking process.

It is possible to enable a non fork parallel process for Windows. The objects from global env will not be easily shared with the different process but windows user must deal with the tools they have... The function processParallelcan have two different behavior for Linux and Windows.

writeLAS bug writing a LAS with no header

Problem: when trying to write an object LAS with an empty header (list()), the function writeLAS crash because it tries to access to non-existing data such as header["X Offset"].

Solution: examine how LASlib deal with txt files in txt2las. It it possible to create a file with an entirely generated header.

plot.grid_metric makes strange interpolation when gap in data

When there are complete holes in the data, for example no data for X between 100 and 200, plot.grid_metric creates data from nowhere to fill the gaps.

What happens
rplot
What is expected
rplot2

This is due to image() which explicitly expected non-missing values.

Add byref parameter to several functions

The lidR package work within the spirit of R base i.e. by copying objects on each modification. if data is a lidar dataset and the user run:

data = getFirst(data)

R will make several copies of the original dataset. It not a problem for small dataset but when dealing with lidar data it is easy to load 500 Mb or 1 Gb in RAM. User therefore needs more than twice the dataset size to make the process. It is slow, inefficient, there are memory leaks and it can overload the memory and make the computer crash.

Adding a convenient byref = TRUE parameter to every function which have the ability to modify a dataset would be a great gain to make efficient process allowing the user to easily use the powerfulness of data.table or the classical R way. Both for computation time and memory usage.

The function classifiy_from_shapefile already works that way by default.

Catalog LasLib error

Hi Jean-Romain,

thank you for putting this package together. i was about to start in this space then discovered your work and i like the direction it is heading in.

i have a couple of lidar based projects at the moment so can help road test this package.

the issue:

with Catalog you moved to laslib in recent versions. i find i cannot read more than ~500 las files before LASlib gets an internal error. From what i can see it is about the number of files. the original version of lidR 1.0.0 did not have this issue.

thoughts?

Paul Bentley

R crash while writing files with RGB

When trying to write a las file (writeLAS) my R-session crashes. The problem only seems to occur only when RGB are loaded.
lidR: 1.2.0 (ref="devel')
R 3.3.2 / Platform: x86_64-w64-mingw32/x64 (64-bit).

the problem seems to occur erratic, first save after rebooting works sometimes, but the colors in the created file look wrong (r/g/b in wrong order in part of the file)
I am currently working with Pix4D generated las files that are photogrammetry based.

++ crash details from windows
Problem signature:
Problem Event Name: APPCRASH
Application Name: rsession.exe
Application Version: 1.0.44.0
Application Timestamp: 5806b90d
Fault Module Name: lidR.dll
Fault Module Version: 0.0.0.0
Fault Module Timestamp: 5820df55
Exception Code: c0000005
Exception Offset: 000000000006979f
OS Version: 6.1.7601.2.1.0.256.4
++

Forced lowest point in pixel in grid_terrain

I think it would useful for the user to be able to choose whether the lowest point in the pixel should be chosen in the grid_terrain function or not. Indeed, in slope areas, depending on the sampling pattern of lidar points, this feature would lead to systematic bias (e.g. if there are several lidar points per cell, the downhill point will be systematically selected, leading to a lower elevation in the case of a regular slope) or artefacts (e.g if there is one or less point in each cell, this would create some additional roughness in the case of a regulare slope) compared to a simple delaunay triangulation.

Typo in stdmetrics_i,

I have lidR 1.1.0 installed, there is a typo error in function stdmetrics_i. One should read

ipcumzq70 = sum(i[z <= zq[4]])/itot * 100

instead of

ipcumzq70 = sum(i[z <= zq[3]])/itot * 100

Thank you for the very useful package.

writeLAS - attributes in the wrong order

Hi, and tank you for this useful function.

The writeLAS is not working properly because it mixes the attributes. For example, if you do

lidar<-readLAS(files="a.laz")
writeLAS(lidar,"a_write.laz")

you will find the Intensity in the gpstime slot etc. I believe it doesn't' take the attributes in the good order.

thin fail if no pulseID

thin fail if there is no pulseID. Must test if pulseID exist

and move selectPulseToRemove in thin.r

qhull error using pitfree algorithm

using the pitfree alg on a normalised las, it returns the following error:

QH6114 qhull precision error: initial simplex is not convex. Distance=-4.1e-09
Error in geometry::delaunayn(X[, 1:2]) :
Received error code 2 from qhull.

I don't know if it may be related to too few data per single height slice.
how is it possible to overcome this issue?

Plot ground returns

When trying to plot only ground returns

ground = lidar %>% getGround
plot(ground)

Error in cut.default(x, breaks = ncolors) : 'breaks' are not unique

Probably due to the fact that there is no range in Z elevations and therefore there is a bug when attributing a Color

Remove dependance to plyr

plyr dependence is used only for round_any function. It not necessary to create a lot of dependence. This function can be rewritten as an internal function.

NA pulse density

With readLAS some file does not have a pulse density. summary return NA pulses/square units.

normalize - possible interp issue??

Hi Jean-Romain,

I am back in front of a computer and have been road testing your package again. i am looking at overlapping data sets, so i have one from 2008 and one from 2012. Normalize works for the 2012, but not the 2008. below is the input class 'LAS' file i am using - both for the same plot. i tried looking into the error, but not sure why one dataset creates the issue, the other doesn't. the things which stands out is the LAS version, but doesn't directly match the error.

Thanks in advance.

this is the error (hence why i say interp)

Error in if (drx/dry > 10000 || drx/dry < 1e-04) stop("scales of x and y are too dissimilar") :
missing value where TRUE/FALSE needed
In addition: Warning messages:
1: In min(data$X) : no non-missing arguments to min; returning Inf
2: In min(data$Y) : no non-missing arguments to min; returning Inf
3: In min(data$Z) : no non-missing arguments to min; returning Inf
4: In max(data$X) : no non-missing arguments to max; returning -Inf
5: In max(data$Y) : no non-missing arguments to max; returning -Inf
6: In max(data$Z) : no non-missing arguments to max; returning -Inf
7: In min(x) : no non-missing arguments to min; returning Inf
8: In max(x) : no non-missing arguments to max; returning -Inf
9: In min(x) : no non-missing arguments to min; returning Inf
10: In max(x) : no non-missing arguments to max; returning -Inf

This data set does not work.

An object of class "LAS"
Slot "data":
X Y Z Intensity ReturnNumber Classification ScanAngle gpstime pulseID flightlineID
1: 350459.3 5846009 556.60 31 1 10 -6 19564.29 229075 2
2: 350459.1 5846008 553.12 4 2 10 -6 19564.29 229075 2
3: 350458.4 5846008 554.98 29 1 10 -6 19564.29 229076 2
4: 350458.1 5846007 550.17 1 2 10 -6 19564.29 229076 2
5: 350457.9 5846008 558.94 4 1 10 -6 19564.29 229077 2


649: 350442.9 5846020 554.24 8 2 10 -6 19564.57 238308 2
650: 350442.3 5846018 543.86 1 3 10 -6 19564.57 238308 2
651: 350443.8 5846020 542.79 6 2 10 -5 19564.57 238310 2
652: 350444.6 5846021 542.86 0 3 10 -5 19564.57 238311 2
653: 350445.4 5846022 543.66 0 4 10 -5 19564.57 238312 2

Slot "area":
[1] 304.8

Slot "pointDensity":
[1] 2.14

Slot "pulseDensity":
[1] 1.12

Slot "header":
$File Signature
[1] "LASF"

$File Source ID
[1] 0

$Global Encoding
[1] 0

$Project ID - GUID
[1] 0

$Version Major
[1] 01

$Version Minor
[1] 00

$System Identifier
[1] ""

$Generating Software
[1] "TerraScan"

$File Creation Day of Year
[1] 0

$File Creation Year
[1] 0

$Header Size
[1] 227

$Offset to point data
[1] 229

$Number of variable length records
[1] 0

$Point Data Format ID
[1] 01

$Point Data Record Length
[1] 28

$Number of point records
[1] 6237513

$Number of 1st return
[1] 3601894

$Number of 2nd return
[1] 1811872

$Number of 3rd return
[1] 709500

$Number of 4th return
[1] 114247

$Number of 5th return
[1] 0

$X scale factor
[1] 0.01

$Y scale factor
[1] 0.01

$Z scale factor
[1] 0.01

$X offset
[1] 0

$Y offset
[1] 0

$Z offset
[1] 0

$Max X
[1] 350460.9

$Min X
[1] 350441.2

$Max Y
[1] 5846024

$Min Y
[1] 5846004

$Max Z
[1] 568.68

$Min Z
[1] 529.89

This dataset does work

An object of class "LAS"
Slot "data":
X Y Z Intensity ReturnNumber Classification ScanAngle R G B gpstime pulseID flightlineID color
1: 350460.2 5846018 540.06 23 2 5 -18 14336 62208 10240 13386014 1543063 1 #38F228
2: 350459.7 5846016 537.55 34 2 4 -18 14336 62208 10240 13386014 1543064 1 #38F228
3: 350459.7 5846016 537.35 36 2 4 -18 14336 62208 10240 13386014 1543065 1 #38F228
4: 350459.7 5846015 537.88 18 4 5 -18 14336 62208 10240 13386014 1543066 1 #38F228
5: 350460.5 5846016 543.02 4 3 5 -18 14336 62208 10240 13386014 1543067 1 #38F228


2687: 350441.1 5846014 562.64 41 1 5 -18 14336 62208 10240 13386015 1704687 1 #38F228
2688: 350441.2 5846014 562.67 52 1 5 -18 14336 62208 10240 13386015 1704688 1 #38F228
2689: 350441.1 5846014 561.88 18 1 5 -18 14336 62208 10240 13386015 1704689 1 #38F228
2690: 350441.0 5846015 560.34 33 1 5 -18 14336 62208 10240 13386015 1704691 1 #38F228
2691: 350441.1 5846015 560.46 60 1 5 -18 14336 62208 10240 13386015 1704692 1 #38F228

Slot "area":
[1] 305.5

Slot "pointDensity":
[1] 8.81

Slot "pulseDensity":
[1] 4.65

Slot "header":
$File Signature
[1] "LASF"

$File Source ID
[1] 0

$Global Encoding
[1] 1

$Project ID - GUID
[1] 0

$Version Major
[1] 01

$Version Minor
[1] 02

$System Identifier
[1] "LAStools (c) by rapidlasso GmbH"

$Generating Software
[1] "las2las (version 160606)"

$File Creation Day of Year
[1] 103

$File Creation Year
[1] 2012

$Header Size
[1] 227

$Offset to point data
[1] 229

$Number of variable length records
[1] 0

$Point Data Format ID
[1] 03

$Point Data Record Length
[1] 34

$Number of point records
[1] 4947397

$Number of 1st return
[1] 2992076

$Number of 2nd return
[1] 1288598

$Number of 3rd return
[1] 506869

$Number of 4th return
[1] 159854

$Number of 5th return
[1] 0

$X scale factor
[1] 0.01

$Y scale factor
[1] 0.01

$Z scale factor
[1] 0.01

$X offset
[1] 0

$Y offset
[1] 0

$Z offset
[1] 0

$Max X
[1] 350460.6

$Min X
[1] 350441

$Max Y
[1] 5846024

$Min Y
[1] 5846004

$Max Z
[1] 568.44

$Min Z
[1] 530.3

readLAS

readLAS already exists in the package 'rLiDAR' - errors occur with both packages loaded and using this function.

solution to allow the other single input from the other package? or rename?

Add function classify_from_metric

The function classify_from_shapefile enable to class the point according to data contained into a shapefile. Then the user can filter the data based on this classification to retain only interesting points (i.e. points classified as forest).

Within the same idea the function classify_from_metric or classify_from_metrics (depending on how easy in can be implemented) would enable the user to class the points based on a metric computed in plots (refer to grid_metrics).

Exemple: the user want to keep only the point in plots that have a mean height higher than 10m. It is not possible. But it could be using this function.

classify_from_metrics(data,  resolution = 20, func = mean(Z))
newdata = lasfilter(data, V1 > 10)

The syntax would look like the one from grid_metrics but with a different behavior. The grid_metric basic workflow is

data[, expression, by]

The classify_from_metric basic workflow would be

data[, class := expression, by]

LAS summary

If summary(lidar) when no field pulseID is loaded:

> summary(lidar)
Memory : 94.8 Mb 

area : 1251413 square units
points : 2258711 points
Error in eval(substitute(expr), envir, enclos) : 
  Unsupported vector type NULL

This is because no data can be computed.

[UI-enhancement] progress bar

In order to keep track if the pc is properly working, it would be nice to add the progress bar (such as for lastrees) also to the other tools.

Error while reading files which do not respect LAS specifications

This is a bug reported by a user via email

When reading some files:

Error: ERROR: '%s' after %u of %u points

After investigations, the error occurred because the files does not respect LAS specifications. Because I modified the source code of LASlib to make it working on R, LASlib is less compliant with files which does not respect strictly the LAS standard. This problem can be solved checking lasreader_las.cpp L1311.

laspulse assigns multiple pulses the same pulseID

Thanks so much for developing lidR. It's been a great help processing data. I came across an issue when comparing my own measure of pulse density to the one produced by lidR.

My assumption is that each pulse cannot have more than one first return. Therefore, the number of pulses should equal the total number of first returns. Given that, it appears that laspulse will assign the same pulseID to multiple pulses when the GPS times are not sufficiently unique to identify the true pulse count. This leads to an underestimate of pulse count and incorrect calculation of pulse density.

Thank you for looking into this!

Remove reshape2 dependency

The package reshape2 is used only for its acast function. acast function could be replaced by dcast function from data.table removing a useless dependence. Output can be transform into a matrix with as.matrix.

Protect the gridMetrics function from bad expressions

The user can miss use the gridMetrics function by using a function which is not appropriated. These examples are not allowed:

gridMetrics(lidar, 20, LAD(Z))
gridMetrics(lidar, 20, head(Z))
gridMetrics(lidar, 20, range(Intensity))
gridMetrics(lidar, 20, quantile(Z))
  1. LAD returns a data.frame.
  2. headreturns a vector
  3. rangereturns a vector
  4. quantilereturns a vector

The expression provided to gridMetrics must return a single number or a list of single numbers. If it is not the case, the function will crash and the error given by the data.table is inapprehensible for users

The result of the expression given in parameter must be tested before the whole process to check if it returns a list a single number or a single number. But it's not easy:

  1. How to properly test it without loosing a lot of computation time?
  2. How to deal with R flexibility? A function can return different structures for different inputs. There is no strong signature in R and no strong type system.
  3. How to deal with R flexibility (2)? Lot of ugly codes work because R is very very tolerant. The consequences is that it is difficult to test if a code doesn't work as it is expected. For example ìs.listcould be used to test if the return is a list or not but a data.frame is a list. It becomes difficult to manage every possibilities.

Check documentation for v1.0.0

Check new/changed documentation

In devel branch:

  • R/plot.las.r
  • R/lasnormalize.r
  • R/lasterrain.r
  • R/catalog_index.r
  • R/catalog_query.r
  • R/catalog_select.r
  • R/catalog_apply.r
  • R/lidRError.r
  • R/writeLAS.R
  • R/readLAS.R
  • R/lasidentify.r
  • R/lasclassify.r
  • R/grid_terrain.r
  • R/grid_canopy.r
  • R/typecast.r
  • src/point_in_polygon.cpp
  • README.md
  • DESCRIPTION

In gh-pages branch:

  • thin.md
  • catalog.md

lidR_fast_countbelow: C++ function not available

Hi Jean-Romain,

I've been working with your package again - thank you for efforts. I have been working on my laptop and things are working fine (windows 10), and just did a fresh installation on a desktop computer (also windows 10), however i now get the following error:

LASfile <- system.file("extdata", "Megaplot.laz", package="lidR")
lidar = readLAS(LASfile)

Error in .Call("lidR_fast_countbelow", PACKAGE = "lidR", x, t) :
"lidR_fast_countbelow" not available for .Call() for package "lidR"

The version of lidR on my laptop was installed about a month ago; the desktop just then.

Thoughts?

writelas - index out of bounds

When I ve created LAS file from data frame, after tried to export LAS object, I see error below. What is the error? thanks

`writeLAS(test,"test.las")'

index out of bounds

function LAD() does not work with gridmetrics()

when running gridmetrics with function LAD() an error occurs:

LASfile <- system.file("extdata", "Megaplot.las", package="lidR")
lidar <- LoadLidar(LASfile)

#this works:
gridMetrics(lidar,20,vci(Z,zmax = 20,by = 1))

#this works:
LAD(lidar@data$Z,dz = 1,k = 0.5)

#this does not work:
gridMetrics(lidar,20,LAD(z = Z,dz = 1,k = 0.5))
#Error in hist.default(z, breaks = bk, plot = F) : 
#invalid number of breaks 

points to LAD.r#65

Unable to create the Normalize dataset

Hi ,

I was trying to create the normalize dataset of R, but every time I found the error stating that "Warning message: Dataset may be invalid: 74056 points below 0 found." I don't know how to remove or filter the points below 0 so that I can create the normalize .las dataset.

Regards,
Yogendra

Queries in a Catalog: read points in a given extent

Catalog might provide efficient queries of the type read all the LIDAR points that fall inside these rectangle or these circles". This type of query already exists in extractGroundInventory. This function can be more generalist to accept other types of queries.

Review the doc for v1.2.0

R files

  • grid_tincanopy
  • lasground
  • grid_hexametrics
  • lasnormalize (minor changes)

Other file

  • NEWS.md

kriging method indicating a software bug

Hi,
I am trying lidR for the first time. This is also the first time I've ever reported a bug and I'm not very familiar with GitHub, so sorry if I'm missing something.

library(lidR)
lascat <- catalog("c:/users/p/documents/gis")
palas <- readLAS(lascat)
cano1 <-grid_canopy(palas)
terr1 <-grid_terrain(palas, method="kriging")

[using universal kriging]
Error in predict.gstat(g, newdata = newdata, block = block, nsim = nsim, :
message: indicating a software bug, please report

traceback()

9: .Call(gstat_predict, as.integer(nrow(as.matrix(new.X))), as.double(as.vector(raw$locations)),
as.vector(new.X), as.integer(block.cols), as.vector(block),
as.vector(bl_weights), as.integer(nsim), as.integer(BLUE))
8: predict.gstat(g, newdata = newdata, block = block, nsim = nsim,
indicators = indicators, na.action = na.action, debug.level = debug.level)
7: predict(g, newdata = newdata, block = block, nsim = nsim, indicators = indicators,
na.action = na.action, debug.level = debug.level)
6: .local(formula, locations, ...)
5: gstat::krige(Z ~ X + Y, location = ~X + Y, data = ground, newdata = coord,
model)
4: gstat::krige(Z ~ X + Y, location = ~X + Y, data = ground, newdata = coord,
model)
3: terrain_kriging(ground, coord, model)
2: lasterrain(.las, grid, ...)
1: grid_terrain(palas, method = "kriging")

I read the documentation more closely and added a basic model for the kriging method.

terr1 <-grid_terrain(palas, method="kriging", model= gstat::vgm("Gau"))

Error in if (any(model$range < 0)) { :
missing value where TRUE/FALSE needed

traceback()

9: load.variogram.model(object$model[[name]], c(i - 1, i - 1), max_dist = max_dist)
8: predict.gstat(g, newdata = newdata, block = block, nsim = nsim,
indicators = indicators, na.action = na.action, debug.level = debug.level)
7: predict(g, newdata = newdata, block = block, nsim = nsim, indicators = indicators,
na.action = na.action, debug.level = debug.level)
6: .local(formula, locations, ...)
5: gstat::krige(Z ~ X + Y, location = ~X + Y, data = ground, newdata = coord,
model)
4: gstat::krige(Z ~ X + Y, location = ~X + Y, data = ground, newdata = coord,
model)
3: terrain_kriging(ground, coord, model)
2: lasterrain(.las, grid, ...)
1: grid_terrain(palas, method = "kriging", model = gstat::vgm("Gau"))

sessionInfo()

R version 3.3.1 (2016-06-21)
Platform: x86_64-w64-mingw32/x64 (64-bit)
Running under: Windows 7 x64 (build 7601) Service Pack 1

locale:
[1] LC_COLLATE=English_United States.1252
[2] LC_CTYPE=English_United States.1252
[3] LC_MONETARY=English_United States.1252
[4] LC_NUMERIC=C
[5] LC_TIME=English_United States.1252

attached base packages:
[1] stats graphics grDevices utils datasets methods base

other attached packages:
[1] lidR_1.0.2 magrittr_1.5

loaded via a namespace (and not attached):
[1] Rcpp_0.12.7 lattice_0.20-34 intervals_0.15.1 FNN_1.1
[5] spacetime_1.2-0 zoo_1.7-13 gstat_1.1-3 chron_2.3-47
[9] grid_3.3.1 lazyeval_0.2.0 data.table_1.9.6 raster_2.5-8
[13] sp_1.2-3 xts_0.9-7 tools_3.3.1 rlas_1.0.3

classify_from_shapefile ignores multipart

Hi, I have been trying to use the classfy_from_shapefile function and got unexpected results. after some digging i found that the function seems to only include the first slot of any PolygonsDataFrame.
the behavior seems the same whether it is a multipart polygon, or a shapefile with multiple polygons.

\on a side note:
are there very specific reasons why the grid_metrics and related function produce their own data type. it may be desirable to create grids that use a use a compatible format with the 'sp' or 'raster' libraries. for seamless use with many other functions there.

lasdecimate issue

Hi

Many functions do not work properly (e.g. writeLAS, lasdecimate) because it switches the attributes. For example, within the lasdecimate, the "intensity" is assigned to the attributte "gpstime" whereas the "return number" to the "intensity" attribute etc.

I'm wondering whether this issues arent' related to the fact that we are using lastools without license.

error in LoadLidar()

When loading a pointcloud with LoadLidar() or readLas() following error occurs:

Error in as.data.table.matrix(xi, keep.rownames = keep.rownames) : 
  4 arguments passed to .Internal(nchar) which requires 3

error does not occur when
return(data.table(mm, Intensity, ReturnNumber,NumberOfReturns,Classification,ScanAngle,R,G,B,gpstime))
is changed into
return(data.frame(mm, Intensity, ReturnNumber,NumberOfReturns,Classification,ScanAngle,R,G,B,gpstime))
readLas.r, line 200

Recommend Projects

  • React photo React

    A declarative, efficient, and flexible JavaScript library for building user interfaces.

  • Vue.js photo Vue.js

    🖖 Vue.js is a progressive, incrementally-adoptable JavaScript framework for building UI on the web.

  • Typescript photo Typescript

    TypeScript is a superset of JavaScript that compiles to clean JavaScript output.

  • TensorFlow photo TensorFlow

    An Open Source Machine Learning Framework for Everyone

  • Django photo Django

    The Web framework for perfectionists with deadlines.

  • D3 photo D3

    Bring data to life with SVG, Canvas and HTML. 📊📈🎉

Recommend Topics

  • javascript

    JavaScript (JS) is a lightweight interpreted programming language with first-class functions.

  • web

    Some thing interesting about web. New door for the world.

  • server

    A server is a program made to process requests and deliver data to clients.

  • Machine learning

    Machine learning is a way of modeling and interpreting data that allows a piece of software to respond intelligently.

  • Game

    Some thing interesting about game, make everyone happy.

Recommend Org

  • Facebook photo Facebook

    We are working to build community through open source technology. NB: members must have two-factor auth.

  • Microsoft photo Microsoft

    Open source projects and samples from Microsoft.

  • Google photo Google

    Google ❤️ Open Source for everyone.

  • D3 photo D3

    Data-Driven Documents codes.