Coder Social home page Coder Social logo

kis / scale Goto Github PK

View Code? Open in Web Editor NEW
41.0 6.0 2.0 11.65 MB

Angular plugin for creating charts

Home Page: https://chartify.github.io/scale/example/

License: MIT License

JavaScript 87.08% CSS 10.19% HTML 2.73%
chart kinopoisk timeline timesheet barchart angular-plugin

scale's Introduction

Scale

NPM Version Download Month Download Total

alt text

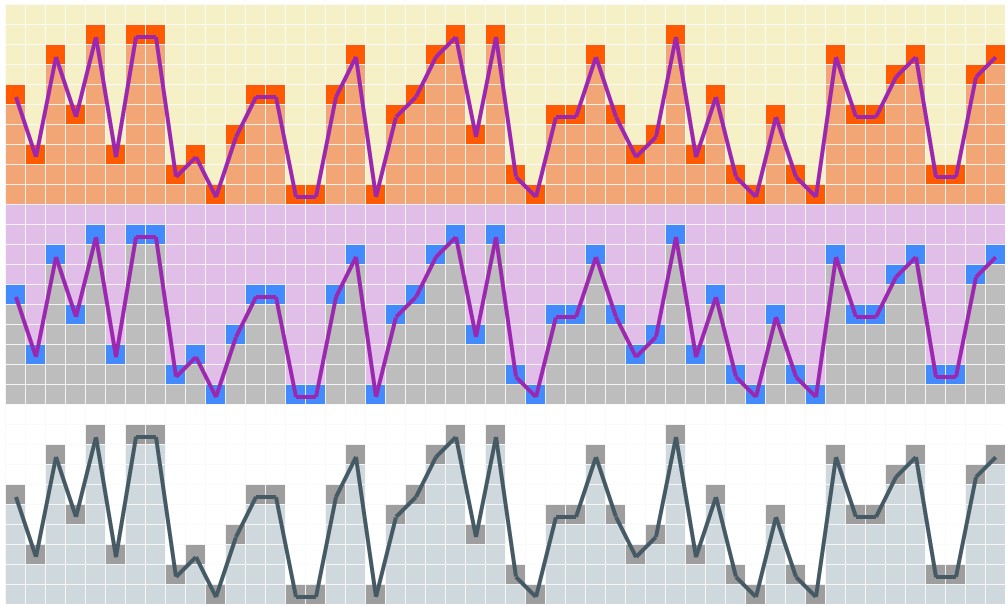
Angular plugin for building scale of items. Chart ruler completely on HTML/CSS/JS. Bar chart, line chart, calendar view visualisation. Diagram, graph, pyramid visualisation of large datasets. Showreel. The source for this module is in the main repo. Please create issues and pull requests.

alt text

Inspired by kinopoisk.ru chart written using Adobe Flash. But this chart is just on HTML/CSS without using libraries. Feel free for contribute.

alt text

Install

bower install angular-scale 
npm install angular-scale 

Use

<!DOCTYPE html>
<html ng-app="myApp">
	<head>
		<meta charset="utf-8">
		<link rel="stylesheet" type="text/css" href="../scale.css">
	</head>
	<body ng-controller="main">
		<scale data="data" 
			   width="50" 
			   height="10"
			   box-size="14"
			   line="true"
			   theme="default">
		</scale>

		<script src="https://ajax.googleapis.com/ajax/libs/angularjs/1.5.7/angular.min.js"></script>
		<script src="../scale.js"></script>
		<script src="./index.js"></script>
	</body>
</html>
angular.module('myApp', ['scale']).controller('main', ['$scope', function($scope) {
	$scope.data = [];

	var SCALE_WIDTH = 50,
	    SCALE_HEIGHT = 10;

	for (var i=0; i < SCALE_WIDTH; i++) {
		var value = Math.floor(Math.random() * SCALE_HEIGHT + 1);

		$scope.data.push({
			value: value, //Value from 1 to SCALE_HEIGHT
			title: (i + 1) + " item" //Description
		});
	}
}]);

Options

<scale data="data" 
	   width="50" 
	   height="10"
	   box-size="14"
	   line="true"
	   theme="default">
</scale>
  • data is an array of objects [{value: 0}, ... , {value: 10}]. This is the dataset of the chart.
  • width is the horizontal length of the data array. If width param is less than the length of the data array then user will see the last values of the data array.
  • height is the vertical length.
  • box-size is size of each box in pixels.

alt text

  • line is param that determines if this is a line-chart.

alt text

  • theme is color scheme of the chart.

alt text

Please check the example folder to see how it's going on practice.

Themes

  • default
  • purple
  • grey

alt text

Changelog

  • 10/02/2016 Implemented tooltips.
  • 10/01/2016 Implemented different color schemes.
  • 09/20/2016 Rewriting the project as an Angular.js plugin.
  • 06/05/2016 Finished writing function for calculating angle of the line that connects the points of the chart. Rendering chart.

License

Copyright (c) 2016 Kirill Stepkin

Inspired by kinopoisk.ru chart.

npm

scale's People

Contributors

kis avatar

Stargazers

 avatar  avatar  avatar  avatar  avatar  avatar  avatar  avatar  avatar  avatar  avatar  avatar  avatar  avatar  avatar  avatar  avatar  avatar  avatar  avatar  avatar  avatar  avatar  avatar  avatar  avatar  avatar  avatar  avatar  avatar  avatar  avatar  avatar  avatar  avatar  avatar  avatar  avatar  avatar  avatar  avatar

Watchers

 avatar  avatar  avatar  avatar  avatar  avatar

Forkers

womol feedlike

Recommend Projects

  • React photo React

    A declarative, efficient, and flexible JavaScript library for building user interfaces.

  • Vue.js photo Vue.js

    ๐Ÿ–– Vue.js is a progressive, incrementally-adoptable JavaScript framework for building UI on the web.

  • Typescript photo Typescript

    TypeScript is a superset of JavaScript that compiles to clean JavaScript output.

  • TensorFlow photo TensorFlow

    An Open Source Machine Learning Framework for Everyone

  • Django photo Django

    The Web framework for perfectionists with deadlines.

  • D3 photo D3

    Bring data to life with SVG, Canvas and HTML. ๐Ÿ“Š๐Ÿ“ˆ๐ŸŽ‰

Recommend Topics

  • javascript

    JavaScript (JS) is a lightweight interpreted programming language with first-class functions.

  • web

    Some thing interesting about web. New door for the world.

  • server

    A server is a program made to process requests and deliver data to clients.

  • Machine learning

    Machine learning is a way of modeling and interpreting data that allows a piece of software to respond intelligently.

  • Game

    Some thing interesting about game, make everyone happy.

Recommend Org

  • Facebook photo Facebook

    We are working to build community through open source technology. NB: members must have two-factor auth.

  • Microsoft photo Microsoft

    Open source projects and samples from Microsoft.

  • Google photo Google

    Google โค๏ธ Open Source for everyone.

  • D3 photo D3

    Data-Driven Documents codes.