Comments (10)
 strengejacke
commented on May 24, 2024
strengejacke
commented on May 24, 2024
This issue seems to be already fixed in the latest GitHub-version.
library(glmmTMB)
library(ggeffects)
fit1 <-
glmmTMB(
SiblingNegotiation ~ FoodTreatment + ArrivalTime + (1 | Nest),
data = Owls,
ziformula = ~ 1,
family = list(family = "truncated_poisson", link = "log")
)
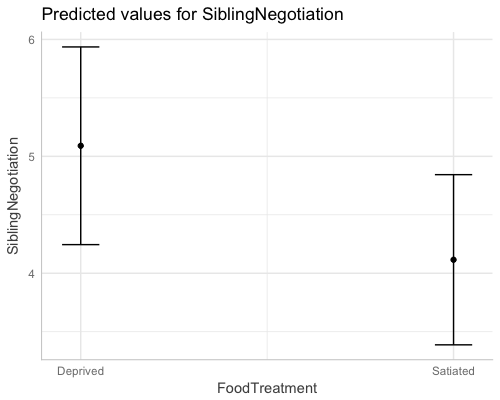
dat <- ggpredict(fit1, "FoodTreatment")
dat
#> # A tibble: 2 x 5
#> x predicted conf.low conf.high group
#> <dbl> <dbl> <dbl> <dbl> <fctr>
#> 1 1 5.090289 4.244845 5.935732 1
#> 2 2 4.115488 3.387719 4.843257 1plot(dat)
from ggeffects.
 knomoto
commented on May 24, 2024
knomoto
commented on May 24, 2024
This might be more related to statistics issue, but I was a bit confused. This confidence interval was calculated by exp(mean) ± 1.96 * exp(se), right? Are you going to implement an option to use exp(mean ± 1.96 * se) for CI calculation? I thought this was more accurate on an original scale, wasn't it? Thanks!
from ggeffects.
strengejacke
commented on May 24, 2024
The CI are now based on this code:
http://www.biorxiv.org/content/biorxiv/suppl/2017/05/01/132753.DC1/132753-2.pdf
Page 7
from ggeffects.
strengejacke
commented on May 24, 2024
See this blog post for comparison of glmer.nb and glmmTMB models:
https://strengejacke.wordpress.com/2017/08/27/marginal-effects-for-negative-binomial-mixed-effects-models-glmer-nb-and-glmmtmb-rstats/
Calculations seem fine...
from ggeffects.
knomoto
commented on May 24, 2024
I was wondering if this issue is related to this question:
http://stackoverflow.com/a/14424417/429846
Or these blog plots by the same guy:
http://www.fromthebottomoftheheap.net/2017/05/01/glm-prediction-intervals-i/
http://www.fromthebottomoftheheap.net/2017/05/01/glm-prediction-intervals-ii/
In Page 7 (
http://www.biorxiv.org/content/biorxiv/suppl/2017/05/01/132753.DC1/132753-2.pdf), the authors said "We present a more rigorous version next." In the next section, they showed an alternative method.
This is the result of the first method.
> newdata
    mined   spp     predFE  predFE.min predFE.max
1     yes    GP 0.04545437 -0.06190300  0.1528117
4      no    GP 2.20833349  1.55913482  2.8575321
93    yes    PR 0.11363642 -0.03443692  0.2617098
96     no    PR 0.45833334  0.15654434  0.7601223
185   yes    DM 0.43181799  0.11185668  0.7517793
188    no    DM 2.43750051  1.70887251  3.1661285
277   yes  EC-A 0.09090907 -0.02151047  0.2033286
280    no  EC-A 0.95833364  0.47951310  1.4371542
369   yes  EC-L 0.25000090  0.08738131  0.4126205
372    no  EC-L 3.95833334  2.73877704  5.1778896
461   yes DES-L 0.56818198  0.19065740  0.9457065
464    no DES-L 3.91666683  2.77340352  5.0599301
553   yes    DF 0.56818196  0.23574543  0.9006185
556    no    DF 1.91666683  1.28687838  2.5464553
Next is the result of the second method. You can see, while the estimates of mean are identical, confidence intervals are different.
> pred.ucount
    mined   spp pred.ucount   ucount.low ucount.high
1     yes    GP  0.04545437 1.386631e-03   1.2094706
4      no    GP  2.20833349 0.000000e+00   2.8172141
93    yes    PR  0.11363642 1.114072e-02   0.7676027
96     no    PR  0.45833334 1.588981e-01   1.1668439
185   yes    DM  0.43181799 1.394306e-01   1.2012021
188    no    DM  2.43750051 4.554909e-01   3.4813100
277   yes  EC-A  0.09090907 3.594691e-03   1.3385609
280    no  EC-A  0.95833364 4.677321e-01   1.7377327
369   yes  EC-L  0.25000090 6.595484e-07   0.9555610
372    no  EC-L  3.95833334 2.607318e+00   5.5989610
461   yes DES-L  0.56818198 2.010156e-01   1.3449304
464    no DES-L  3.91666683 2.519085e+00   5.3748773
553   yes    DF  0.56818196 2.195147e-01   1.3396698
556    no    DF  1.91666683 9.462238e-01   2.7591558
Thanks!!
from ggeffects.
strengejacke
commented on May 24, 2024
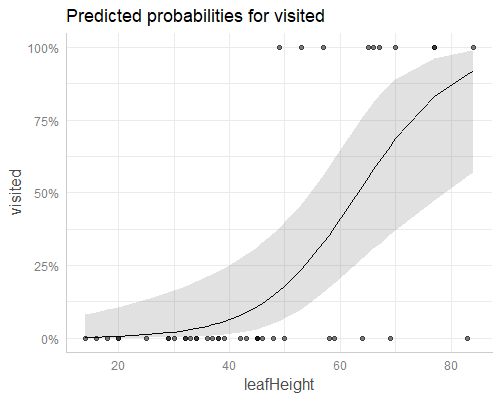
According to your blogpost, ggpredict() exactly reproduces the plot:
darlurl <- "http://harvardforest.fas.harvard.edu/sites/harvardforest.fas.harvard.edu/files/ellison-pubs/2004/DarlingtoniaData3.txt"
darl <- setNames(read.fwf(darlurl, widths = c(8,9), header = FALSE, skip = 1L), c("leafHeight", "visited"))
darl <- transform(darl, visited = as.logical(visited))
m <- glm(visited ~ leafHeight, data = darl, family = binomial)
library(ggeffects)
plot(ggpredict(m, "leafHeight"), rawdata = T)
There is not one generic way to compute CI, it depends on the model-type. For glm, I use the link-inverse function to compute predicted values and CI. For glmmTMB, I use the predict-method, which already gives me the right scale (If I'm correct here) and for lme4, I use the 2nd approach described in the paper.
However, the second approach is difficult to do in a generic way. There are situations where model matrix and variance-covariance-matrix don't exactly match for multiplications. That's why I try to avoid this if possible.
But you're welcome to suggest an alternative approach, and I can see how to implement it (or you open a pull-request).
from ggeffects.
knomoto
commented on May 24, 2024
Thank you very much for clarification!! That is what I wanted to know. Is there any problem if one uses link-inverse function to compute CI for glmmTMB (or perhaps GLMM in general)? I am sorry that this is not related to ggeffects package, but it was really helpful to me. Thanks again!
from ggeffects.
strengejacke
commented on May 24, 2024
No, there is no problem in using the link-inverse-function (except that some glmmTMB families do not return a link-inv-fnc). You just have to write a more complicated code to compute the CIs. Or did you mean something else?
from ggeffects.
knomoto
commented on May 24, 2024
No, that's what I asked. Thanks! As I've just started to learn R, I have to learn a lot... Anyway, thank you for a good package!
from ggeffects.
strengejacke
commented on May 24, 2024
If you're interested in the code, here's the prediction function for glmmTMB:
Line 270 in b25330b
Here for merMod:
Line 309 in b25330b
And here is the function that computes CI for all models, where the predict-function does not return the standard errors:
Line 707 in b25330b
The crucial part are lines 763-768. I have to use all terms for the model.matrix() call, but only need some of the terms (specified in argument term) for the final result. That's why I arrange the data (lines 732-743) to have the required terms in the first rows of the matrix multiplication. However, sometimes, this multiplication fails, because terms don't match. That's why I didn't use it for glmmTMB.
from ggeffects.
Related Issues (20)
- Show message when some lines are left out from the output HOT 1
- ggpredict always compute prediction intervals regardless of the argument HOT 2
- Add "order" or "sort" option to ggpredict plot options
- Wrong effects computed for nestedLogit models HOT 8
- ggpredict for mclogit model predicts high CIs are low or 0, low CI high
- "Raw data not available." with weights and missing data
- "Could not find model object to extract residuals." when model is not in global envir HOT 2
- Reviewer's questions about estimated predicted probabilities HOT 2
- X value seemingly transformed for partial residuals plot HOT 3
- Data labels for points using plot() HOT 2
- Problem using ggeffects for mclogit package HOT 3
- Using cluster-robust SEs within a zero-inflated negative binomial model through ggpredict won't return confidence intervals HOT 5
- ggpredict fails with one term when data used for modelling was a tibble HOT 1
- Adding ggplot2 functionality to ggeffects plot() fails when not setting "terms" HOT 1
- Is the full average or conditional average after model.avg used in ggpredict?
- Replicating `ggpredict()` with `predict()` HOT 6
- `marginaleffects` 0.14.0 breaking change HOT 7
- New issue possibly due to changes in **emmeans** HOT 2
- `rawdata=T` does not work for `plot(ggpredict())` applied to a logistic `glm()` with proportions as response variable HOT 5
- `ggeffects` 1.3.0 displays predictions but no raw data for a generalised mixed-effect model HOT 7
Recommend Projects
-
 React
React
A declarative, efficient, and flexible JavaScript library for building user interfaces.
-
Vue.js
🖖 Vue.js is a progressive, incrementally-adoptable JavaScript framework for building UI on the web.
-
 Typescript
TypeScript is a superset of JavaScript that compiles to clean JavaScript output.
-
TensorFlow
An Open Source Machine Learning Framework for Everyone
-
Django
The Web framework for perfectionists with deadlines.
-
 Laravel
A PHP framework for web artisans
-
D3
Bring data to life with SVG, Canvas and HTML. 📊📈🎉
-
Recommend Topics
-
javascript
JavaScript (JS) is a lightweight interpreted programming language with first-class functions.
-
web
Some thing interesting about web. New door for the world.
-
server
A server is a program made to process requests and deliver data to clients.
-
Machine learning
Machine learning is a way of modeling and interpreting data that allows a piece of software to respond intelligently.
-
Visualization
Some thing interesting about visualization, use data art
-
Game
Some thing interesting about game, make everyone happy.
Recommend Org
-
Facebook
We are working to build community through open source technology. NB: members must have two-factor auth.
-
Microsoft
Open source projects and samples from Microsoft.
-
Google
Google ❤️ Open Source for everyone.
-
Alibaba
Alibaba Open Source for everyone
-
D3
Data-Driven Documents codes.
-
Tencent
China tencent open source team.
from ggeffects.