Comments (5)
 browaeysrobin
commented on May 26, 2024
1
browaeysrobin
commented on May 26, 2024
1
Hi @saeedfc
The ranking of the ligands is based on how well top-ranked target genes of a ligand (based on reg. potential) are enriched in the gene set of interest (= Pearson correlation between whether a gene belongs to the gene set of interest and the regulatory potential scores of target genes of a ligand). For highly ranked ligands, this means that many top-ranked target genes are in the gene set of interest compared to the background. Note that the Pearson correlation to rank ligands is calculated for each ligand separately. As a result, this correlation only depends on the ranking of target genes for one ligand ( 'relative' ligand-target regulatory potential scores for that ligand, without looking at other ligands).
The regulatory potential scores of ligand-target links that are shown in the heatmap visualize the 'absolute' ligand-target regulatory potential. This is a confidence score related to how many data sources confirm the regulatory interaction between a ligand and a target. A higher score means that there is more evidence for the specific ligand-target interaction. It is important to note that in this heatmap, you only show the genes that are part of your gene set as possible target genes.
The reason why you see a contradiction between the Pearson correlation and regulatory potential scores is thus the following:
Csf1 is ranked higher than Tnf, because its top-ranked target genes are more enriched than the target genes of Tnf, although the absolute regulatory potential scores of the Tnf-target links are higher (see Wouter's response for a possible explanation). Tnf targets are probably less enriched because there will be more high scoring target genes of Tnf that are not in the gene set of interest compared to Csf1 targets.
But anyway, Tnf is still a very highly ranked ligand (4th out of so many ligands) and I would not focus too much on the difference between which ligand is ranked 1st and which 4th.
from nichenetr.
 zouter
commented on May 26, 2024
zouter
commented on May 26, 2024
Hi @saeedfc
@browaeysrobin is on holidays at the moment, so I'll try to help you the best I can.
I assume that you see a low regulatory potential score on a plot like this:
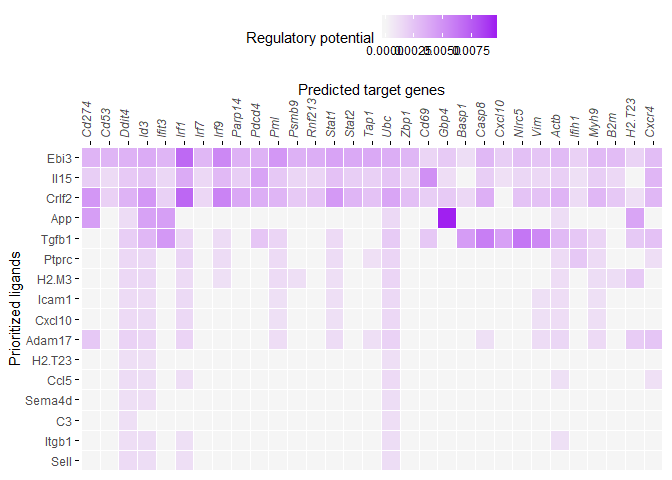
even though Csf1 has a very high ligand activity score?
One reason for this may the cutoffs that are applied on this data. There is a cutoff applied on every ligand (only for visualization), so that only the top xx% of targets have a regulatory potential higher than 0. This is controlled by the cutoff visualization parameter:
@param cutoff_visualization Because almost no ligand-target scores have a regulatory potential score of 0, we clarify the heatmap visualization by giving the links with the lowest scores a score of 0. The cutoff_visualization paramter indicates this fraction of links that are given a score of zero. Default = 0.33.
Could you try to lower this cutoff a bit and see whether the results changes?
from nichenetr.
 saeedfc
commented on May 26, 2024
saeedfc
commented on May 26, 2024
Dear @zouter ,
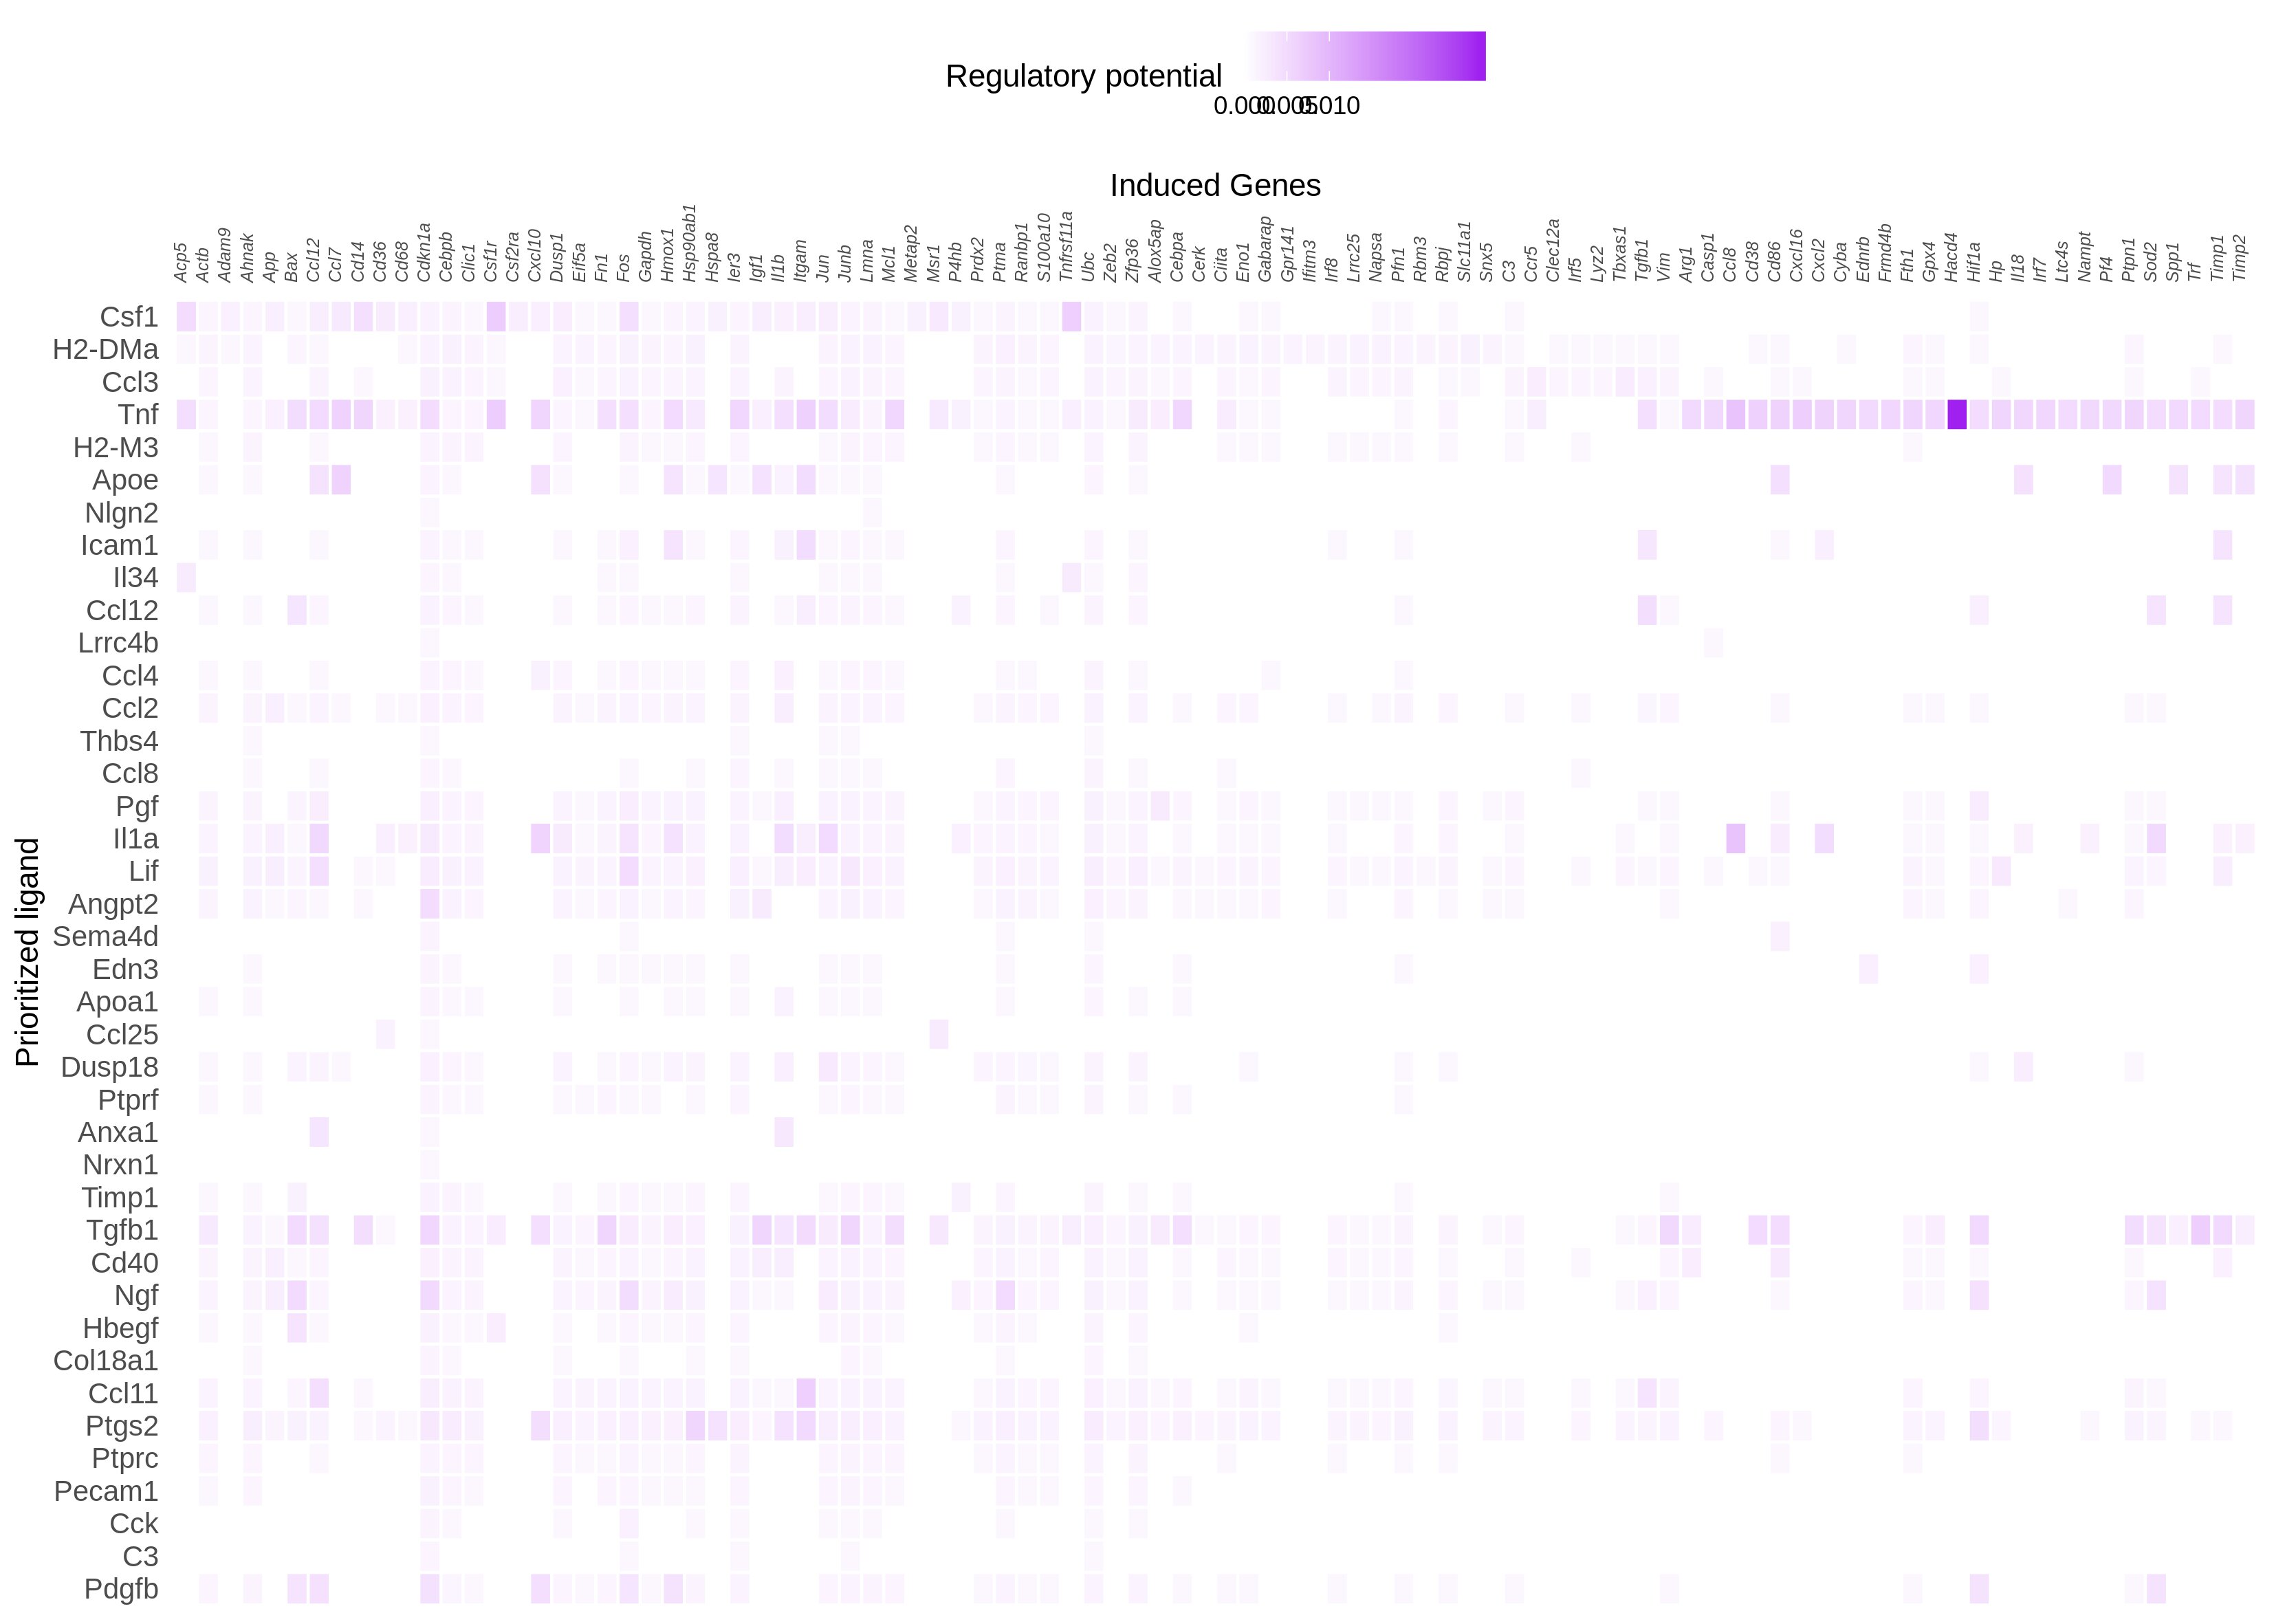
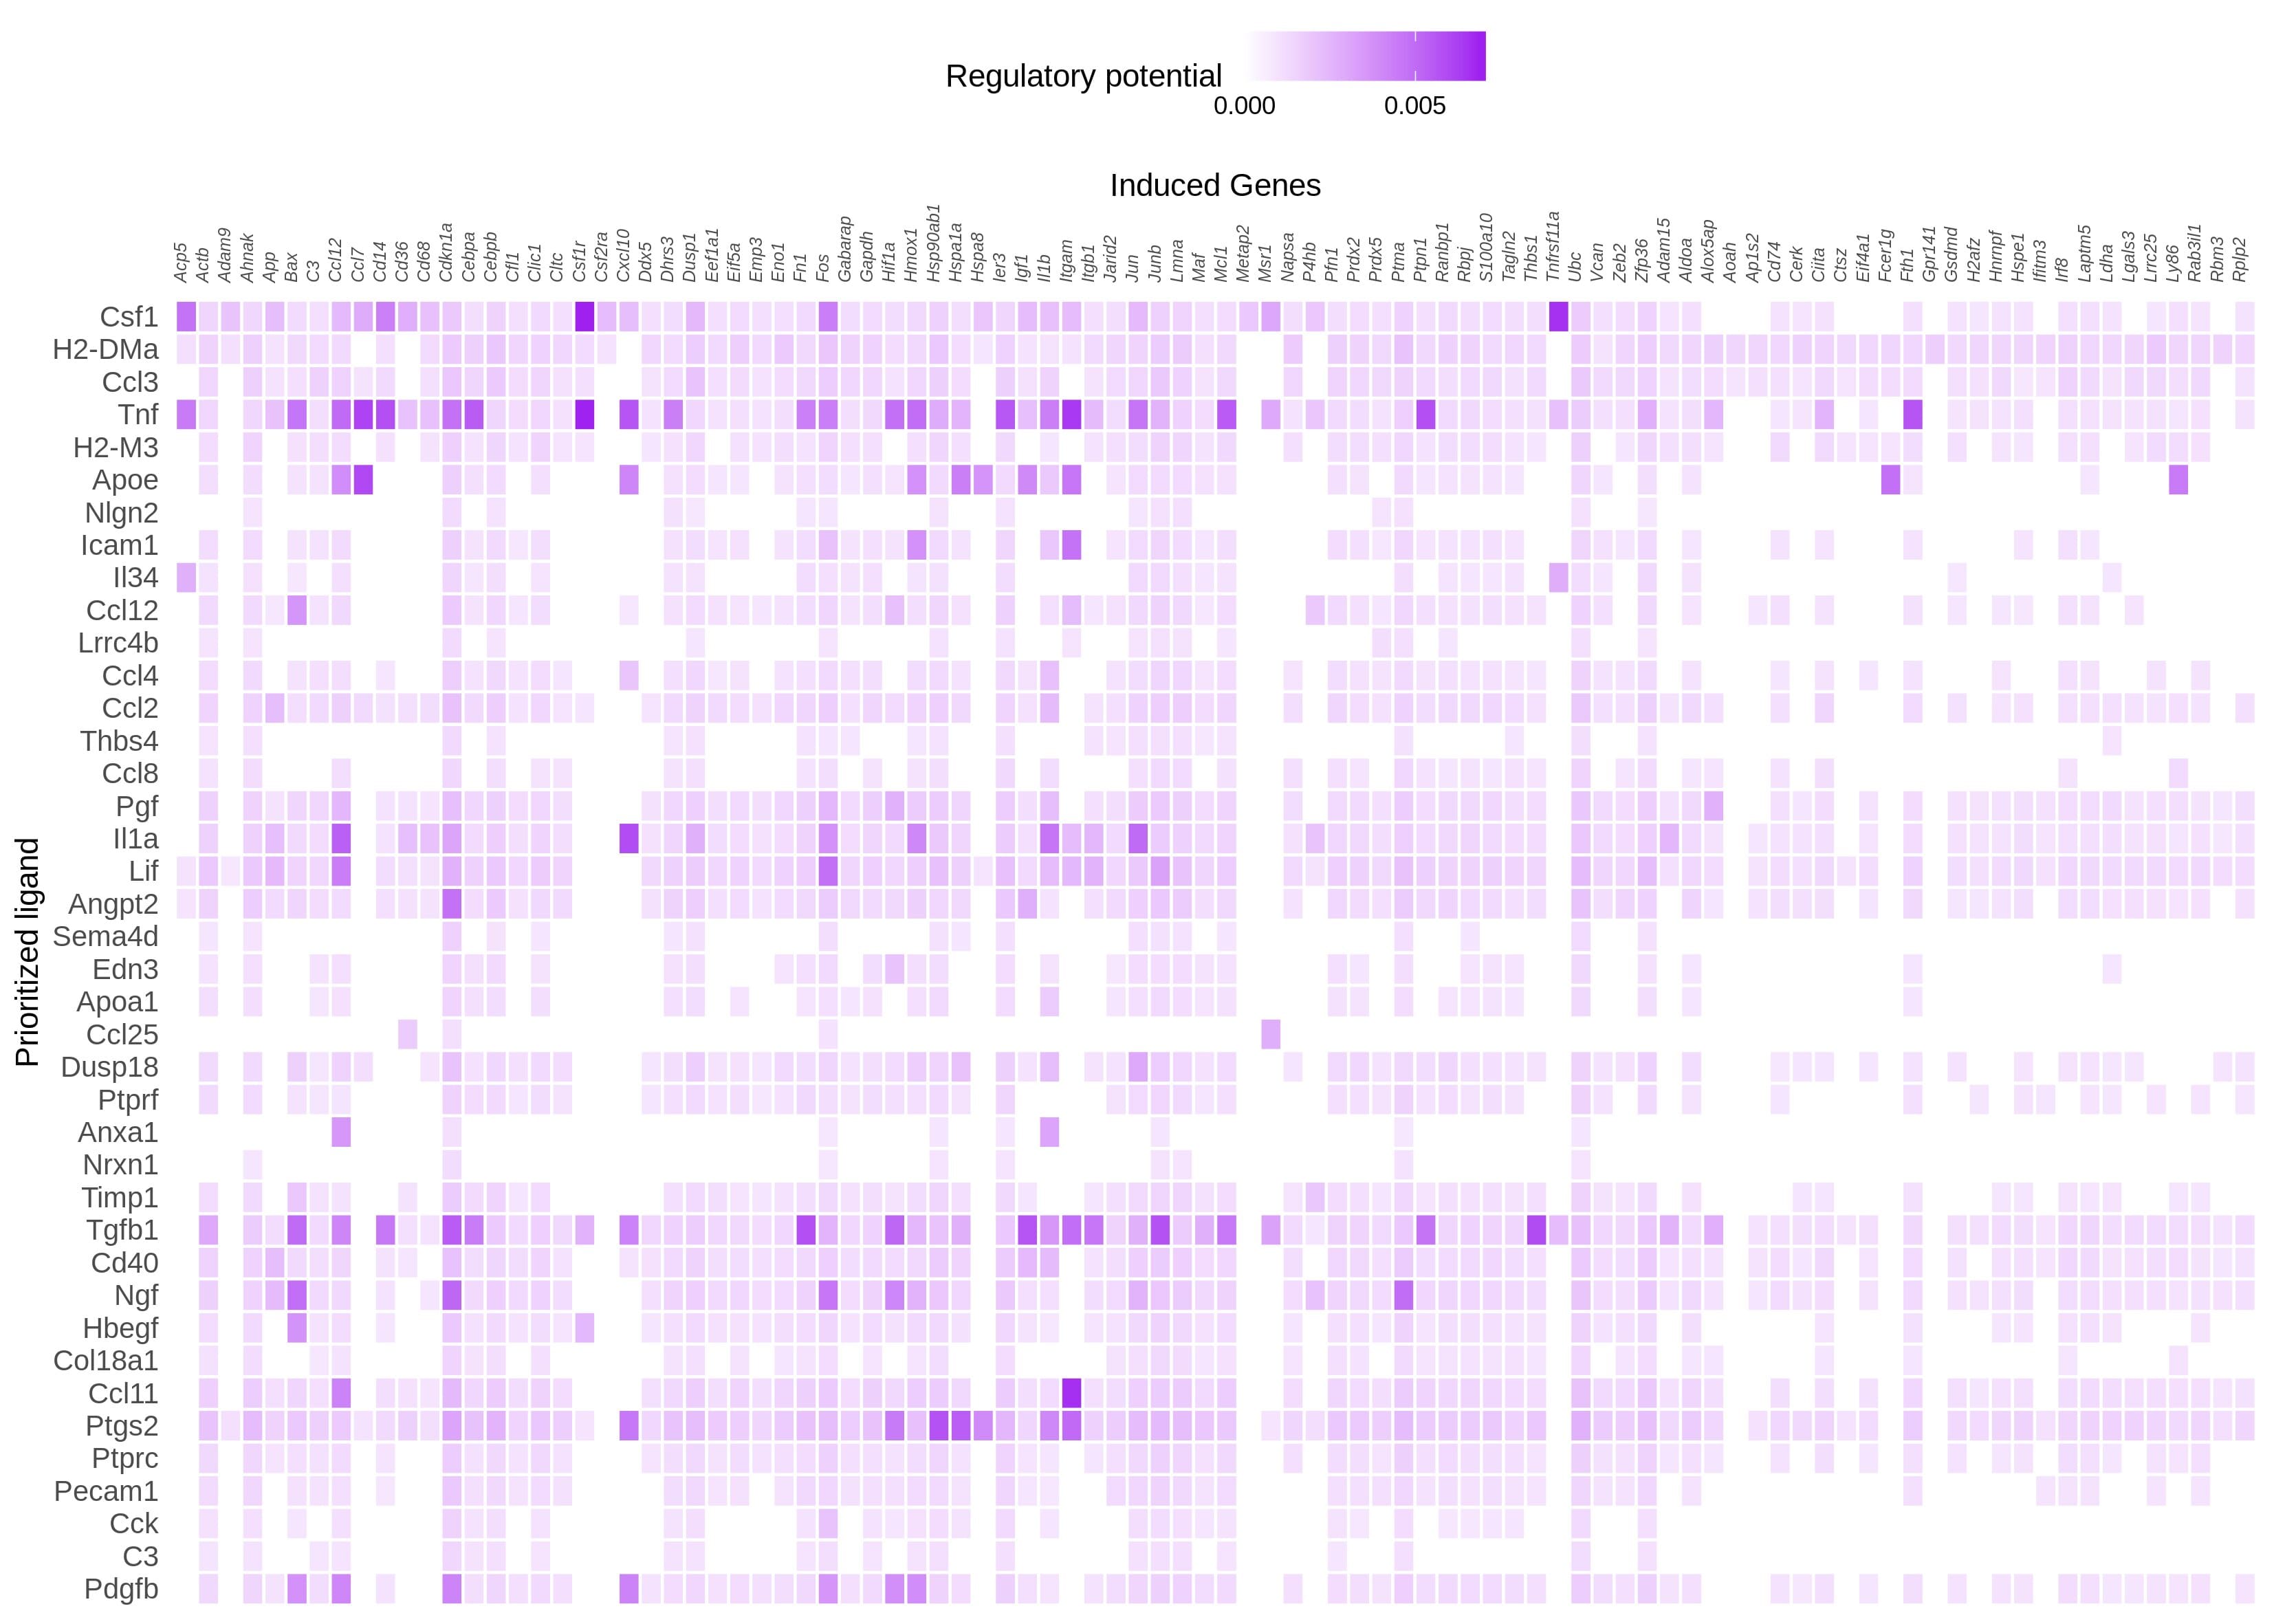
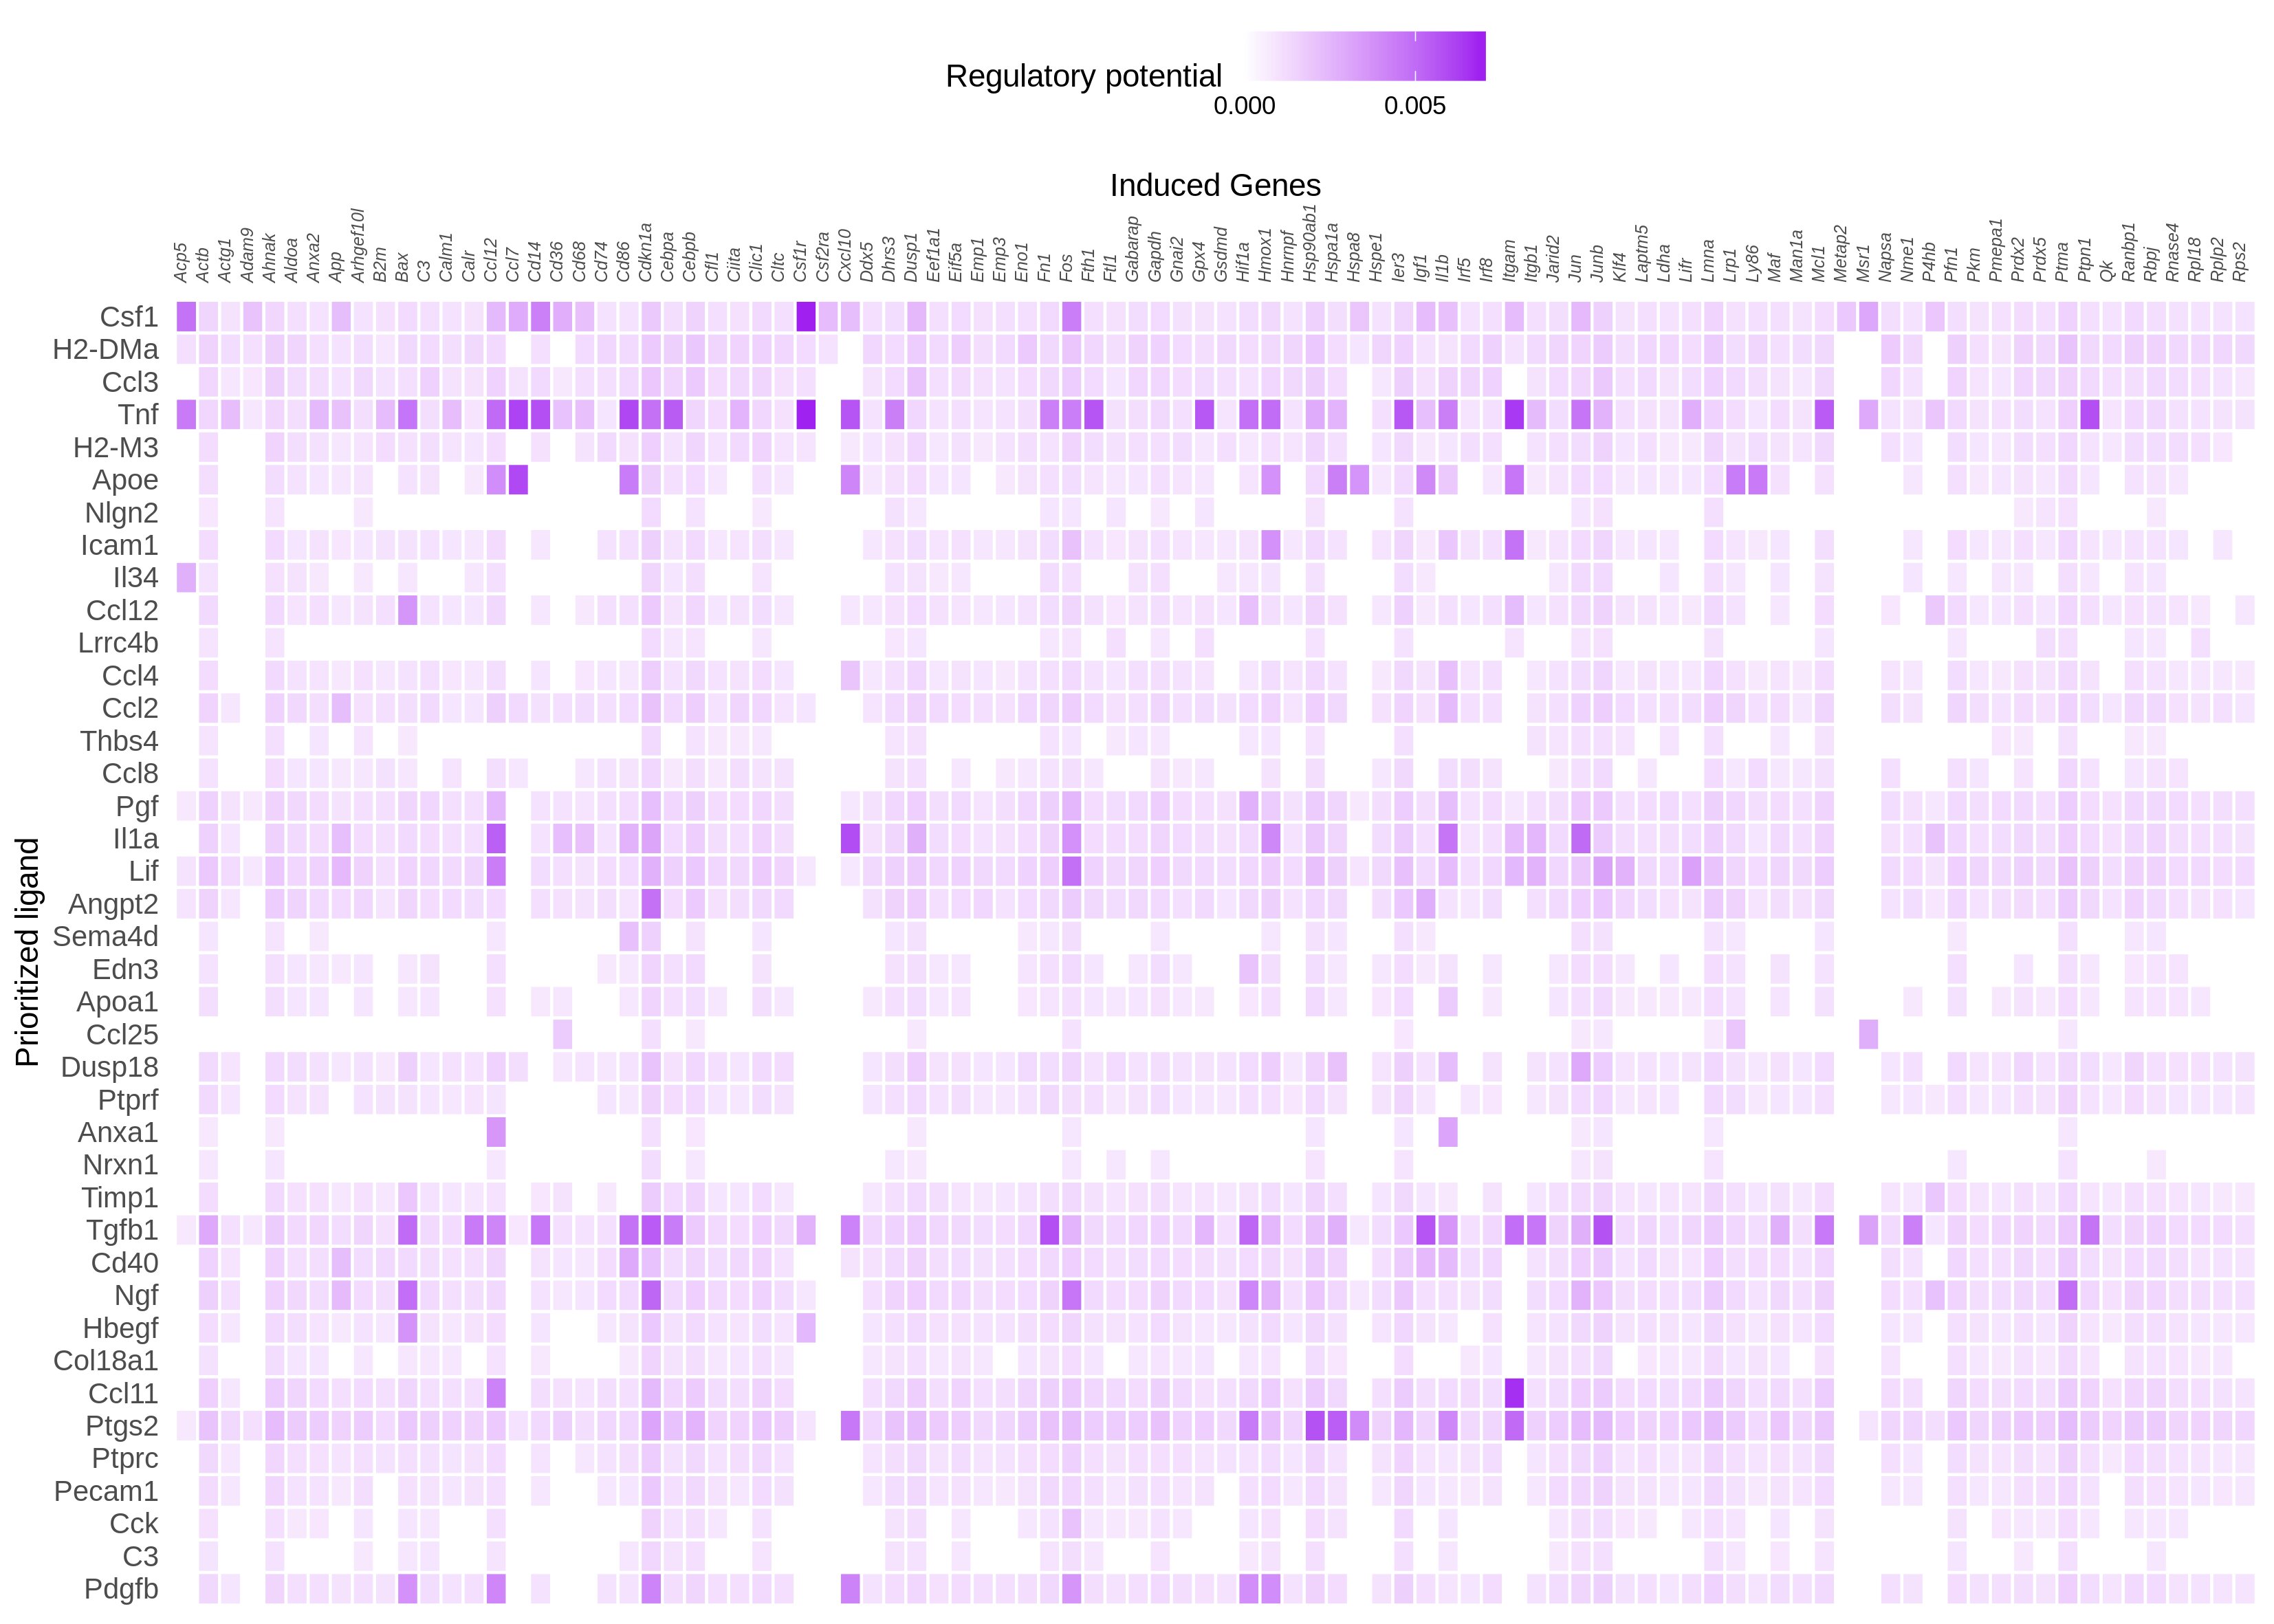
I tried changing the cut off, but it did not yield much difference. But changing the number of top genes when constructing the active_ligand_target_links_df to get the weights made a difference. First I went with 250 and then to 500 with cut ff at 0.15 and 0.25. However, what I see on the heatmap is that still the highest regulatory potential seems to be with Tnf than Csf1. I am attaching the figures here
active_ligand_target_links_df = best_upstream_ligands %>% lapply(get_weighted_ligand_target_links,geneset = geneset_nns, ligand_target_matrix = ligand_target_matrix, n = 250) %>% bind_rows()

active_ligand_target_links = prepare_ligand_target_visualization(ligand_target_df = active_ligand_target_links_df, ligand_target_matrix = ligand_target_matrix, cutoff = 0.15)

order_ligands = intersect(best_upstream_ligands, colnames(active_ligand_target_links)) %>% rev()
order_targets = intersect(active_ligand_target_links_df$target, rownames(active_ligand_target_links)) %>% unique()
vis_ligand_target = active_ligand_target_links[order_targets,order_ligands] %>% t()

p_ligand_target_network = vis_ligand_target[,1:94] %>% make_heatmap_ggplot("Prioritized ligand","Induced Genes", color = "purple",legend_position = "top", x_axis_position = "top",legend_title = "Regulatory potential") + scale_fill_gradient2(low = "whitesmoke",  high = "purple", breaks = c(0,0.005,0.01)) + theme(axis.text.x = element_text(size = 6,face = "italic"), axis.text.y = element_text(size = 10))

p_ligand_target_network
ggsave(filename =  "E2M_250_cutoff_0.15.tiff",path =  "/mnt/DATA1/POI/nichenetr/plots", width = 28, height = 20, dpi = 300, units = "cm")
n = 250, cut off = 0.15

n = 250, cut off = 0.25
n = 500, cut off = 0.15
n = 500, cut off = 0.25

n = 1000, cut off = 0.15
n = 1000, cut off = 0.25

histogram

from nichenetr.
zouter
commented on May 26, 2024
Hi @saeedfc
Thanks for trying it out! My first reasoning was indeed wrong, sorry about that.
This result kind of makes sense, in the sense that our regulatory potential scores are quite "popularity biased". A ligand like TNF has been studied a lot, and so it is described in most of our data sources (be it ChIP-seq experiments, pathway databases, etc). The **absolute ** regulatory potential scores of this ligand will therefore be inadvertently higher, because we have more data. Relatively speaking however, you will still see differences. The first 60% target genes in your heatmap for example have a moderate absolute regulatory potential for Csf1. Tnf has also a high **absolute ** regulatory potential for these genes, but it's a lot lower relatively speaking compared to the other TNF targets (the last 40% of target genes in your heatmap). Probably, TNF also has a lot of targets with a high regulatory potential that are not shown in the heatmap.
I understand that this heatmap should ideally visualize relative regulatory potential scores, but this is a bit tricky to do. Some ligands will have more targets than others, so we can't just calculate a z-score. @browaeysrobin and me discussed this several times and we didn't find a good solution yet. I have some more ideas so we might have another try in the future... For now, I would suggest you try to visualize the relative regulatory potential yourself 🙂 .
This will probably make more sense once we have the paper out, which will be there in a week or two.
Best wishes
Wouter
from nichenetr.
saeedfc
commented on May 26, 2024
Dear @zouter ,
Thanks for the detailed response. Thanks again for the tool. Looking forward to the update if you may have one.
Kind regards,
Saeed
from nichenetr.
Related Issues (20)
- Is Peaks a viable default assay of interest>
- About question in "Perform NicheNet analysis with prioritization" vignette HOT 1
- `get_expressed_genes` function for sparse matrix
- get_exprs_avg produced error message HOT 1
- Trouble with get_prioritization_tables HOT 1
- I got trouble when running nichenet_seuratobj_aggregate() HOT 1
- ask questions about model constructing HOT 2
- NicheNet-v2 data source collection and processing (OmniPath)? HOT 2
- generate_prioritization_tables() generates an empty result. HOT 1
- how to use nichenet in cell development data HOT 4
- there is a warning in this shetp-"score ligand-receptor interactions based on expression strength of the receptor"
- Error on get_prioritization_tables() HOT 1
- Error while running get_expressed_genes HOT 5
- So much targets in nichenet_output$ligand_activity_target_heatmap after running nichenet_seuratobj_aggregate HOT 1
- Modeling Inquiry HOT 2
- Error in "evaluate_target_prediction(setting, ligand_target_matrix, ligands_position) : all genes have same response"
- Is there a helper function to draw the plot in the description ? HOT 1
- Inquiry about Signaling and Gene Regulatory Networks Data in Omnipath and NicheNet HOT 1
- Query: AUPR HOT 1
- Error while plotting a ligand-receptor interaction network
Recommend Projects
-
 React
React
A declarative, efficient, and flexible JavaScript library for building user interfaces.
-
Vue.js
🖖 Vue.js is a progressive, incrementally-adoptable JavaScript framework for building UI on the web.
-
 Typescript
TypeScript is a superset of JavaScript that compiles to clean JavaScript output.
-
TensorFlow
An Open Source Machine Learning Framework for Everyone
-
Django
The Web framework for perfectionists with deadlines.
-
 Laravel
A PHP framework for web artisans
-
D3
Bring data to life with SVG, Canvas and HTML. 📊📈🎉
-
Recommend Topics
-
javascript
JavaScript (JS) is a lightweight interpreted programming language with first-class functions.
-
web
Some thing interesting about web. New door for the world.
-
server
A server is a program made to process requests and deliver data to clients.
-
Machine learning
Machine learning is a way of modeling and interpreting data that allows a piece of software to respond intelligently.
-
Visualization
Some thing interesting about visualization, use data art
-
Game
Some thing interesting about game, make everyone happy.
Recommend Org
-
Facebook
We are working to build community through open source technology. NB: members must have two-factor auth.
-
Microsoft
Open source projects and samples from Microsoft.
-
Google
Google ❤️ Open Source for everyone.
-
Alibaba
Alibaba Open Source for everyone
-
D3
Data-Driven Documents codes.
-
Tencent
China tencent open source team.
from nichenetr.