Comments (5)
 pconwell
commented on June 6, 2024
2
pconwell
commented on June 6, 2024
2
Just for future proofing (in case the link above becomes dead), here is an example of the type of "aggregated" heatmap I am referencing:
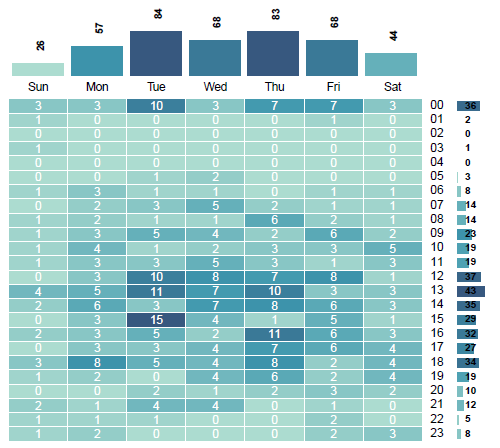
The summary bars on the top/right would be nice - but not critical. This particular chart was generated in R with the following code (yes, I realize R and d3/js have zero overlap):
plotTheHeat <- function(dat) {

  plot_w = 0.85
  plot_h = 0.75


  dat$week <- weekdays(as.Date(dat$ticket_date, format="%m/%d/%Y"), abbreviate=TRUE)
  dat$week <- factor(dat$week, levels=c("Sun", "Mon", "Tue", "Wed", "Thu", "Fri", "Sat"))
  dat$hour <- format(as.POSIXct(dat$ticket_date, format="%m/%d/%Y %H:%M"), "%H")
  dat$hour <- factor(dat$hour, levels=c('00', '01', '02', '03', '04', '05', '06', '07', '08', '09', '10', '11', '12', '13', '14', '15', '16', '17', '18', '19', '20', '21', '22', '23'))
  mat <- table(dat$hour, dat$week)

  colors <- colorRampPalette(c("#adddd1", "#3e98af", "#375980"))


  figs <- rbind(c(0.0, plot_w, plot_h, 1.0), # top
                c(plot_w, 1.0, 0.0, plot_h), # right
                c(0.0, plot_w, 0.0, plot_h)  # main
  )
  colnames(figs) <- c("W", "E", "S", "N")
  rownames(figs) <- c("top", "right", "main")

  screenIDs <- split.screen(figs)
  names(screenIDs) <- rownames(figs)

  screen(screenIDs["top"])
  par(mar=c(0,0,0,plot_w))
  cols <- colors(20)[cut(colSums(mat),20)]
  xs   <- seq_len(ncol(mat))
  ys   <- colSums(mat)
  plot.new()
  plot.window(xlim=c(0, ncol(mat)), ylim=c(0.0, max(ys)*2.5))
  rect(xs-0.95, 0.0, xs-0.05, ys+0.0, col=cols, border="white", lwd=0.5)
  text(xs-0.4, ys, round(ys), pos=3, offset=1.0, srt=90, cex=0.75, font=2)

  screen(screenIDs["right"])
  par(mar=c(0,1-plot_w,1-plot_h,0))
  cols <- colors(20)[cut(rowSums(mat),20)]
  xs   <- rowSums(mat)
  ys   <- seq_len(nrow(mat))
  plot.new()
  plot.window(xlim=c(0, max(xs)*2.5), ylim=c(nrow(mat), 0))
  rect(0, ys-0.9, xs, ys-0.1, col=cols, border="white", lwd=0.75)
  text(0, ys-0.5, round(xs), pos=4, cex=0.75, col="black", font=2)

  screen(screenIDs["main"])
  par(mar=c(0,0,1-plot_h,plot_h))
  cols <- colors(20)[cut(mat,20)]
  xs   <- col(mat)
  ys   <- row(mat)
  plot.new()
  plot.window(xlim=c(0, max(xs)), ylim=rev(c(0, max(ys))))
  rect(xs-1, ys-1, xs, ys, col=cols, border="white", lwd=0.5)
  text(xs-0.5, ys-0.5, round(mat), cex=0.8, col="white", font=0)
  text(xs[1,]-0.5, 0, colnames(mat), pos=3, cex=0.8, xpd=TRUE)
  text(ncol(mat), ys[,1]-0.5, rownames(mat), pos=4, cex=0.8, xpd=TRUE)
  close.screen(screenIDs)
from grafana-hourly-heatmap-panel.
pconwell
commented on June 6, 2024
This is the type of chart I'm looking at: http://bl.ocks.org/ganezasan/dfe585847d65d0742ca7d0d1913d50e1
It's been a long time since I've touched d.3, but I may try to take a look at putting something together if I find time.
from grafana-hourly-heatmap-panel.
 marcusolsson
commented on June 6, 2024
marcusolsson
commented on June 6, 2024
Interesting! So you're essentially transposing the graph and aggregrating into 7 buckets for every day of the week. I think it would be within the scope of the plugin, though I won't be able to look at this myself for a while. If you or anyone else wants to take a shot at it, I'd be happy to review it.
from grafana-hourly-heatmap-panel.
pconwell
commented on June 6, 2024
@marcusolsson Yes! Essentially 168 buckets total (7 days x 24 hours each). Or basically take the current graph and "loop" the 8th day's data back on top of the 1st day, the 9th day's data on top of the 2nd day, etc. In other words, every N%7+X day (where X is 1 - 7 for Sun through Sat) gets aggregated.
I don't have a lot of time in the next month or two either, but after that I should. BUT even then, I'm not super familiar with d3/js, but I'll see if I can work on it.
Thanks!
from grafana-hourly-heatmap-panel.
 dmamalis
commented on June 6, 2024
dmamalis
commented on June 6, 2024
Probably the most missing feature in Grafana! The main reason I go through such plugins every now and then. Awesome work by the way ;-) Full support on this issue!
from grafana-hourly-heatmap-panel.
Related Issues (20)
- Frame for each time group HOT 5
- When I use sum calculation, the value is wrong HOT 1
- Plugin fails to load if not logged in HOT 6
- Heat map time range inconsistent with data HOT 5
- Color option for null values HOT 2
- Grafana v7.5.3/7.5.4 - Color scheme doesn't work HOT 5
- Doesn't seem to work with 3rd party mongodb datasource HOT 1
- Heatmap plugin failed to load on Samsung TV web browser HOT 1
- Group by 120 minutes HOT 3
- Feature request: group across weeks HOT 1
- Legend and tooltip ignores global date formatting HOT 1
- Plugin fails with: Error loading HOT 2
- In a Custom Palette, Spectrum & Colors are not calculated correctly for negative thresholds
- Data link support
- Do not filter by time range
- Hourly Heatmap not taking into account the UTC Grafana is set to HOT 1
- Grafana 9.4.1 seems to have broken plugin HOT 7
- Invalid digital Signature
- Color palette custom return "PT is undefined"
Recommend Projects
-
 React
React
A declarative, efficient, and flexible JavaScript library for building user interfaces.
-
Vue.js
🖖 Vue.js is a progressive, incrementally-adoptable JavaScript framework for building UI on the web.
-
 Typescript
TypeScript is a superset of JavaScript that compiles to clean JavaScript output.
-
TensorFlow
An Open Source Machine Learning Framework for Everyone
-
Django
The Web framework for perfectionists with deadlines.
-
 Laravel
A PHP framework for web artisans
-
D3
Bring data to life with SVG, Canvas and HTML. 📊📈🎉
-
Recommend Topics
-
javascript
JavaScript (JS) is a lightweight interpreted programming language with first-class functions.
-
web
Some thing interesting about web. New door for the world.
-
server
A server is a program made to process requests and deliver data to clients.
-
Machine learning
Machine learning is a way of modeling and interpreting data that allows a piece of software to respond intelligently.
-
Visualization
Some thing interesting about visualization, use data art
-
Game
Some thing interesting about game, make everyone happy.
Recommend Org
-
Facebook
We are working to build community through open source technology. NB: members must have two-factor auth.
-
Microsoft
Open source projects and samples from Microsoft.
-
Google
Google ❤️ Open Source for everyone.
-
Alibaba
Alibaba Open Source for everyone
-
D3
Data-Driven Documents codes.
-
Tencent
China tencent open source team.
from grafana-hourly-heatmap-panel.