Comments (3)
 l4rm4nd
commented on May 15, 2024
l4rm4nd
commented on May 15, 2024
Hi @ovizii,
if you mean the provided logrotate_example.txt, it is currently for the access logs. See the notes.
Optionally configure logrotation on your Docker host server if you've enabled Traefik access logs
For regular container logs, my traefik.yml static configuration file does not even store container logs into an outfile. Therefore, nothing to rotate for.
# Log level INFO|DEBUG|ERROR
log:
  level: INFO
from compose-examples.
 ovizii
commented on May 15, 2024
ovizii
commented on May 15, 2024
Sorry, I'm a bit of an idiot. I didn't specify what I was referring to. Your answer is enough for to answer my question, just adding more context here in case someone else finds this thread at a later time.
My question was related to https://github.com/Haxxnet/Compose-Examples/blob/main/examples/grafana-monitoring/volume-data/promtail/promtail-config.yml
specifically:
  - job_name: traefik
    static_configs:
    - targets:
        - localhost
      labels:
        job: traefiklogs
        __path__: /var/log/traefik/*.log
those logs are traefik access logs.
from compose-examples.
l4rm4nd
commented on May 15, 2024
Sorry, I'm a bit of an idiot. I didn't specify what I was referring to. Your answer is enough for to answer my question, just adding more context here in case someone else finds this thread at a later time.
My question was related to https://github.com/Haxxnet/Compose-Examples/blob/main/examples/grafana-monitoring/volume-data/promtail/promtail-config.yml
specifically:
  - job_name: traefik
    static_configs:
    - targets:
        - localhost
      labels:
        job: traefiklogs
        __path__: /var/log/traefik/*.log
those logs are traefik access logs.
Perfect that you got it sorted. Sorry, could not grasp exactly what you meant due to the missing file reference.
Correct, the promtail config references to the access logs. Promtail will take those access logs and pass it to Loki. Loki will then store them. If you configure Loki within Grafana, you will be able to work on those access logs (e.g. filter them, parse them etc.).
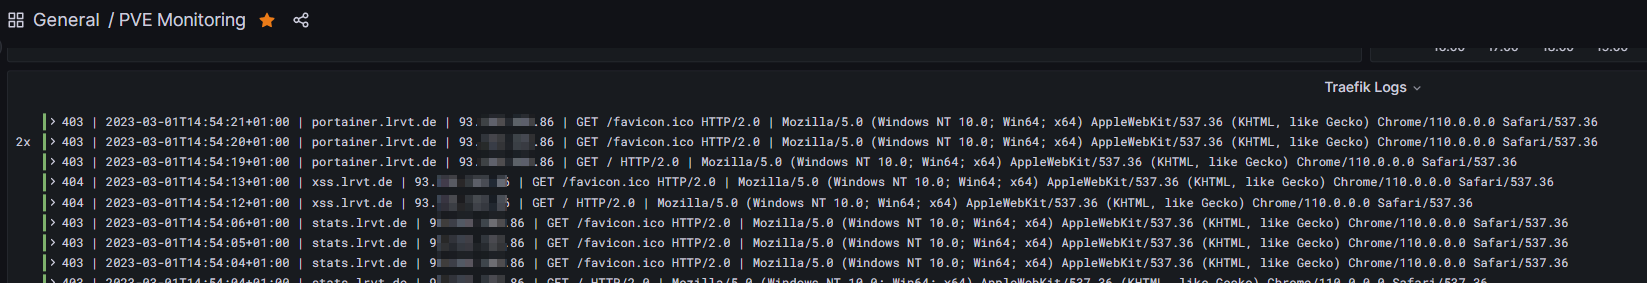
I use the following Loki query, which works great:
{job="traefiklogs"} | json | line_format "{{.OriginStatus}} | {{.time}} | {{.RequestAddr}} | {{.ClientHost}} | {{.RequestMethod}} {{.RequestPath}} {{.RequestProtocol}} | {{.request_User_Agent}}" != "192.168" != "172."
Looks then something like this:
from compose-examples.
Related Issues (11)
- Watchtower schedule follows golangs chron syntax HOT 1
- Paperless-ngx image (linuxserver) is deprecated HOT 2
- IPsec VPN Server on Docker HOT 2
- Question about the grafana stack in regard to telegraf settings HOT 4
- Add LLDAP as identity provider HOT 1
- adguard-home requires port 3000 to be mapped for setup process HOT 2
- [Request] for an example of Unifi-Network-Application from linuxserver.io HOT 16
- Question about Grafana Monitoring set up HOT 1
- Questions about creating networks and global environment variables HOT 1
- Monkeytype with sign-in HOT 5
Recommend Projects
-
 React
React
A declarative, efficient, and flexible JavaScript library for building user interfaces.
-
Vue.js
🖖 Vue.js is a progressive, incrementally-adoptable JavaScript framework for building UI on the web.
-
 Typescript
TypeScript is a superset of JavaScript that compiles to clean JavaScript output.
-
TensorFlow
An Open Source Machine Learning Framework for Everyone
-
Django
The Web framework for perfectionists with deadlines.
-
 Laravel
A PHP framework for web artisans
-
D3
Bring data to life with SVG, Canvas and HTML. 📊📈🎉
-
Recommend Topics
-
javascript
JavaScript (JS) is a lightweight interpreted programming language with first-class functions.
-
web
Some thing interesting about web. New door for the world.
-
server
A server is a program made to process requests and deliver data to clients.
-
Machine learning
Machine learning is a way of modeling and interpreting data that allows a piece of software to respond intelligently.
-
Visualization
Some thing interesting about visualization, use data art
-
Game
Some thing interesting about game, make everyone happy.
Recommend Org
-
Facebook
We are working to build community through open source technology. NB: members must have two-factor auth.
-
Microsoft
Open source projects and samples from Microsoft.
-
Google
Google ❤️ Open Source for everyone.
-
Alibaba
Alibaba Open Source for everyone
-
D3
Data-Driven Documents codes.
-
Tencent
China tencent open source team.
from compose-examples.