Comments (18)
 tunetheweb
commented on May 14, 2024
1
tunetheweb
commented on May 14, 2024
1
Hi Hugh,
It seems like you've done a lot of work to try to improve this and I can really appreciate how frustrating it must be after all that effort to be no further forward.
The good news is that this is explainable. The bad news is you may not like the explanation, and the fix is tougher 😔
First, let's correct a couple of assumptions here:
Cross-origin resources: “LCP media served from other domains do not give render time in the PerformanceObserver API—unless the Timing-Allow-Origin header (TAO) is provided.” I noticed this one only just now and have now added a TAO to my .htaccess file.
You cannot fix this within your .htaccess file as the header needs to be sent on the domain sending the image. If it's the same origin it doesn't need the header, if it's a different origin you likely won't have access to add this (the one exception is if you are in control of the other domain - say it's an asset domain like assets.example.com that you serve images from).
However, TAO isn't the main problem here, so let's move into the tricker issue:
CrUX does measure metrics within iframes, Core Web Vitals javascript does not :
All my iframes are wrapped with div's defined in width and height and overflow: hidden to avoid any CLS
The problem isn't that the iframe itself may move - it's that content within the iframe may shift. Causing CLS.
Web APIs (as used by web-vitals.js and other tools) cannot "see" into iframes. This is a fundamental security restriction for the web platform.
This is noted in the documentation your referenced, and also in the Limitations section of the web-vitals repo:
The primary limitation of these APIs is they have no visibility into <iframe> content (not even same-origin iframes), which means pages that make use of iframes will likely see a difference between the data measured by this library and the data available in the Chrome User Experience Report (which does include iframe content).
CrUX however is measured at a lower-level in the browser where it has access to the full page.
CrUX is more accurate here as the average user has no idea whether content is in an iframe or not and just sees it as page content. So CLS within an iframe is attributed to the top page. Similarly LCP can be either on the main frame, or within an iframe. As Core Web Vitals are intended to measure the user experience, it is correct to measure including iframes.
So let's look at your issues.
First up LCP issue
Running that page through WebPageTest you see the following https://www.webpagetest.org/result/221206_AiDcEC_8P4/ with an LCP of 2.259 seconds (the LCP frame is highlighted in red):

However, you can see the largest element (the video) is not drawn until a good bit later at 7, 8, or even 9 seconds depending which element is the LCP (video's are not eligible for LCP at present, but a static image that YouTube displays before you click play is).
So you can see here clearly that the Web APIs (used by WebPageTest, as well as web-vitals.js) are limited in what they can do on pages with iframes and here are showing the incorrect LCP time - far earlier than when the user sees it.
So what can you do to "solve" this? Having the LCP element within an iframe is going to be tough. You need to load the main document and then load the iframe meaning you are starting from a back foot. This is especially tough for video sites such as yours, when they serve the videos from another platform like YouTube.
To improve this, you could look at your TTFB, which looks very high (2.5 seconds on mobile, and 2 seconds on desktop). Given you want LCP within 2.5 seconds, and have the added issue of your LCP elements being videos, having such a slow TTFB is making a hard task impossible.
How are your pages generated and are there any improvements you can do on your server to make this quicker?
You don't appear to be using a CDN, and using one of them will allow your content to be served closer to users. Looking at Treo.sh you appear to have a globally spread audience so would benefit from a CDN.
Your pages are also ineligible for the bfcache, which is another way to speed up back and forward navigations (to make them instant), which could help your overall page metrics (back/forward navigations make up 20% of mobile navs, and 10% of desktop navs on a typical site). In part this is because of an unload handler added by your "add this" widget. If there was a way to remove that it would enable this "free performance enhancement". The other issue is the YouTube video is similarly added an unload handler to its own frame - the Chrome is working on this, but in meantime the next thing might help with that.
The other option to improve LCP is to NOT have a third-party iframe as the LCP element. Obviously that's what people expect from your site, and I wouldn't suggest self-hosting the videos as videos are complicated (and expensive!) to manage, but you can use a locally hosted image as a facade, and only load the video when the user clicks on it. There are a number of such components that allow you to do this (for example, Lite-youtube-embed or lite-youtube). Appreciate this takes a bit more work than just embedding a youtube video but will be more performant, and also potentially allow you to use the bfcache more.
On to your CLS issue
This one is similar to the above. The CLS is happening in the iframe, and so is invisible to the web APIs.
Dev Tools, does have some limited visibility into CLS (the reasons are complicated and I don't fully understand them myself!), and if you open the Performance panel, play the video (fast forward to about 10 seconds from the end) and then record a performance trace for the last 10 seconds, you see a CLS recorded when the video finishes and YouTube displays the next videos.
This looks to be an issue with YouTube and little that you can control (a colleague has raised it with them internally). It also does not appear to be a user visible CLS - it doesn't appear to "shift" content to me, so may be a false positive.
There is not much you can do on this one for now, but at least you hopefully understand it now. Will see if we can get the YouTube team to fix it.
Conclusion
Wow, so that was quite a detailed deep dive into your issues. As I said at the start you may not like the explanation, and I appreciate that some of this is not within your control, but hopefully you at least understand it better now. The Web Vitals program is intended to measure ALL user experiences, and for the LCP case certainly, I believe CrUX is measuring the "right thing" and the other tools are (through no fault of their own) unable to do this. IFrames are complicated and have security restrictions unfortunately.
It's also important to note that Core Web Vitals does not give any special treatment to YouTube over anyone else. So, like many other providers, they also have work to do to ensure that they don't hinder website's performance. On the plus side, the YouTube team are working on performance as recently showed in this post for their main site. Hopefully some of those learnings will also be able to be made on the embed that other sites use.
Anyway, let me know if that answers your questions (even if it's not the answer you wanted to hear), and if you have any other questions. For now I will close this issue as it's not a "CrUX" issue.
from crux.
 headerbidding
commented on May 14, 2024
headerbidding
commented on May 14, 2024
Hi Barry,
Thank you so much for your explanation for the LCP and CLS discrepancies. I really appreciate your help.
Putting up a “façade” for YouTube embed to speed up LCP, would worsen the user experience, so I won’t do that .
And I cannot do anything about the CLS within the YouTube frame.
So I will focus on increasing TTFB.
I have already started to experiment with Cloudflare running on a parallel domain (flixxy.us) but Cloudflare, even with cached static html, does not show much improvement in the reprts (see Treo report in attached pdf).
This brings me to another discrepancy I did not mention yet:
CrUX reports a TTFB of 2.5 seconds (p.75) (see attached pdf)
Treo.sh shows an FCP in the range from 0.3 (US East) to 1.9 (Australia) measured by Lighthouse
GTMetrix shows a TTFB of 263ms from Vancouver Canada.
I have not yet figured out how to get a TTFB report from web-vitals-script+GA4+BigQuery, but GA-4 Realtime (see attached) shows that 70% of my users experience a TTFB rating of “good” (i.e. less than 800 ms) which is nowhere near the 2500 ms CrUX reports.
How do you explain the TTFB discrepancy between Lighthouse, RUM and CrUX?
Which tool should I use to measure TTFB that gives me instant feedback (rather than having to wait 28 days to see if a change is working or not)?
Again, I really appreciate your help!
Hubert
ttfb-discrepancy-crux-vs-rum.pdf
from crux.
tunetheweb
commented on May 14, 2024
Hey Hubert,
Putting up a “façade” for YouTube embed to speed up LCP, would worsen the user experience, so I won’t do that.
I wouldn't necessarily dismiss this as quickly as that. On slower networks and devices the load wait can seem quite long, and a facade may be a better experience. As an example of how seamless a facade can be, check out an example here - yes we use facades for our videos on web.dev! You can also see the facade simulates the "play" button of a normal YouTube video to make it more seamless to the user.
So I will focus on increasing TTFB. I have already started to experiment with Cloudflare running on a parallel domain (flixxy.us)
That I think is a good thing to do regardless, given your global nature.
but Cloudflare, even with cached static html, does not show much improvement in the reprts (see Treo report in attached pdf). This brings me to another discrepancy I did not mention yet: CrUX reports a TTFB of 2.5 seconds (p.75) (see attached pdf) Treo.sh shows an FCP in the range from 0.3 (US East) to 1.9 (Australia) measured by Lighthouse GTMetrix shows a TTFB of 263ms from Vancouver Canada. I have not yet figured out how to get a TTFB report from web-vitals-script+GA4+BigQuery, but GA-4 Realtime (see attached) shows that 70% of my users experience a TTFB rating of “good” (i.e. less than 800 ms) which is nowhere near the 2500 ms CrUX reports. How do you explain the TTFB discrepancy between Lighthouse, RUM and CrUX?
Ah, you're gonna hate me, but here's some more naunces here to consider, due to what TTFB means. TTFB is measured from when the user starts to navigate until the first byte of the page starts to return - that means it includes any redirect times.
Lighthouse deliberately does not use the term TTFB because in Lighthouse we typically measure the server time, rather than TTFB, after normalising the URL from any redirects. It is also simulated based on a predefined networks which may be slower (or faster!) than users really experience. Not to mention running Lighthouse from a US or UK data centre may be faster, than someone browsing from a poor network, on a train, in the middle of the countryside, or in far away places with poorer network connectivity (think Australia, or India where I noted you seem to have a lot of users).
Say for example a user starts from a Twitter link, it will go through Twitter's URL shortener (t.co), and then redirect to the actual URL. That redirect time is what the user experiences so should be included in total TTFB. But you may be missing that when trying the URL directly in Lighthouse or GTMetrix. Similarly if you use a URL shortener yourself, or use a Ads that redirect before ending up on your website.
Web APIs are also restricted in being able to see this "total TTFB" time, for privacy and security reasons. So web-vitals.js only gets a partial view here too.
CrUX however, again as it's working at a lower level rather than using browser web APIs sees the full amount.
Which tool should I use to measure TTFB that gives me instant feedback (rather than having to wait 28 days to see if a change is working or not)? Again, I really appreciate your help!
Well here's where you get into the limitations of CrUX. CrUX has the most accurate data, for the reasons described above, but as it's a public resource, it's limited in what it can show without revealing more detailed browsing habits of your site and your users. That is part of the reason for the 28-day lag, and it is also to try to smooth out some of the variability in field data to try to give a true sense of the performance of your website, rather than swing up and down depending on brief spurts of good or bad traffic, as is the nature of any site.
So the answer is both. CrUX will give the best results, but with limitations. A RUM solution (including a home-grown one like web-vitals.js) will give the next best thing, and also be better than CrUX in some ways as it will give more detailed information, allow you to drill down on data more, and allow you to view the time span you you want, rather than just the 28-days that CrUX uses (though be aware of variability here!).
Lab based tools like Lighthouse and GTMetrix are more fixed, which can be really helpful to get instant feedback under a set conditions, but you need to calibrate any data you get from that with your field data to ensure that's a realistic measure of your typical traffic.
So, while I understand your measures are not yet showing the results you hope to see, you should keep in mind the limitations of what you are measuring here, and that you may well see quite different results from real users. Hopefully positive (a CDN can only help IMHO), but it also might limit the improvements if they are in large part due to redirects.
I don't know what your analytics are showing as to where the majority of your traffic is coming from, and what pages they are landing on, but it might be worth investigating that, to see if you can figure out how much redirects are influencing your TTFB.
The other thing you can do is looking at Server-Timing to try to explain what's happening on your server for these requests (are the majority served from a cache, or created via an expensive database lookup?). Again that depends on the architecture of your back end. You can also consider upping your 3-hour cache limit to try to increase more cache hits on any CDN you add, and on your users browser cache.
One other thing worth considering, and along similar vein to bfcache, is the (very!) newly released prerender option in Chrome, which can help provide "instant" page loads for your users by preparing pages in advance. As I say, that is literally hot off the press, and I wrote about both bfcache and prerender in this post to explain why it can be so powerful - particularly for sites like yours struggling to meet their Core Web Vitals.
Hope that helps explain the discrepancies you're seeing, and give you some more food for thought on possible ways to resolve this. It may seem like this is a lot, for what seems like a fast site when you try it yourself, but the numbers are highlighting what your users are actually experiencing in real life - and that is the entire intent of the Core Web Vitals initiative!
from crux.
headerbidding
commented on May 14, 2024
Hi Barry,
Thank you so much for your quick and informative reply
You have definitely given me a lot of food for thought.
My site is written in plain html. I use no database, so it should be very fast. And my users, as well as all test tools I have available, including Web-Vitals with GA-4 and BigQuery , all say that my Web Core Metrics are good.
I am disappointed that the time I invested in implementing Web-Vitals with GA-4 and BigQuery was in vain, since it won’t even give me correct TTFB data.
It is very hard to optimize for something that I cannot easily measure.
I think that Google should base its Core Web Vitals on measurements that can easily and timely be replicated by the user, such as the web-vitals script.
But I thank you for your explanations and your desire to help. It is very much appreciated!
Hugh
www.flixxy.com
[Edit:} PS: Looking it over, I think I will go with your suggestion of a "lite YouTube embed" I'll have to wait 28 days to see if it worked though ...
from crux.
tunetheweb
commented on May 14, 2024
I am disappointed that the time I invested in implementing Web-Vitals with GA-4 and BigQuery was in vain, since it won’t even give me correct TTFB data.
It is very hard to optimize for something that I cannot easily measure.
I think that Google should base its Core Web Vitals on measurements that can easily and timely be replicated by the user, such as the web-vitals script.
I hear you. I do think you are an unfortunate, extreme case where your entire site is primarily third-party content in YouTube embeds and, yes they are very hard to measure in the browser.
I shared this case with some other colleagues who work on CWV, and one of them commented that "Their issue was impressive in its comprehensiveness and still two major issues fell through the cracks" showing that you did do an impressive amount of work - and in many ways all the right things - but still were unable to use that to identify the real causes 😔 For the vast majority of sites, the things you did would give valuable insights, even if they are not able to exactly measure the full picture in some cases.
On the other hand, I would say the CrUX dataset, although limited in some ways, has highlighted a potential real issue to you here, so at least that tooling helped surface it, and got you thinking about this more. So that was a big part of the intent of the Core Web Vitals initiative.
And on that note, I dug a little more into the CrUX data by running a SQL query on it's BigQuery dataset and came up with following table (data and query here):

These are all the countries where you have enough data to pass the anonymity threshold and it shows a few interesting things:
- TTFB is only "green" in the USA. And even then 800ms is quite high for a static site suggesting even your US users are slightly slower than ideal (the 800ms "good" threshold is a rough guide, as we like to keep it simple and some sites have a lot of server-side processing so we want to set a realistic target for all sites. As a static site you should be aiming for a lot lower than 800ms as you have no server-side processing at all). It should also be noted that TTFB is not a Core Web Vital so it doesn't have to pass but is intended to be a useful diagnostic metric - like it's proving to be here.
- FCP (also not a CWV and more a diagnostic metric) is strong, even in most countries that have a slow TTFB. This shows your website IS fast once it arrives - thanks to it's static nature.
- LCP is struggling as we know. But it's only 200 milliseconds from the pass rate in USA. I would imagine if you use a CDN, and so reduce that 800ms TTFB for other US users not close to your current data centre, then that could easily be lowered enough to make the pass grade. All the other countries are struggling, broadly inline with the their slower TTFB rates. New Zealand is interesting with 0 LCP. I wonder are they giving up before it loads or is there something else going on here?
- CLS is the YouTube issue we know about (though interestingly affects some countries more than others). We'll keep chasing internally for a fix for that.
So, given all that, I'd say you should continue your investigations into Cloudflare as it's pretty likely that will drastically improve your LCP. I don't know how much traffic you get from each of those countries (other than the fact it's enough to meet the threshold to appear in CrUX) but if non-US traffic is a significant proportion then this could have a major impact. And similarly US traffic from further away parts of the US than where your servers are based, could similarly be boosted as that is dragging down your TTFB to 800ms and I would expect to be a lot lower for a static site if it as located near to the user (like a CDN will effectively make it).
Mobile data looks similar, but more extreme (which is fairly typical):

Interestingly India is primarily mobile (we see this regularly), so much so that desktop usage isn't sufficient to register, and Isreal and New Zealand are the opposite and primarily desktop.
[Edit:} PS: Looking it over, I think I will go with your suggestion of a "lite YouTube embed" I'll have to wait 28 days to see if it worked though ...
Cool. Would be interested to hear back how that goes for you!
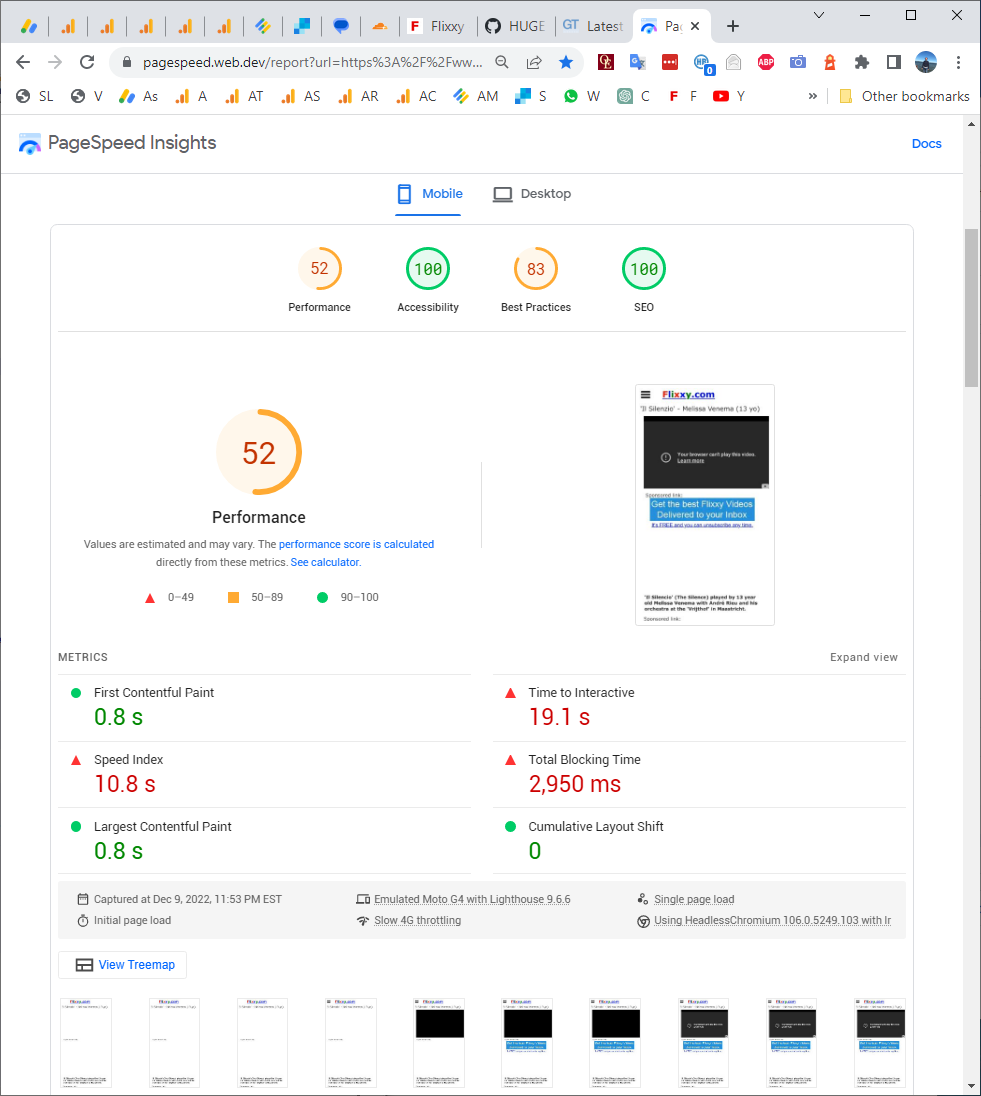
One tip for you, in the expanded view of Page Speed Insights you can see the breakdown of page views in each category:

Although you won't see the full effect until after 28 days, you should hopefully see the percentage of "good" page views increase each day, and once it crosses 75% the category will go green. I talk about that more in this article.
from crux.
headerbidding
commented on May 14, 2024
Dear Barry,
Thank you for the explanations. They are very helpful for me to understand this situation better.
The SQL query by country was very useful to me.
Here is my GA country breakdown over the last 30 days:
| United States | 55% |
|---|---|
| Canada | 14% |
| Australia | 6% |
| South Africa | 6% |
| United Kingdom | 4% |
| Germany | 3% |
| France | 1% |
| Czechia | 1% |
| Italy | 1% |
| New Zealand | 1% |
| Other | 8% |
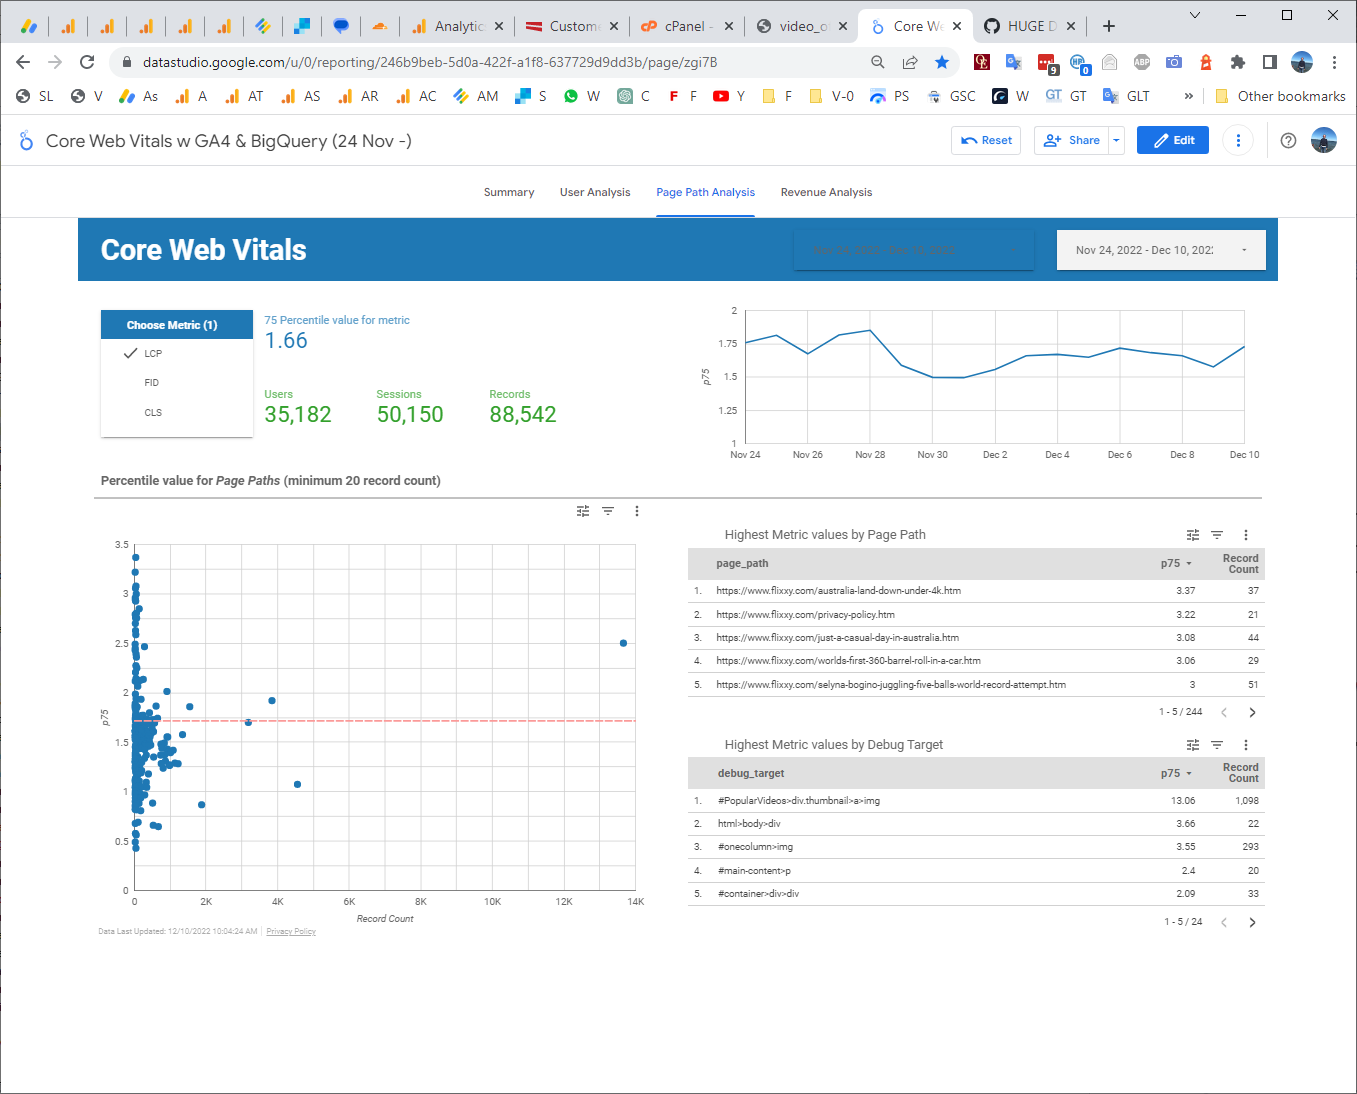
There is another anomaly which I cannot easily explain and perhaps you have an answer to it: In the core-web-vitals + GA4 + BigQuery scattergram (see below), the LCP values average around the 1.7 line. But my most popular page https://www.flixxy.com/trumpet-solo-melissa-venema.htm is an outlier with an LCP of 2.53. This could be due to the fact that the page had viral peaks also in India, Australia and South Africa or perhaps it indicates a server overload issue (which a CDN would fix.) Do you have any thoughts on that?

My plan is to do the following (not necessarily in that sequence):
- Remove the “AddThis” widget to take advantage of the bfcache
- Load fonts locally (I didn’t know that the YouTube video, which needs certain fonts, can be part of the LCP target, so this may help.)
- Implement the Cloudflare CDN
- Implement YouTube lite embed
- Figure out how to add TTFB to the core-web-vitals + GA4 + BigQuery and watch it and the rolling CrUX data closely on a daily basis.
I feel like a student pilot flying a plane with unreliable instruments in dense fog, but thanks to your expert “air traffic control” I feel I will be able to land the plane safely on the “green.” :-)
Thanks for your help. I very much appreciate it.
Hubert
from crux.
tunetheweb
commented on May 14, 2024
There is another anomaly which I cannot easily explain and perhaps you have an answer to it: In the core-web-vitals + GA4 + BigQuery scattergram (see below), the LCP values average around the 1.7 line. But my most popular page https://www.flixxy.com/trumpet-solo-melissa-venema.htm is an outlier with an LCP of 2.53. This could be due to the fact that the page had viral peaks also in India, Australia and South Africa or perhaps it indicates a server overload issue (which a CDN would fix.) Do you have any thoughts on that?
My best guess would be due to those viral peaks rather than server overload, since you're a static site so unlikely to be a server load issue (unless it's truly huge volumes, in which case you're more likely to get time outs rather than delays.). Either way a CDN should help.
Remove the “AddThis” widget to take advantage of the bfcache
You also need to balance the usefulness versus the cost. I don't know if you know if your visitors find this useful? If so, then removing it may give performance benefits but do remember that performance is just one part of user experience so you need to make that call. You could also contact the AddThis team to see if they are aware of this issue?
Also when you start playing a video (which I'd imagine a large proportion of your visitors do?), then you have another bfcache blocker at the moment anyway.
I just checked and your home page (which doesn't load videos, nor AddThis) is eligible for bfcache so maybe that's sufficient?
Anyway, a decision for you to make but possibly not the highest priority (I know you said it wasn't in priority order), and maybe see how the other optimisations fair before looking at this? Or if it's really not used, then maybe go ahead and remove it?
The other items on your list all look good. To the above point, it might be good to try them one at a time and see which has the most impact, and when you're done enough, rather than make lots of changes and not be aware which is the most impactful? I'd love to know myself out of curiosity!
I feel like a student pilot flying a plane with unreliable instruments in dense fog, but thanks to your expert “air traffic control” I feel I will be able to land the plane safely on the “green.” :-)
Ha ha, yes it can feel like that sometimes! But hopefully you've a good understanding now, and also are going to make your users happier!
from crux.
headerbidding
commented on May 14, 2024
I removed AddThis on 12/7/2022, since only a small percentage of my users were using it. Also, their support was not responsive to the issue. I don't see any major changes in the stats I have from web-vitals.js.
I have activated Cloudflare CMS on 12/8/2022 10pm. It hasn't gone live yet, probably due to Nameserver change DNS propagation.
I will keep you updated..
EDIT: Flixxy.com just went live on Cloudflare CMS (12/9/22 9:15pm EST) - caching everything, including html. We should see some improved TTFB and LCP soon.
from crux.
headerbidding
commented on May 14, 2024
Vancouver

London:

Sydney, Australia:

San Antonio, TX:

Mumbai, India:

GTMetrix Desktop Lab Tests are all looking good.
WebPageTest Mobile (MOTOG4 4G) Virginia USA also looks good:


Filmstrip view (with LCP Frame marked in red) is also faster than before.
MotoG4 - 3G - Mumbai, India is also quite good:

except that in Mumbai with 3G the YouTube video takes 18 seconds to load:


And here is Page Speed Insights Mobile (it hasn't changed that much, since it is US based and my hosting provider has very good performance in the US):
and Desktop:

So much for tonight. I should be able to report any changes on the web-vitals.js/GA4/BigQuery LCP daily graph tomorrow.
from crux.
headerbidding
commented on May 14, 2024
FID (Nov 24-Dec 10)

CLS (Nov 24-Dec 10)

LCP (Nov 24-Dec 10)
FID, CLS and LCP graphs in web-vitals.js with GA4 and BigQuery stay unaffected with the change to CDN (probably because 65% of my viewers are in North America. (also, Dec 10 data is not yet complete.)
EDIT 12/10/2022 - 11:30pm: I've come to realize that since the video is really the most important element on my typical page, CrUX (quite correctly in my opinion) uses the inside of the iframe to measures LCP and CLS for my site.
We won't see any major changes until I implement the "facade," so I put up a "facade" for my most popular page: https://flixxy.com/trumpet-solo-melissa-venema.htm just now as a test.
I think we should see some positive changes in CrUX soon.
EDIT 12/13/2022 - 11:45am I see gradual improvements in all Core Web Vitals in the 30 day rolling CrUX report (obtained through PageSpeed Insights) - except CLS, which is staying the same or getting slightly worse.
I hope the YouTube issue will get fixed soon.
from crux.
headerbidding
commented on May 14, 2024

12/8/2022 1:35 AM

12/14/2022 1:49 PM
All stats have been gradually improving - except CSL (any update on that?)
LCP has been improving by 0.175 per day. If the trend continues, I should be in the green in less than 30 days.
(does Google Search Console take the trend into account, or do I have to wait until the 30-day rolling average is >2.5?)
As of 12/14/2022, the most popular (and incidentally worst performing) page https://flixxy.com/trumpet-solo-melissa-venema.htm has the light-youtube embed "Facade".
As of 12/15/2022 all the popular video pages are served using "lite-youtube-embed".
from crux.
headerbidding
commented on May 14, 2024
Trying to find a "work-around" the CLS issue, I looked at other video pages on the web that have a good CLS rating.
There are several examples that have embedded YouTube videos and still have an excellent CLS, e.g. https://www.bestofyoutube.com/
Another example is the web.dev page you mentioned earlier. https://web.dev/bfcache/#:~:text=Check%20out%20this%20video%20of%20bfcache%20in%20action%20to%20understand%20the%20speed%20up%20it%20can%20bring%20to%20navigations%3A
Looking at the performance tab of that page, when the video ends and switches to the recommended videos screen, there is a huge CLS:

But that CLS score does not reflect on the Google Core Web Vitals assessment of that page (which is as it should be):

So once again I am at a stuck point. Where do I go from here to receive a "green" CLS rating for my site from Google?
You have been very helpful in getting me through the LCP hurdle. I am sure you can wave your magic wand and help me through the remaining CLS issue.
from crux.
headerbidding
commented on May 14, 2024
Hi Barry,
Any thoughts on the CLS issue?
Hugh
from crux.
tunetheweb
commented on May 14, 2024
Hi @headerbidding , good to see your LCP changes are having the desired effect and your LCP is improving nicely. Hopefully you'll cross the "good" threshold over next few weeks!
For CLS there is not a huge amount you can do, as this is an issue in YouTube and the way it moves content around. Since it's not really a user-visible shift it's arguable whether ti should affect CLS but currently it does unfortunately. We've raised it with YouTube, but not got an ETA of if/when it will be fixed.
As to why those other sites do not see a similar CLS, it is probably a combination of: 1) visitors not waiting until the end of the video and 2) the video being smaller on the page, so even if it has CLS, it may not affect as much. The bfcache article in particularly likely has a lot of visitors who don't even watch the video.
The only other thing I can think of is to loop the video with the &loop=1 attribute on the YouTube URL. That might avoid the CLS caused by other videos it shows, but the downside is the video will endlessly loop which may not be what your users desire. The CWVs are just one of many measures of user experience so I wouldn't put worse UX up just to pass those. So you may just have to be patient here until YouTube resolves this.
from crux.
headerbidding
commented on May 14, 2024
Hi Barry!
The desktop LCP crossed the "good" threshold on Dec 14 and the mobile LCP went from "bad" to "needs improvement" on Dec. 27. From the trend, it looks like mobile LCP should also be "good" in the next few days.
Thank you so much - without your help I couldn't have done it!
Desktop CLS is coming down from 0.4 to the mobile CLS level of 0.2, probably due to the many tweaks I am doing.
But in the end, we have to wait for YouTube to fix it.
EDIT: It is possible that there are parameters or structural idiosyncrasies on my site that make the CLS worse, so I continue to experiment and streamline my site.
I have 3 more fundamental questions:
- Aside from the 5-second session window, does CrUX use the exact same measuring mechanism as Chrome DevTools? (This is important to know, as Chrome DevTools is the only relevant CLS measurement tool I have available.)
- With the CrUX API, is it possible to selectively chose the dates of the last 30 day rolling window? In other words, can I find out what my CLS values were last week for example? (If yes, it would make it worthwhile for me to spend the time necessary to learn how to use the API.)
- Because of my yellow "needs improvement" CLS, the Google Search Console Page Experience Overview header keeps reminding me "No URLs with a good page experience on mobile or desktop." Is that a black/white issue with Google Search?
Or is it being evaluated on a gradual score>
Thank you again for all your help. It is very much appreciated!
Hugh
PS: Looking forward to the CrUX December report tomorrow!
from crux.
tunetheweb
commented on May 14, 2024
Great news on your LCP improvements!
I also see you seem to have found a way to change the change the ending of videos to give a different "If you like this video" screen which seems to have less CLS? Not sure how you did that, but it seems to be having a positive impact on CLS!
Aside from the 5-second session window, does CrUX use the exact same measuring mechanism as Chrome DevTools? (This is important to know, as Chrome DevTools is the only relevant CLS measurement tool I have available.)
We were actually discussing this internally. And the answer is... it's complicated and Dev Tools may not always exactly show the same as CrUX, but it's the closest you can get at present.
With the CrUX API, is it possible to selectively chose the dates of the last 30 day rolling window? In other words, can I find out what my CLS values were last week for example? (If yes, it would make it worthwhile for me to spend the time necessary to learn how to use the API.)
At the moment this is not possibly, but it has been something requested in the past and it is something we're actively working on. Will try to remember to comment here when there's an update on that.
Because of my yellow "needs improvement" CLS, the Google Search Console Page Experience Overview header keeps reminding me "No URLs with a good page experience on mobile or desktop." Is that a black/white issue with Google Search? Or is it being evaluated on a gradual score>
I don't work on Search and so don't have a direct insight to this, but this question in this video answers that question (or also from this, more rough tweet from John from the Search team).
from crux.
headerbidding
commented on May 14, 2024
Hi Barry,
Thank you so much again for your informative and precise answers.
The CLS issue in video iframes is not limited to YouTube. it also occurs on dailymotion, for example:
https://www.flixxy.com/ballet-flash-mob-in-the-moscow-metro.htm
Since users expect "layout shifts" in video iframes, wouldn't it make sense to solve the issue at the root and simply include a piece of code in the CrUX data collection code, such as: "if CLS occurs within video iframe, then ignore it"
EDIT: It is probably very difficult for YouTube and Dailymotion, etc. to "fix" it and that's probably why they haven't done it yet and possibly never will.
Best regards,
Hugh
EDIT: PS: I forgot to mention that the layout shift does not only occur when related video recommendations pop up at the end of each video, but also when there are annotations (cards) that can occur at any point during the video.
from crux.
headerbidding
commented on May 14, 2024
Hi Barry,
After hundreds of hours of work and six month later Google Search Console still says for http://www.flixxy.com:
"No URLs with a good page experience on mobile" (but I do have "100% good URLs on desktop")
Using the YouTube "loop" parameter worked to eliminate CLS for desktop - but not for mobile.
My site is rock solid. There are no real layout shifts that are creating a negative user experience. The only issue is YouTube, Vimeo, etc videos in an iframe showing "cards" and "annotations" - which are expected by the user and should not be interpreted as CLS.
I would think that a line of code "ignore CLS within a video iframe" should fix it. Why is it taking Google so long?
Thank you for your help.
Hugh

from crux.
Related Issues (15)
- Readme links to create new issues are 404'ing HOT 3
- Make page level data available in BigQuery HOT 3
- Automatically Close Unused Tabs HOT 1
- Not automatically enabling URL normalization
- Ideas and innovation
- URL Category
- Multiple Metrics in one Query HOT 1
- Improve repo documentation
- Relation between CrUX, Google Search Console and iOS devices
- countries.json lists "bg" as Kosovo HOT 1
- Build a CrUX origin search tool HOT 2
- CLS & Argument type mismatch in function LESS HOT 1
- Google Chrome causes the modem to reboot HOT 1
- Count FID = NULL as passing CWV assesment
Recommend Projects
-
 React
React
A declarative, efficient, and flexible JavaScript library for building user interfaces.
-
Vue.js
🖖 Vue.js is a progressive, incrementally-adoptable JavaScript framework for building UI on the web.
-
 Typescript
TypeScript is a superset of JavaScript that compiles to clean JavaScript output.
-
TensorFlow
An Open Source Machine Learning Framework for Everyone
-
Django
The Web framework for perfectionists with deadlines.
-
 Laravel
A PHP framework for web artisans
-
D3
Bring data to life with SVG, Canvas and HTML. 📊📈🎉
-
Recommend Topics
-
javascript
JavaScript (JS) is a lightweight interpreted programming language with first-class functions.
-
web
Some thing interesting about web. New door for the world.
-
server
A server is a program made to process requests and deliver data to clients.
-
Machine learning
Machine learning is a way of modeling and interpreting data that allows a piece of software to respond intelligently.
-
Visualization
Some thing interesting about visualization, use data art
-
Game
Some thing interesting about game, make everyone happy.
Recommend Org
-
Facebook
We are working to build community through open source technology. NB: members must have two-factor auth.
-
Microsoft
Open source projects and samples from Microsoft.
-
Google
Google ❤️ Open Source for everyone.
-
Alibaba
Alibaba Open Source for everyone
-
D3
Data-Driven Documents codes.
-
Tencent
China tencent open source team.
from crux.