Comments (26)
 paulcarroty
commented on May 26, 2024
3
paulcarroty
commented on May 26, 2024
3
I wrote the simple aggregator - https://github.com/paulcarroty/flathub-app-stats which gives simple y-m-w-d stats for each app. His results can be easily parsed from Flathub frontend.
Statistics are updated daily with TravisCI worker.
Ping @alexlarsson @ahayzen
from linux-store-frontend.
 razzeee
commented on May 26, 2024
3
razzeee
commented on May 26, 2024
3
Added a basic version to the new frontend https://flathub.vercel.app/apps/details/com.valvesoftware.Steam
from linux-store-frontend.
 jgarciao
commented on May 26, 2024
1
jgarciao
commented on May 26, 2024
1
Hi Paul,
Firt of all thanks for your contribution. I've been away from keyboard most of August and now I'm slowly starting to catch up with the development of the website (I'm doing this in my spare time)
My idea was to implement something similar to your code in linux-store-backend and store the results in the database. I also want to have ostree commit information for each app/runtime in order to have downloads by commit to try to better guess active users per app
I don't have any estimation when this will be available
from linux-store-frontend.
razzeee
commented on May 26, 2024
1
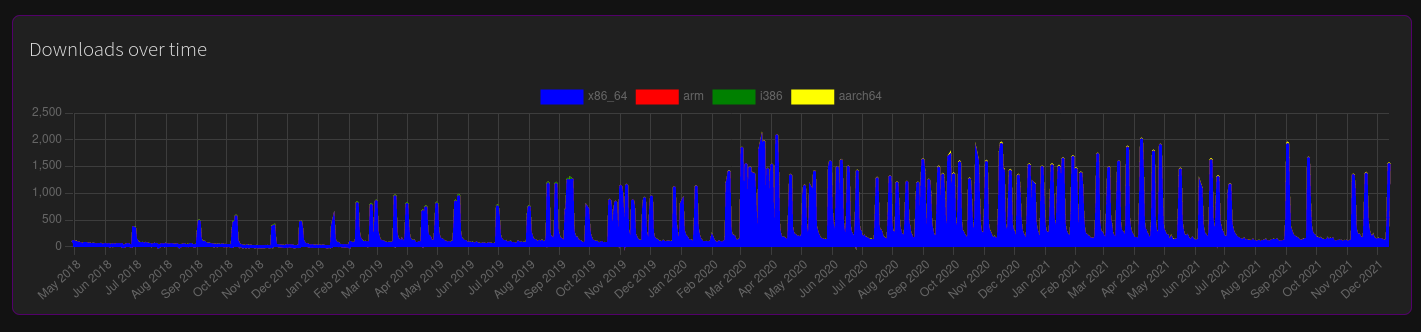
Having had a look (don't mind the colors) it doesn't seem to make sense, to add this to the user facing page. With that chart height and low downloads of all but one platform, even a stacked bar chart becomes unusable.
The yellow here for e.g. are aarch64 downloads.
from linux-store-frontend.
 real-yfprojects
commented on May 26, 2024
1
real-yfprojects
commented on May 26, 2024
1
Having had a look (don't mind the colors) it doesn't seem to make sense, to add this to the user facing page. With that chart height and low downloads of all but one platform, even a stacked bar chart becomes unusable.
The yellow here for e.g. are aarch64 downloads.
I suggest aggregating the downloads per month in that chart. Then it only has a single data point per month.
from linux-store-frontend.
 allanday
commented on May 26, 2024
allanday
commented on May 26, 2024
I agree that this would be good to have, but I wouldn't go too wild. Perhaps just a total number of downloads, or something.
from linux-store-frontend.
 ahayzen
commented on May 26, 2024
ahayzen
commented on May 26, 2024
FYI as some of the graphs I was looking at doing might not go onto flathub.org, i added support in my tool to generate them. I have made a simple page which shows them here https://ahayzen.com/direct/flathub.html Let me know if you do want any of them or have suggestions, will be happy to help :-)
I personally think that having "Downloads in the past N days" is also useful (maybe we need both) - as if an app had all its downloads in 1 month last year, it is not useful to know that it was downloaded 1000 times last year. I guess that users want to know that this app is current and other people are downloading it. (But then the total downloads is useful for an app author)
Wonder which other info is useful to show ? Maybe some overall graphs are will become interesting overtime ...
from linux-store-frontend.
jgarciao
commented on May 26, 2024
I was thinking of adding a couple of fields in the Additional information section:
- Installs: sum of all installs for all the architectures since the app was first published (or since we have stats)
- Installs (current version) : Installs/updates for all the architectures since current version was published in the store
Instead of detailed numbers we can use ranges like in google play (0-100, 100-1000, 1000-10.000, ...)
A couple of interesting related articles:
- What is the meaning of 1,000,000-5,000,000 installs in google play?
- Discrepancies - How Does AppsFlyer Count Installs Compared To App Store and Google Play?
from linux-store-frontend.
allanday
commented on May 26, 2024
What's the reason for showing the number of installs for the current version, @jgarciao ?
from linux-store-frontend.
 TingPing
commented on May 26, 2024
TingPing
commented on May 26, 2024
For what its worth the Snapcraft dashboard shows number of active installs by version which I do believe is useful. One problem is that our stats have no clue really how many of those are active installs or not. Showing the number that got the latest version is probably the closest number to that we have.
from linux-store-frontend.
ahayzen
commented on May 26, 2024
@TingPing that's not on the public facing one though ? (That's on the developer dashboard right ?)
Eg https://snapcraft.io/core only shows users by distribution (logarithmic).
And yeah we don't know active users without looking at number of updates since the last release.
from linux-store-frontend.
jgarciao
commented on May 26, 2024
It can give you a clue about the number of active users (users that "use"
the app because they update it when a new version is published). But the
"accuracy" depends on how often the app publishes a new version...
El dt., 29 de maig 2018, 18:02, Allan Day <[email protected]> va
escriure:
… What's the reason for showing the number of installs for the current
version, @jgarciao <https://github.com/jgarciao> ?
—
You are receiving this because you were mentioned.
Reply to this email directly, view it on GitHub
<#19 (comment)>,
or mute the thread
<https://github.com/notifications/unsubscribe-auth/AAEFTqT_2yisYSgPlEMYjanB2kMSpBbwks5t3XEHgaJpZM4QxAYx>
.
from linux-store-frontend.
allanday
commented on May 26, 2024
It can give you a clue about the number of active users
I'm not sure that will be obvious to regular users. It does seem like useful information if you're the developer of the app though.
from linux-store-frontend.
TingPing
commented on May 26, 2024
@ahayzen Yes the dev only dashboard.
I'm guessing @jgarciao doesn't want to start adding accounts to the website though.
from linux-store-frontend.
allanday
commented on May 26, 2024
Automated emails might be one alternative for providing feedback to developers.
from linux-store-frontend.
 jurf
commented on May 26, 2024
jurf
commented on May 26, 2024
@paulcarroty what happened to that?
from linux-store-frontend.
paulcarroty
commented on May 26, 2024
@jurf the downloads of every app was calculated & sorted for 4 periods.
from linux-store-frontend.
jurf
commented on May 26, 2024
Oh, I thought that would be daily.
from linux-store-frontend.
 BrunoVernay
commented on May 26, 2024
BrunoVernay
commented on May 26, 2024
It would be nice to be able to filter by "Last update" 1 year / 2 year ... and by number of downloads too.
I think it relates to this thread, but I could add an new issue if needed.
from linux-store-frontend.
jurf
commented on May 26, 2024
I agree with @aday, this might be confusing for regular users (great for developers though). A total installs counter might be a good conservative start.
from linux-store-frontend.
 fedelibre
commented on May 26, 2024
fedelibre
commented on May 26, 2024
@razzeee How can I check the number of downloads per architecture? I know this is not useful for users, but as a maintainer I'm interested to know the number of downloads of aarch64 packages.
from linux-store-frontend.
razzeee
commented on May 26, 2024
I can adjust the logic, to keep that data around and display it. It might not be a good idea for the normal flathub detail page, but we could start with that.
The data is available on https://flathub.org/stats/2021/06/06.json for e.g.
from linux-store-frontend.
BrunoVernay
commented on May 26, 2024
A per year granularity would be enough and more readable.
Having the 4 architectures does not look like a problem to me, it just show the reality, at least for this package.
from linux-store-frontend.
razzeee
commented on May 26, 2024
Haven't found any package that's different, most are in deed worse, I've picked one with not as many downloads in general for the above.
Makes me wonder, if a pie chart with just all downloads by arch would be more usefull, but you won't be able to see trends there.
from linux-store-frontend.
BrunoVernay
commented on May 26, 2024
Good idea and the sum over the last 6 months could be used to sort by number of downloads.
And already think about a way to prevent or at least alert in case this system is abused to artificially increase the number of downloads to trick people into installing a bad package
from linux-store-frontend.
real-yfprojects
commented on May 26, 2024
Good idea and the sum over the last 6 months could be used to sort by number of downloads.
How are the apps for most popular currently calculated?
And already think about a way to prevent or at least alert in case this system is abused to artificially increase the number of downloads to trick people into installing a bad package
That's one of the reasons why other package distribution sites like pypi.org do not provide stats in their web GUI. However npmjs.com do show weekly download stats for the last year.
from linux-store-frontend.
Related Issues (20)
- Internal Server Error for RSS feed HOT 3
- Show more items on the new & updated page HOT 2
- stale beta apps in flathub-beta HOT 9
- Respect dark mode preference
- Deploy preview is always broken HOT 1
- Add tags to filter apps
- Add a headsup, that this frontend will be replaced
- app Publisher > See details link shows misleading Contributions graph
- https://status.flathub.org/ is a 404 (even though it's Status OK)
- clicking the magnifying glass doesn't focus the search input field HOT 1
- Support markdown in descriptions HOT 2
- New & Updated Apps should be split to New Apps and Updated Apps
- "Quick setup" redirects to http://flatpak.org:8080/setup
- flathub returns 200 Status OK for broken URLs instead of 404.
- Add Twitter cards metadata to Flathub
- https://status.flathub.org unreachable because of SSL_ERROR_INTERNAL_ERROR_ALERT HOT 1
- Specify licence in scripts
- Preview images are broken or deformed on the main website
- Warning: Potential Security Risk Ahead when Visiting https://status.flathub.org
- URLs in RSS <link> tags result in a 404 error HOT 1
Recommend Projects
-
 React
React
A declarative, efficient, and flexible JavaScript library for building user interfaces.
-
Vue.js
🖖 Vue.js is a progressive, incrementally-adoptable JavaScript framework for building UI on the web.
-
 Typescript
TypeScript is a superset of JavaScript that compiles to clean JavaScript output.
-
TensorFlow
An Open Source Machine Learning Framework for Everyone
-
Django
The Web framework for perfectionists with deadlines.
-
 Laravel
A PHP framework for web artisans
-
D3
Bring data to life with SVG, Canvas and HTML. 📊📈🎉
-
Recommend Topics
-
javascript
JavaScript (JS) is a lightweight interpreted programming language with first-class functions.
-
web
Some thing interesting about web. New door for the world.
-
server
A server is a program made to process requests and deliver data to clients.
-
Machine learning
Machine learning is a way of modeling and interpreting data that allows a piece of software to respond intelligently.
-
Visualization
Some thing interesting about visualization, use data art
-
Game
Some thing interesting about game, make everyone happy.
Recommend Org
-
Facebook
We are working to build community through open source technology. NB: members must have two-factor auth.
-
Microsoft
Open source projects and samples from Microsoft.
-
Google
Google ❤️ Open Source for everyone.
-
Alibaba
Alibaba Open Source for everyone
-
D3
Data-Driven Documents codes.
-
Tencent
China tencent open source team.
from linux-store-frontend.